Zip Codes with the Highest Percentage of Population Employed in Accommodation & Food Services in Monterey Park, CA
RELATED REPORTS & OPTIONS
Accommodation & Food Services
Monterey Park
Compare Zip Codes
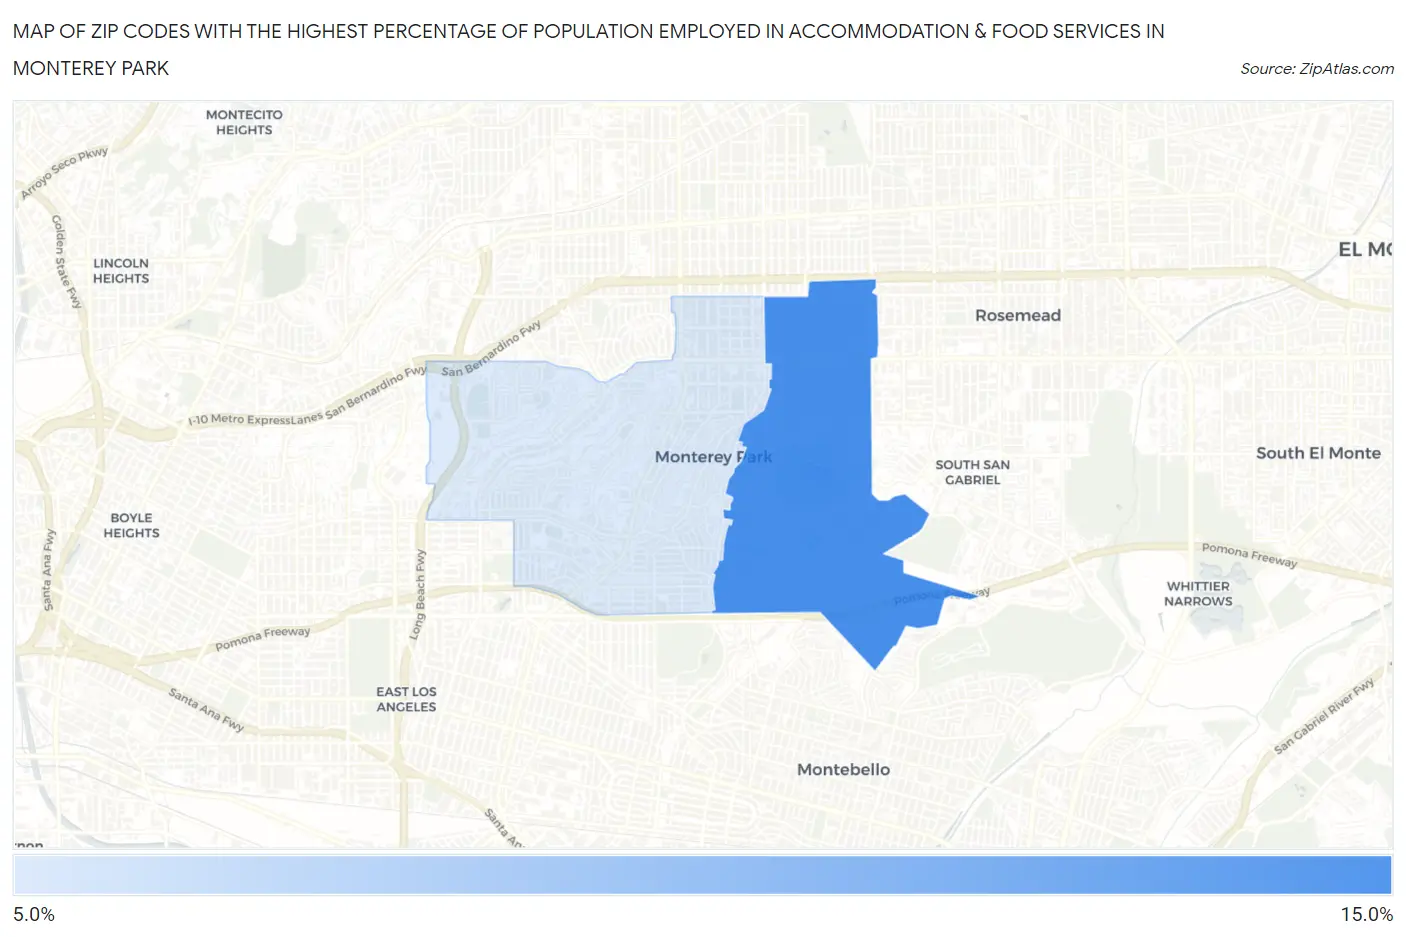
Map of Zip Codes with the Highest Percentage of Population Employed in Accommodation & Food Services in Monterey Park
8.9%
13.7%
Zip Codes with the Highest Percentage of Population Employed in Accommodation & Food Services in Monterey Park, CA
| Zip Code | % Employed | vs State | vs National | |
| 1. | 91755 | 13.7% | 7.2%(+6.51)#138 | 6.9%(+6.80)#2,059 |
| 2. | 91754 | 8.9% | 7.2%(+1.70)#408 | 6.9%(+1.99)#6,159 |
1
Common Questions
What are the Top Zip Codes with the Highest Percentage of Population Employed in Accommodation & Food Services in Monterey Park, CA?
Top Zip Codes with the Highest Percentage of Population Employed in Accommodation & Food Services in Monterey Park, CA are:
What zip code has the Highest Percentage of Population Employed in Accommodation & Food Services in Monterey Park, CA?
91755 has the Highest Percentage of Population Employed in Accommodation & Food Services in Monterey Park, CA with 13.7%.
What is the Percentage of Population Employed in Accommodation & Food Services in Monterey Park, CA?
Percentage of Population Employed in Accommodation & Food Services in Monterey Park is 11.0%.
What is the Percentage of Population Employed in Accommodation & Food Services in California?
Percentage of Population Employed in Accommodation & Food Services in California is 7.2%.
What is the Percentage of Population Employed in Accommodation & Food Services in the United States?
Percentage of Population Employed in Accommodation & Food Services in the United States is 6.9%.