Zip Codes with the Highest Percentage of Population Employed in Accommodation & Food Services in Duarte, CA
RELATED REPORTS & OPTIONS
Accommodation & Food Services
Duarte
Compare Zip Codes
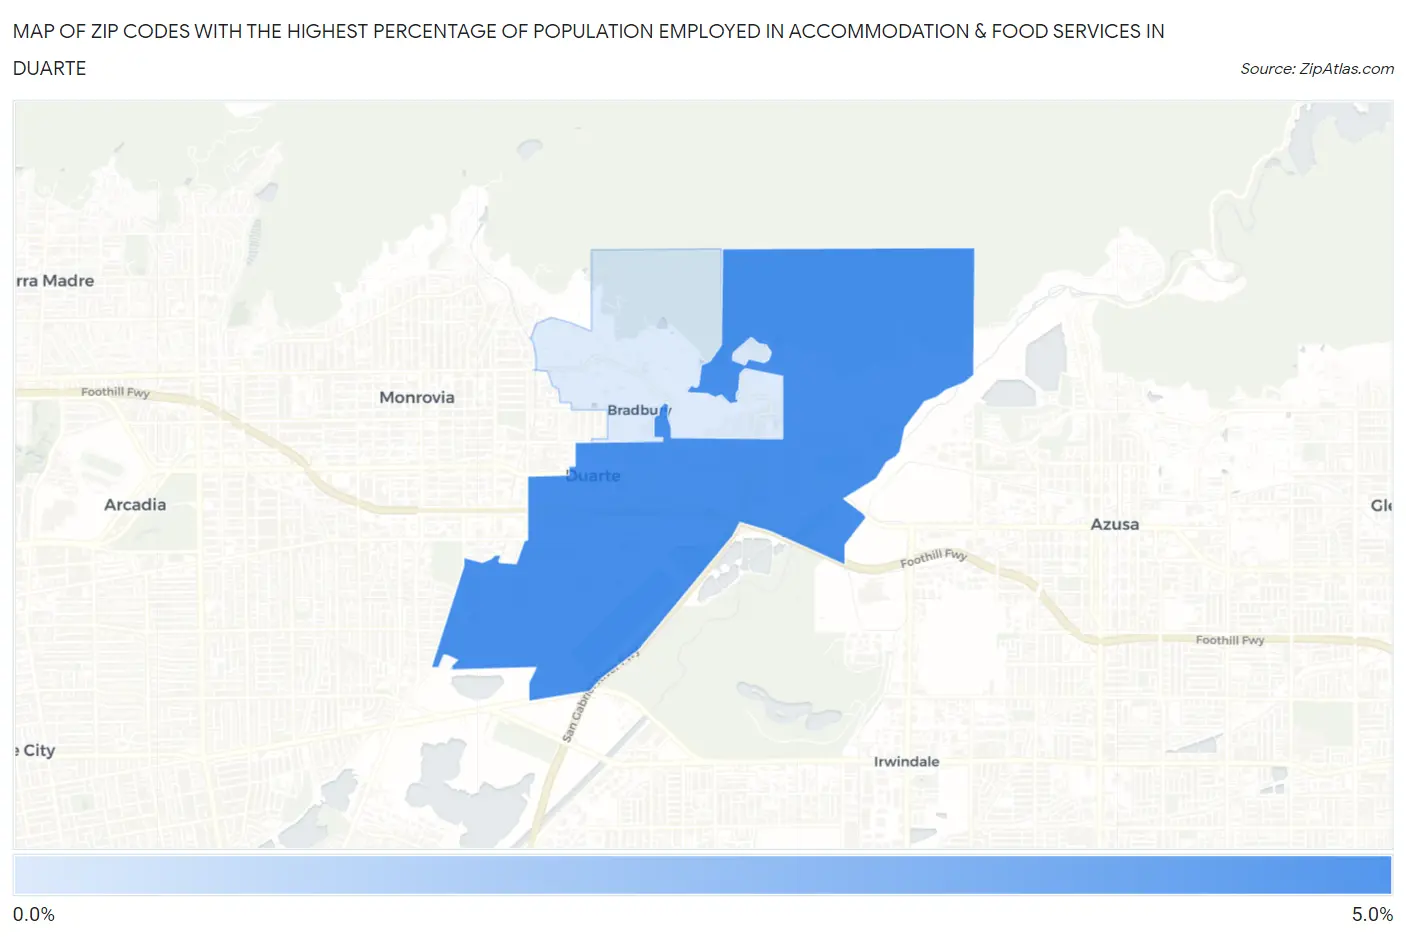
Map of Zip Codes with the Highest Percentage of Population Employed in Accommodation & Food Services in Duarte
0.28%
4.6%
Zip Codes with the Highest Percentage of Population Employed in Accommodation & Food Services in Duarte, CA
| Zip Code | % Employed | vs State | vs National | |
| 1. | 91010 | 4.6% | 7.2%(-2.54)#1,187 | 6.9%(-2.25)#18,068 |
| 2. | 91008 | 0.28% | 7.2%(-6.89)#1,545 | 6.9%(-6.60)#28,005 |
1
Common Questions
What are the Top Zip Codes with the Highest Percentage of Population Employed in Accommodation & Food Services in Duarte, CA?
Top Zip Codes with the Highest Percentage of Population Employed in Accommodation & Food Services in Duarte, CA are:
What zip code has the Highest Percentage of Population Employed in Accommodation & Food Services in Duarte, CA?
91010 has the Highest Percentage of Population Employed in Accommodation & Food Services in Duarte, CA with 4.6%.
What is the Percentage of Population Employed in Accommodation & Food Services in Duarte, CA?
Percentage of Population Employed in Accommodation & Food Services in Duarte is 3.8%.
What is the Percentage of Population Employed in Accommodation & Food Services in California?
Percentage of Population Employed in Accommodation & Food Services in California is 7.2%.
What is the Percentage of Population Employed in Accommodation & Food Services in the United States?
Percentage of Population Employed in Accommodation & Food Services in the United States is 6.9%.