Zip Codes with the Highest Percentage of Population Employed in Accommodation & Food Services in Grass Valley, CA
RELATED REPORTS & OPTIONS
Accommodation & Food Services
Grass Valley
Compare Zip Codes
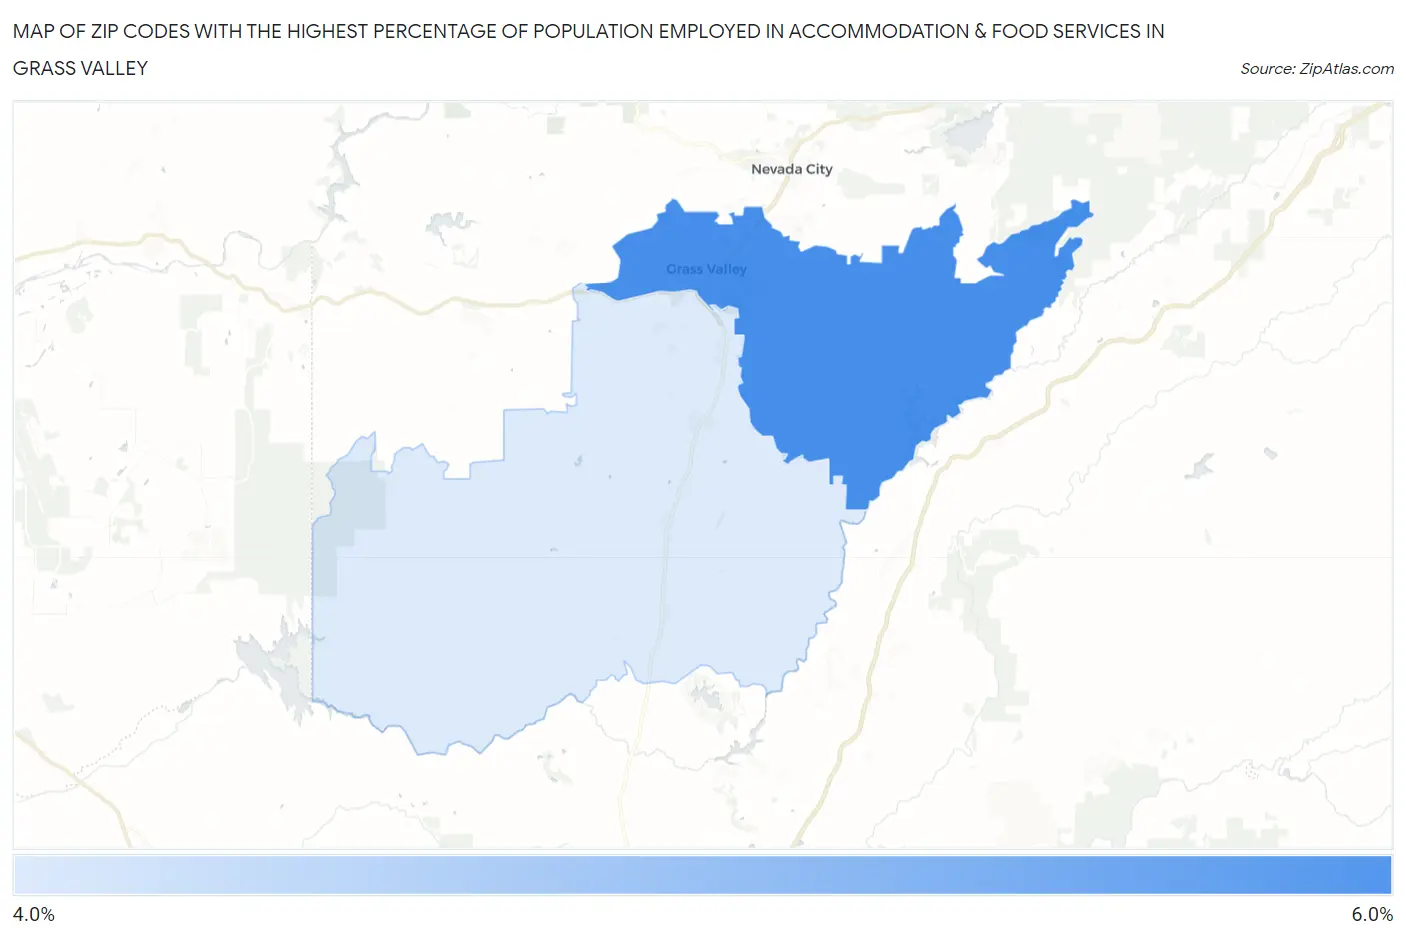
Map of Zip Codes with the Highest Percentage of Population Employed in Accommodation & Food Services in Grass Valley
4.5%
5.1%
Zip Codes with the Highest Percentage of Population Employed in Accommodation & Food Services in Grass Valley, CA
| Zip Code | % Employed | vs State | vs National | |
| 1. | 95945 | 5.1% | 7.2%(-2.11)#1,108 | 6.9%(-1.82)#16,612 |
| 2. | 95949 | 4.5% | 7.2%(-2.64)#1,205 | 6.9%(-2.35)#18,380 |
1
Common Questions
What are the Top Zip Codes with the Highest Percentage of Population Employed in Accommodation & Food Services in Grass Valley, CA?
Top Zip Codes with the Highest Percentage of Population Employed in Accommodation & Food Services in Grass Valley, CA are:
What zip code has the Highest Percentage of Population Employed in Accommodation & Food Services in Grass Valley, CA?
95945 has the Highest Percentage of Population Employed in Accommodation & Food Services in Grass Valley, CA with 5.1%.
What is the Percentage of Population Employed in Accommodation & Food Services in Grass Valley, CA?
Percentage of Population Employed in Accommodation & Food Services in Grass Valley is 5.4%.
What is the Percentage of Population Employed in Accommodation & Food Services in California?
Percentage of Population Employed in Accommodation & Food Services in California is 7.2%.
What is the Percentage of Population Employed in Accommodation & Food Services in the United States?
Percentage of Population Employed in Accommodation & Food Services in the United States is 6.9%.