Zip Codes with the Highest Percentage of Population Employed in Accommodation & Food Services in Glendale, CA
RELATED REPORTS & OPTIONS
Accommodation & Food Services
Glendale
Compare Zip Codes
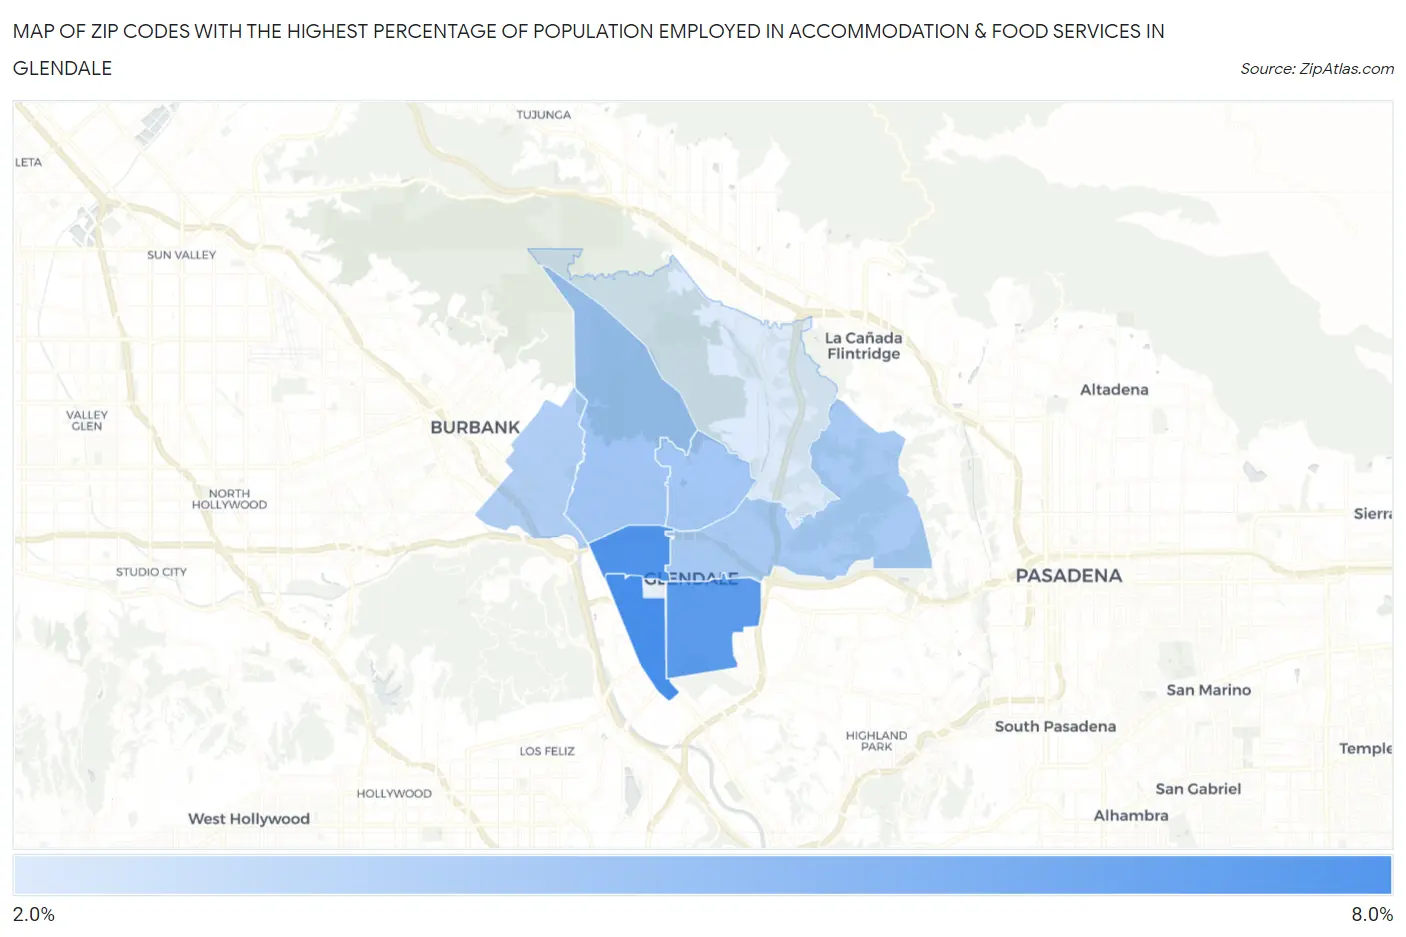
Map of Zip Codes with the Highest Percentage of Population Employed in Accommodation & Food Services in Glendale
2.9%
7.6%
Zip Codes with the Highest Percentage of Population Employed in Accommodation & Food Services in Glendale, CA
| Zip Code | % Employed | vs State | vs National | |
| 1. | 91204 | 7.6% | 7.2%(+0.409)#598 | 6.9%(+0.699)#8,790 |
| 2. | 91203 | 7.3% | 7.2%(+0.112)#655 | 6.9%(+0.402)#9,583 |
| 3. | 91205 | 7.0% | 7.2%(-0.171)#715 | 6.9%(+0.119)#10,305 |
| 4. | 91202 | 4.7% | 7.2%(-2.43)#1,162 | 6.9%(-2.14)#17,674 |
| 5. | 91207 | 4.7% | 7.2%(-2.48)#1,172 | 6.9%(-2.19)#17,842 |
| 6. | 91206 | 4.5% | 7.2%(-2.65)#1,207 | 6.9%(-2.36)#18,418 |
| 7. | 91201 | 4.3% | 7.2%(-2.82)#1,233 | 6.9%(-2.53)#19,000 |
| 8. | 91208 | 2.9% | 7.2%(-4.25)#1,417 | 6.9%(-3.96)#23,421 |
1
Common Questions
What are the Top 5 Zip Codes with the Highest Percentage of Population Employed in Accommodation & Food Services in Glendale, CA?
Top 5 Zip Codes with the Highest Percentage of Population Employed in Accommodation & Food Services in Glendale, CA are:
What zip code has the Highest Percentage of Population Employed in Accommodation & Food Services in Glendale, CA?
91204 has the Highest Percentage of Population Employed in Accommodation & Food Services in Glendale, CA with 7.6%.
What is the Percentage of Population Employed in Accommodation & Food Services in Glendale, CA?
Percentage of Population Employed in Accommodation & Food Services in Glendale is 5.4%.
What is the Percentage of Population Employed in Accommodation & Food Services in California?
Percentage of Population Employed in Accommodation & Food Services in California is 7.2%.
What is the Percentage of Population Employed in Accommodation & Food Services in the United States?
Percentage of Population Employed in Accommodation & Food Services in the United States is 6.9%.