Zip Codes with the Highest Percentage of Population Employed in Accommodation & Food Services in San Gabriel, CA
RELATED REPORTS & OPTIONS
Accommodation & Food Services
San Gabriel
Compare Zip Codes
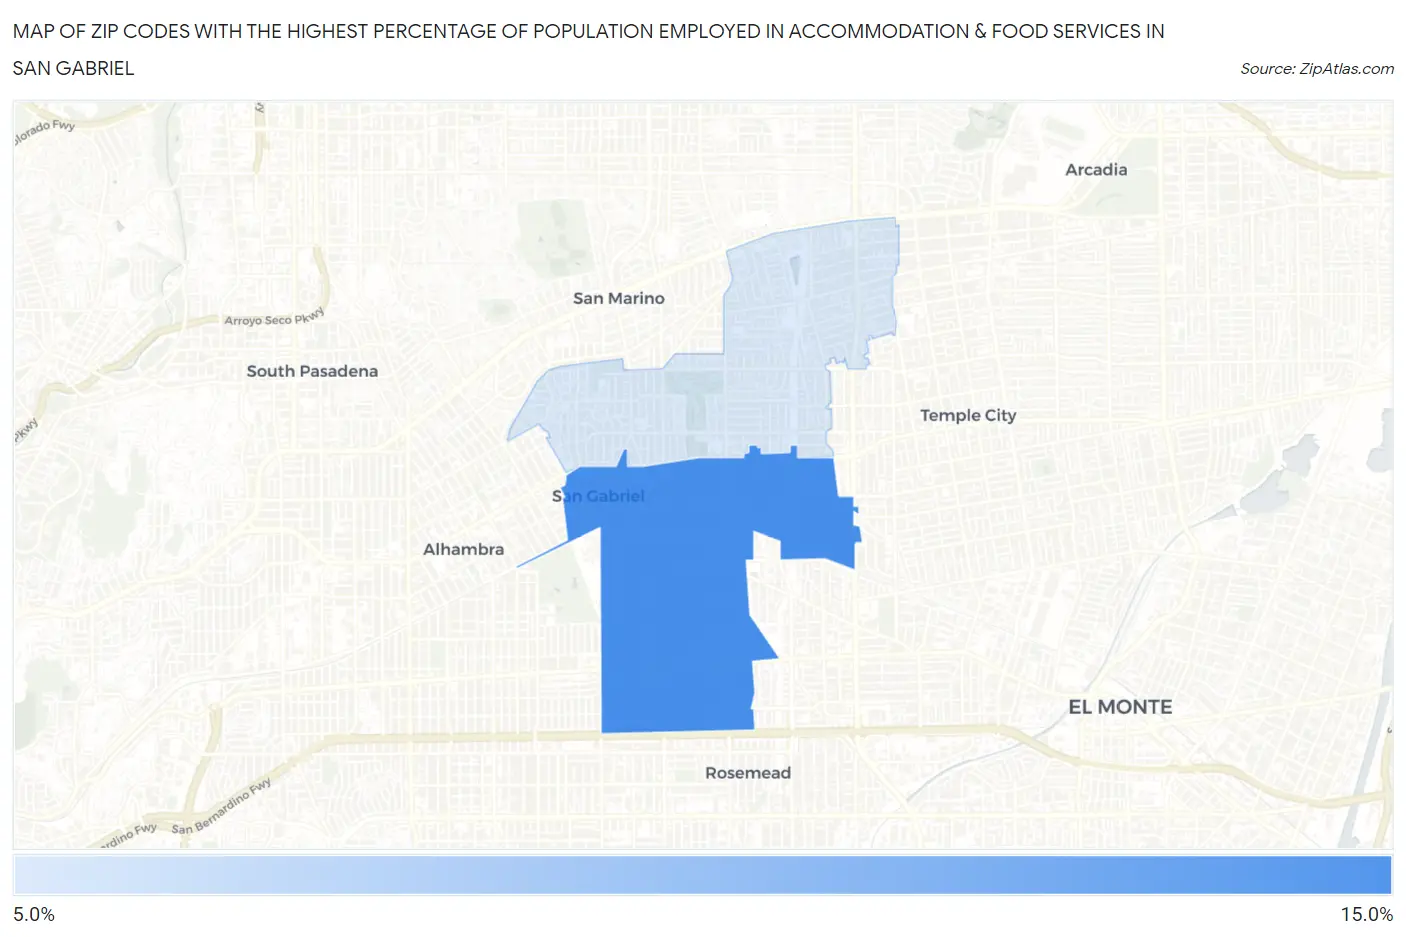
Map of Zip Codes with the Highest Percentage of Population Employed in Accommodation & Food Services in San Gabriel
6.9%
10.7%
Zip Codes with the Highest Percentage of Population Employed in Accommodation & Food Services in San Gabriel, CA
| Zip Code | % Employed | vs State | vs National | |
| 1. | 91776 | 10.7% | 7.2%(+3.55)#241 | 6.9%(+3.84)#3,783 |
| 2. | 91775 | 6.9% | 7.2%(-0.257)#738 | 6.9%(+0.033)#10,564 |
1
Common Questions
What are the Top Zip Codes with the Highest Percentage of Population Employed in Accommodation & Food Services in San Gabriel, CA?
Top Zip Codes with the Highest Percentage of Population Employed in Accommodation & Food Services in San Gabriel, CA are:
What zip code has the Highest Percentage of Population Employed in Accommodation & Food Services in San Gabriel, CA?
91776 has the Highest Percentage of Population Employed in Accommodation & Food Services in San Gabriel, CA with 10.7%.
What is the Percentage of Population Employed in Accommodation & Food Services in San Gabriel, CA?
Percentage of Population Employed in Accommodation & Food Services in San Gabriel is 7.9%.
What is the Percentage of Population Employed in Accommodation & Food Services in California?
Percentage of Population Employed in Accommodation & Food Services in California is 7.2%.
What is the Percentage of Population Employed in Accommodation & Food Services in the United States?
Percentage of Population Employed in Accommodation & Food Services in the United States is 6.9%.