Zip Codes with the Highest Percentage of Population Employed in Accommodation & Food Services in Garden Grove, CA
RELATED REPORTS & OPTIONS
Accommodation & Food Services
Garden Grove
Compare Zip Codes
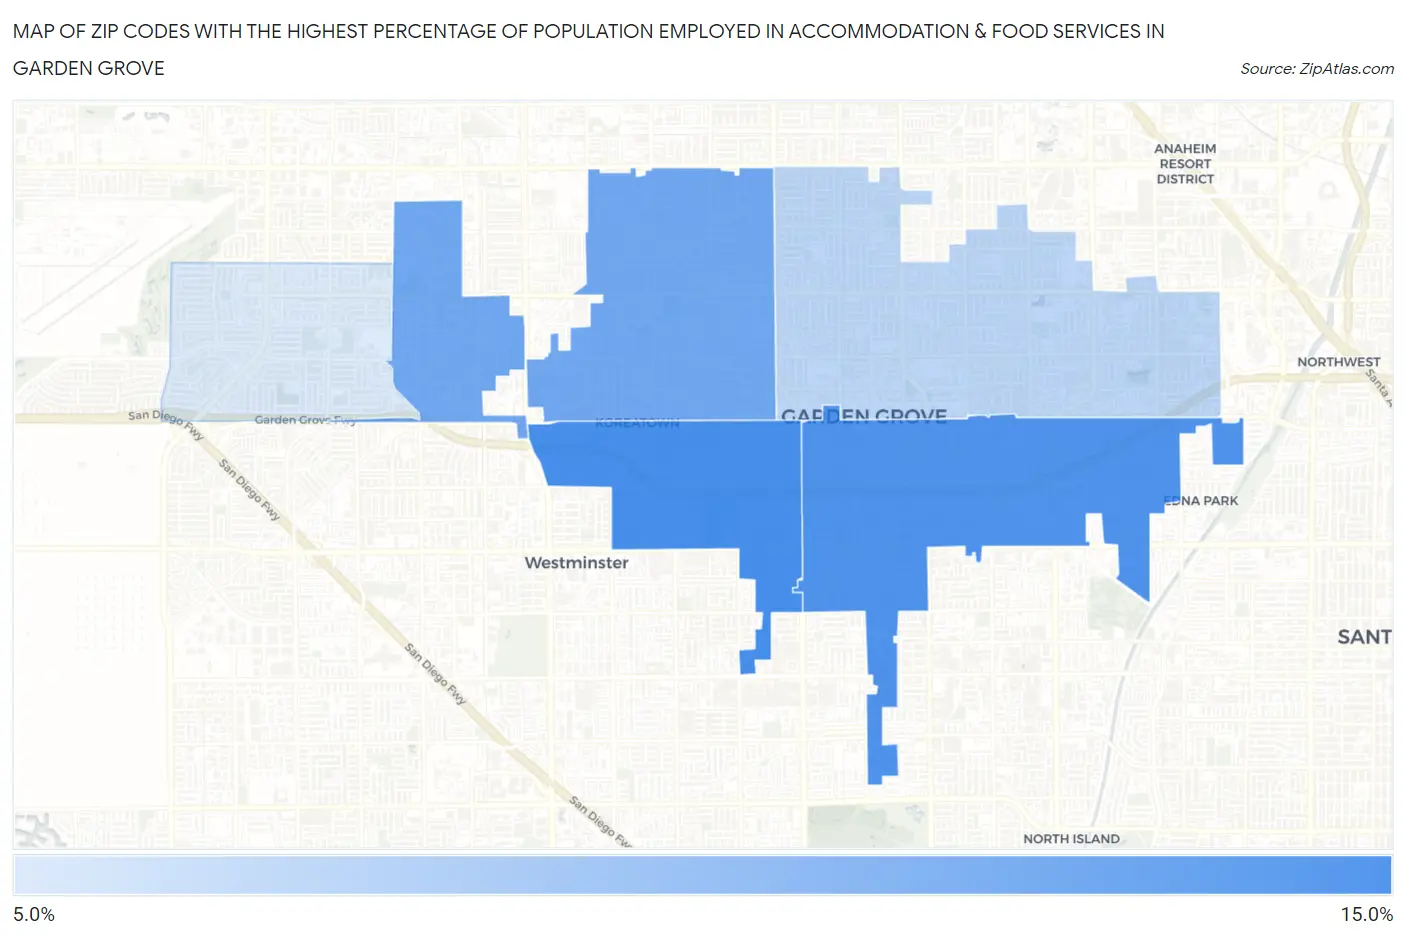
Map of Zip Codes with the Highest Percentage of Population Employed in Accommodation & Food Services in Garden Grove
7.9%
10.6%
Zip Codes with the Highest Percentage of Population Employed in Accommodation & Food Services in Garden Grove, CA
| Zip Code | % Employed | vs State | vs National | |
| 1. | 92844 | 10.6% | 7.2%(+3.45)#249 | 6.9%(+3.74)#3,864 |
| 2. | 92843 | 10.5% | 7.2%(+3.31)#259 | 6.9%(+3.60)#4,010 |
| 3. | 92841 | 9.9% | 7.2%(+2.71)#307 | 6.9%(+3.00)#4,691 |
| 4. | 92840 | 8.5% | 7.2%(+1.32)#451 | 6.9%(+1.61)#6,831 |
| 5. | 92845 | 7.9% | 7.2%(+0.759)#536 | 6.9%(+1.05)#7,969 |
1
Common Questions
What are the Top 3 Zip Codes with the Highest Percentage of Population Employed in Accommodation & Food Services in Garden Grove, CA?
Top 3 Zip Codes with the Highest Percentage of Population Employed in Accommodation & Food Services in Garden Grove, CA are:
What zip code has the Highest Percentage of Population Employed in Accommodation & Food Services in Garden Grove, CA?
92844 has the Highest Percentage of Population Employed in Accommodation & Food Services in Garden Grove, CA with 10.6%.
What is the Percentage of Population Employed in Accommodation & Food Services in Garden Grove, CA?
Percentage of Population Employed in Accommodation & Food Services in Garden Grove is 9.5%.
What is the Percentage of Population Employed in Accommodation & Food Services in California?
Percentage of Population Employed in Accommodation & Food Services in California is 7.2%.
What is the Percentage of Population Employed in Accommodation & Food Services in the United States?
Percentage of Population Employed in Accommodation & Food Services in the United States is 6.9%.