Zip Codes with the Highest Percentage of Population with a Degree in Liberal Arts and History in Compton, CA
RELATED REPORTS & OPTIONS
Liberal Arts and History
Compton
Compare Zip Codes
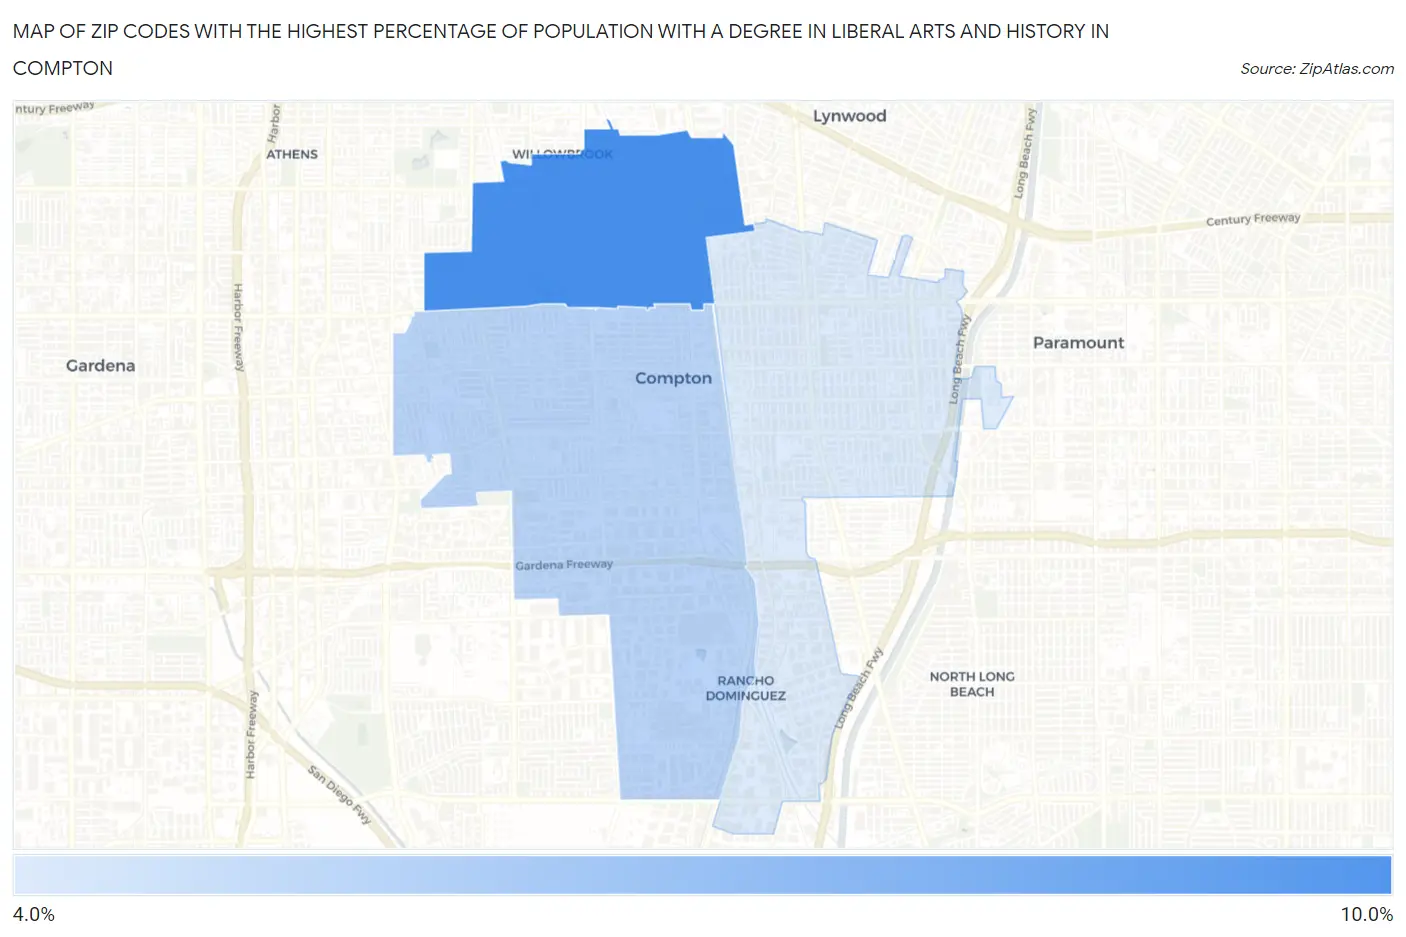
Map of Zip Codes with the Highest Percentage of Population with a Degree in Liberal Arts and History in Compton
4.4%
8.5%
Zip Codes with the Highest Percentage of Population with a Degree in Liberal Arts and History in Compton, CA
| Zip Code | % Graduates | vs State | vs National | |
| 1. | 90222 | 8.5% | 5.5%(+3.04)#325 | 4.9%(+3.66)#4,303 |
| 2. | 90220 | 5.4% | 5.5%(-0.067)#880 | 4.9%(+0.557)#10,063 |
| 3. | 90221 | 4.4% | 5.5%(-1.07)#1,098 | 4.9%(-0.444)#13,195 |
1
Common Questions
What are the Top Zip Codes with the Highest Percentage of Population with a Degree in Liberal Arts and History in Compton, CA?
Top Zip Codes with the Highest Percentage of Population with a Degree in Liberal Arts and History in Compton, CA are:
What zip code has the Highest Percentage of Population with a Degree in Liberal Arts and History in Compton, CA?
90222 has the Highest Percentage of Population with a Degree in Liberal Arts and History in Compton, CA with 8.5%.
What is the Percentage of Population with a Degree in Liberal Arts and History in Compton, CA?
Percentage of Population with a Degree in Liberal Arts and History in Compton is 6.3%.
What is the Percentage of Population with a Degree in Liberal Arts and History in California?
Percentage of Population with a Degree in Liberal Arts and History in California is 5.5%.
What is the Percentage of Population with a Degree in Liberal Arts and History in the United States?
Percentage of Population with a Degree in Liberal Arts and History in the United States is 4.9%.