Zip Codes with the Highest Percentage of Population Employed in Legal Services & Support in Compton, CA
RELATED REPORTS & OPTIONS
Legal Services & Support
Compton
Compare Zip Codes
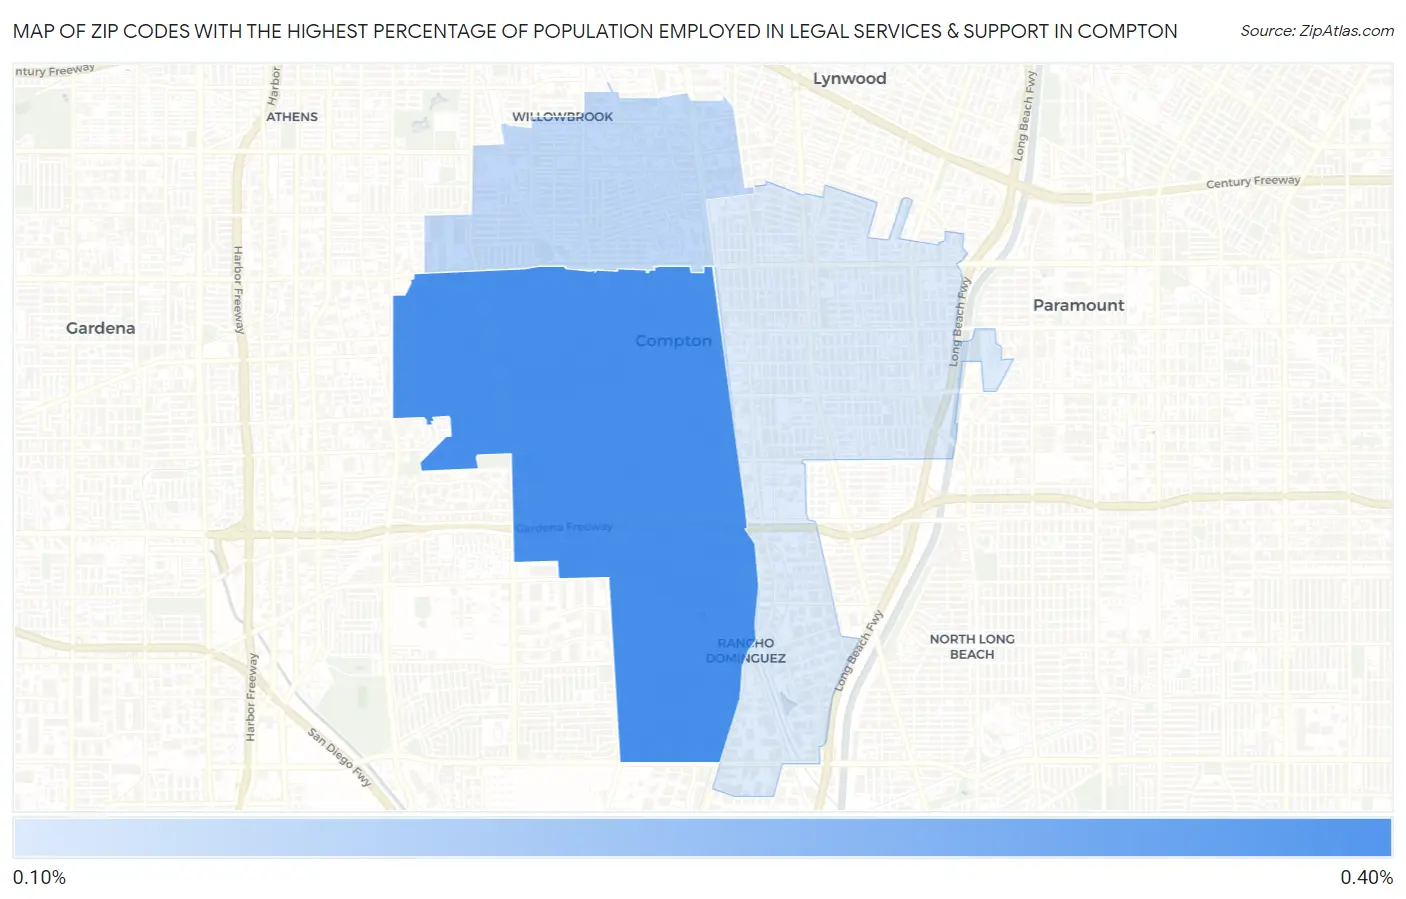
Map of Zip Codes with the Highest Percentage of Population Employed in Legal Services & Support in Compton
0.18%
0.37%
Zip Codes with the Highest Percentage of Population Employed in Legal Services & Support in Compton, CA
| Zip Code | % Employed | vs State | vs National | |
| 1. | 90220 | 0.37% | 1.3%(-0.887)#1,031 | 1.2%(-0.812)#14,181 |
| 2. | 90222 | 0.22% | 1.3%(-1.04)#1,105 | 1.2%(-0.961)#15,963 |
| 3. | 90221 | 0.18% | 1.3%(-1.07)#1,125 | 1.2%(-0.999)#16,357 |
1
Common Questions
What are the Top Zip Codes with the Highest Percentage of Population Employed in Legal Services & Support in Compton, CA?
Top Zip Codes with the Highest Percentage of Population Employed in Legal Services & Support in Compton, CA are:
What zip code has the Highest Percentage of Population Employed in Legal Services & Support in Compton, CA?
90220 has the Highest Percentage of Population Employed in Legal Services & Support in Compton, CA with 0.37%.
What is the Percentage of Population Employed in Legal Services & Support in Compton, CA?
Percentage of Population Employed in Legal Services & Support in Compton is 0.32%.
What is the Percentage of Population Employed in Legal Services & Support in California?
Percentage of Population Employed in Legal Services & Support in California is 1.3%.
What is the Percentage of Population Employed in Legal Services & Support in the United States?
Percentage of Population Employed in Legal Services & Support in the United States is 1.2%.