Zip Codes with the Highest Percentage of Population with a Degree in Visual and Performing Arts in Compton, CA
RELATED REPORTS & OPTIONS
Visual and Performing Arts
Compton
Compare Zip Codes
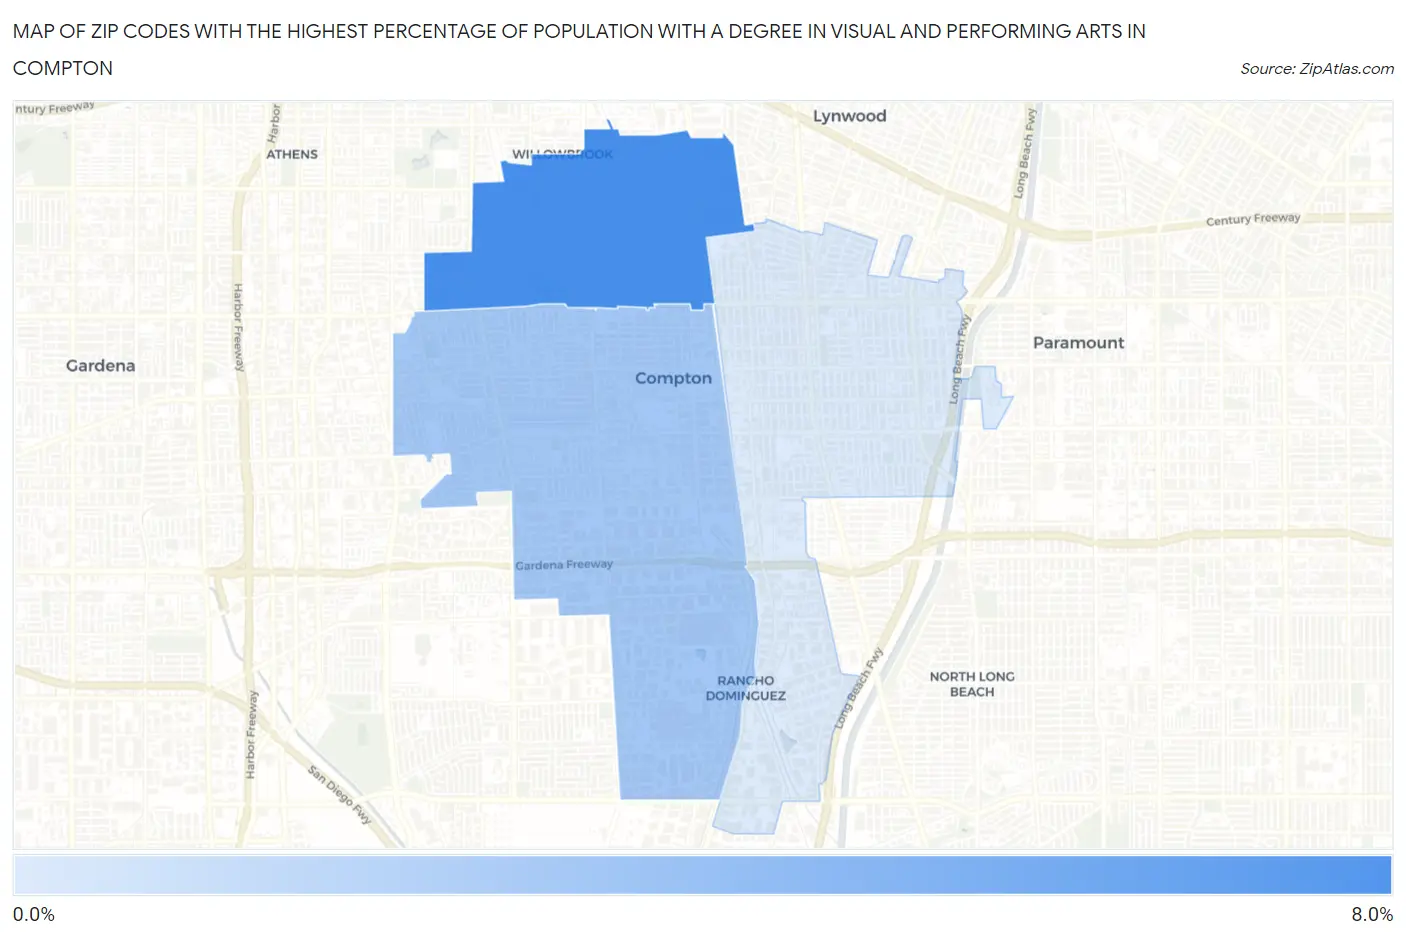
Map of Zip Codes with the Highest Percentage of Population with a Degree in Visual and Performing Arts in Compton
1.6%
6.2%
Zip Codes with the Highest Percentage of Population with a Degree in Visual and Performing Arts in Compton, CA
| Zip Code | % Graduates | vs State | vs National | |
| 1. | 90222 | 6.2% | 5.7%(+0.447)#492 | 4.3%(+1.93)#4,618 |
| 2. | 90220 | 3.3% | 5.7%(-2.46)#1,039 | 4.3%(-0.970)#11,686 |
| 3. | 90221 | 1.6% | 5.7%(-4.19)#1,327 | 4.3%(-2.70)#17,993 |
1
Common Questions
What are the Top Zip Codes with the Highest Percentage of Population with a Degree in Visual and Performing Arts in Compton, CA?
Top Zip Codes with the Highest Percentage of Population with a Degree in Visual and Performing Arts in Compton, CA are:
What zip code has the Highest Percentage of Population with a Degree in Visual and Performing Arts in Compton, CA?
90222 has the Highest Percentage of Population with a Degree in Visual and Performing Arts in Compton, CA with 6.2%.
What is the Percentage of Population with a Degree in Visual and Performing Arts in Compton, CA?
Percentage of Population with a Degree in Visual and Performing Arts in Compton is 2.8%.
What is the Percentage of Population with a Degree in Visual and Performing Arts in California?
Percentage of Population with a Degree in Visual and Performing Arts in California is 5.7%.
What is the Percentage of Population with a Degree in Visual and Performing Arts in the United States?
Percentage of Population with a Degree in Visual and Performing Arts in the United States is 4.3%.