Zip Codes with the Highest Percentage of Population Employed in Health Care & Social Assistance in Chino, CA
RELATED REPORTS & OPTIONS
Health Care & Social Assistance
Chino
Compare Zip Codes
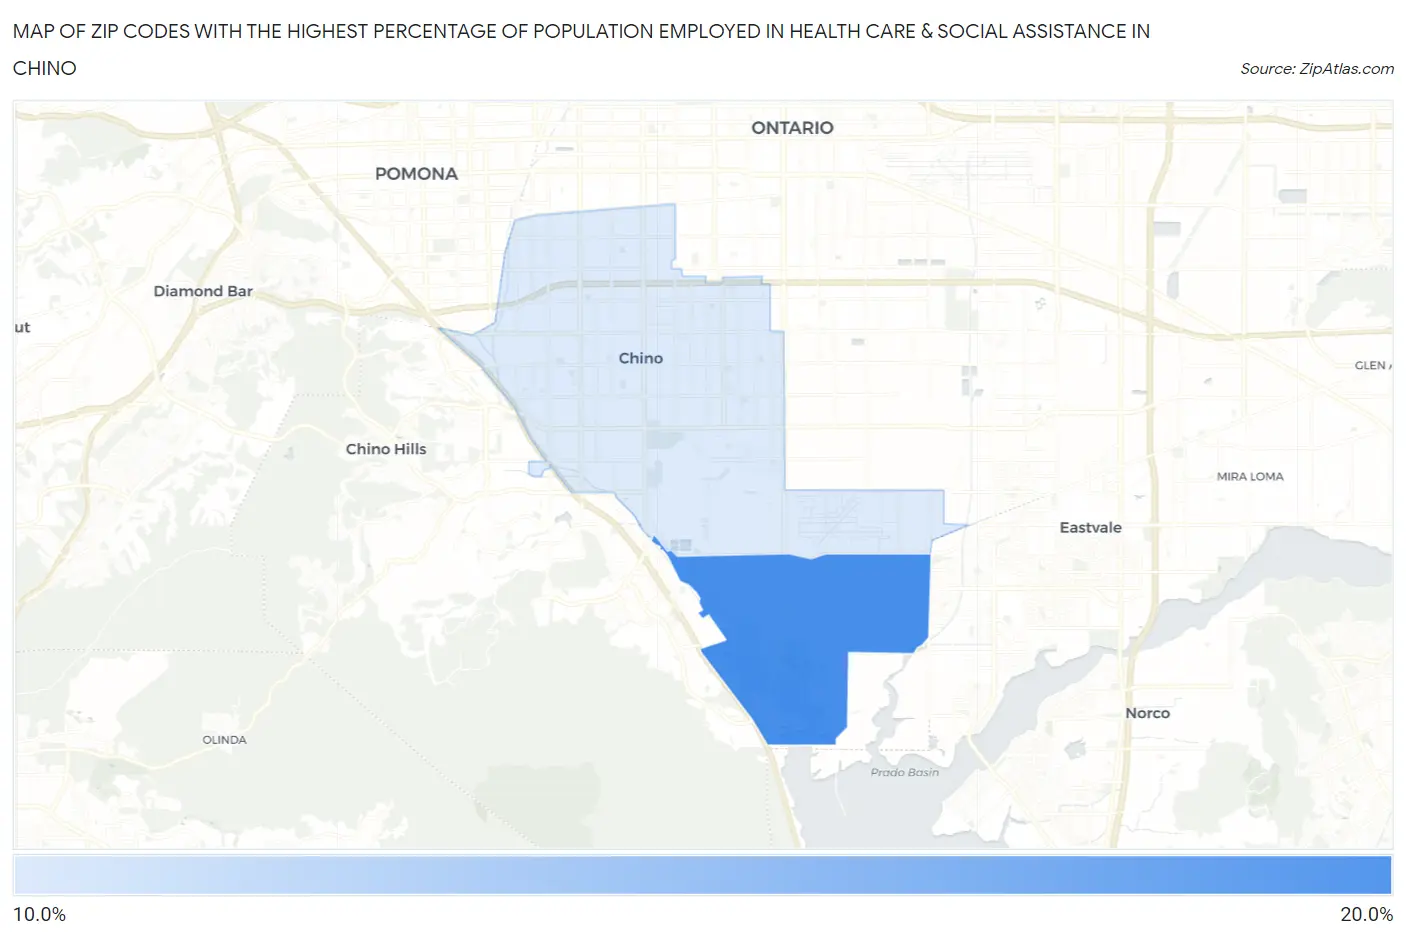
Map of Zip Codes with the Highest Percentage of Population Employed in Health Care & Social Assistance in Chino
11.8%
15.7%
Zip Codes with the Highest Percentage of Population Employed in Health Care & Social Assistance in Chino, CA
| Zip Code | % Employed | vs State | vs National | |
| 1. | 91708 | 15.7% | 12.7%(+2.98)#305 | 13.9%(+1.78)#10,093 |
| 2. | 91710 | 11.8% | 12.7%(-0.970)#895 | 13.9%(-2.17)#19,544 |
1
Common Questions
What are the Top Zip Codes with the Highest Percentage of Population Employed in Health Care & Social Assistance in Chino, CA?
Top Zip Codes with the Highest Percentage of Population Employed in Health Care & Social Assistance in Chino, CA are:
What zip code has the Highest Percentage of Population Employed in Health Care & Social Assistance in Chino, CA?
91708 has the Highest Percentage of Population Employed in Health Care & Social Assistance in Chino, CA with 15.7%.
What is the Percentage of Population Employed in Health Care & Social Assistance in Chino, CA?
Percentage of Population Employed in Health Care & Social Assistance in Chino is 12.6%.
What is the Percentage of Population Employed in Health Care & Social Assistance in California?
Percentage of Population Employed in Health Care & Social Assistance in California is 12.7%.
What is the Percentage of Population Employed in Health Care & Social Assistance in the United States?
Percentage of Population Employed in Health Care & Social Assistance in the United States is 13.9%.