Zip Codes with the Highest Percentage of Population Employed in Real Estate, Rental & Leasing in Chino, CA
RELATED REPORTS & OPTIONS
Real Estate, Rental & Leasing
Chino
Compare Zip Codes
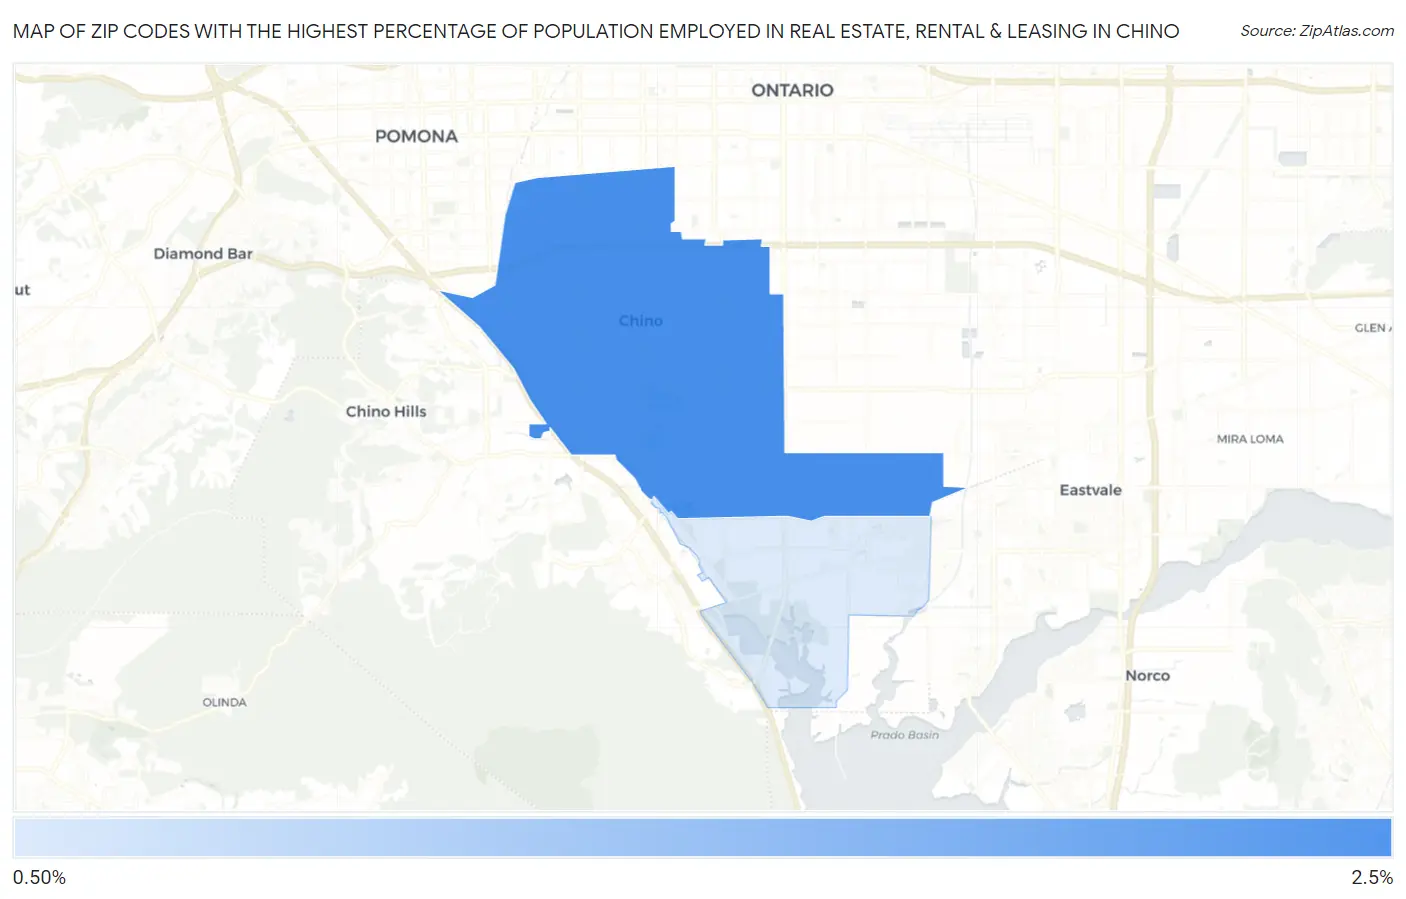
Map of Zip Codes with the Highest Percentage of Population Employed in Real Estate, Rental & Leasing in Chino
1.3%
2.0%
Zip Codes with the Highest Percentage of Population Employed in Real Estate, Rental & Leasing in Chino, CA
| Zip Code | % Employed | vs State | vs National | |
| 1. | 91710 | 2.0% | 2.1%(-0.101)#695 | 1.9%(+0.126)#7,749 |
| 2. | 91708 | 1.3% | 2.1%(-0.804)#1,033 | 1.9%(-0.576)#12,618 |
1
Common Questions
What are the Top Zip Codes with the Highest Percentage of Population Employed in Real Estate, Rental & Leasing in Chino, CA?
Top Zip Codes with the Highest Percentage of Population Employed in Real Estate, Rental & Leasing in Chino, CA are:
What zip code has the Highest Percentage of Population Employed in Real Estate, Rental & Leasing in Chino, CA?
91710 has the Highest Percentage of Population Employed in Real Estate, Rental & Leasing in Chino, CA with 2.0%.
What is the Percentage of Population Employed in Real Estate, Rental & Leasing in Chino, CA?
Percentage of Population Employed in Real Estate, Rental & Leasing in Chino is 1.8%.
What is the Percentage of Population Employed in Real Estate, Rental & Leasing in California?
Percentage of Population Employed in Real Estate, Rental & Leasing in California is 2.1%.
What is the Percentage of Population Employed in Real Estate, Rental & Leasing in the United States?
Percentage of Population Employed in Real Estate, Rental & Leasing in the United States is 1.9%.