Zip Codes with the Highest Percentage of Population Employed in Agriculture, Fishing & Hunting in Spearfish, SD
RELATED REPORTS & OPTIONS
Select to Compare
Select to Compare
Compare Zip Codes
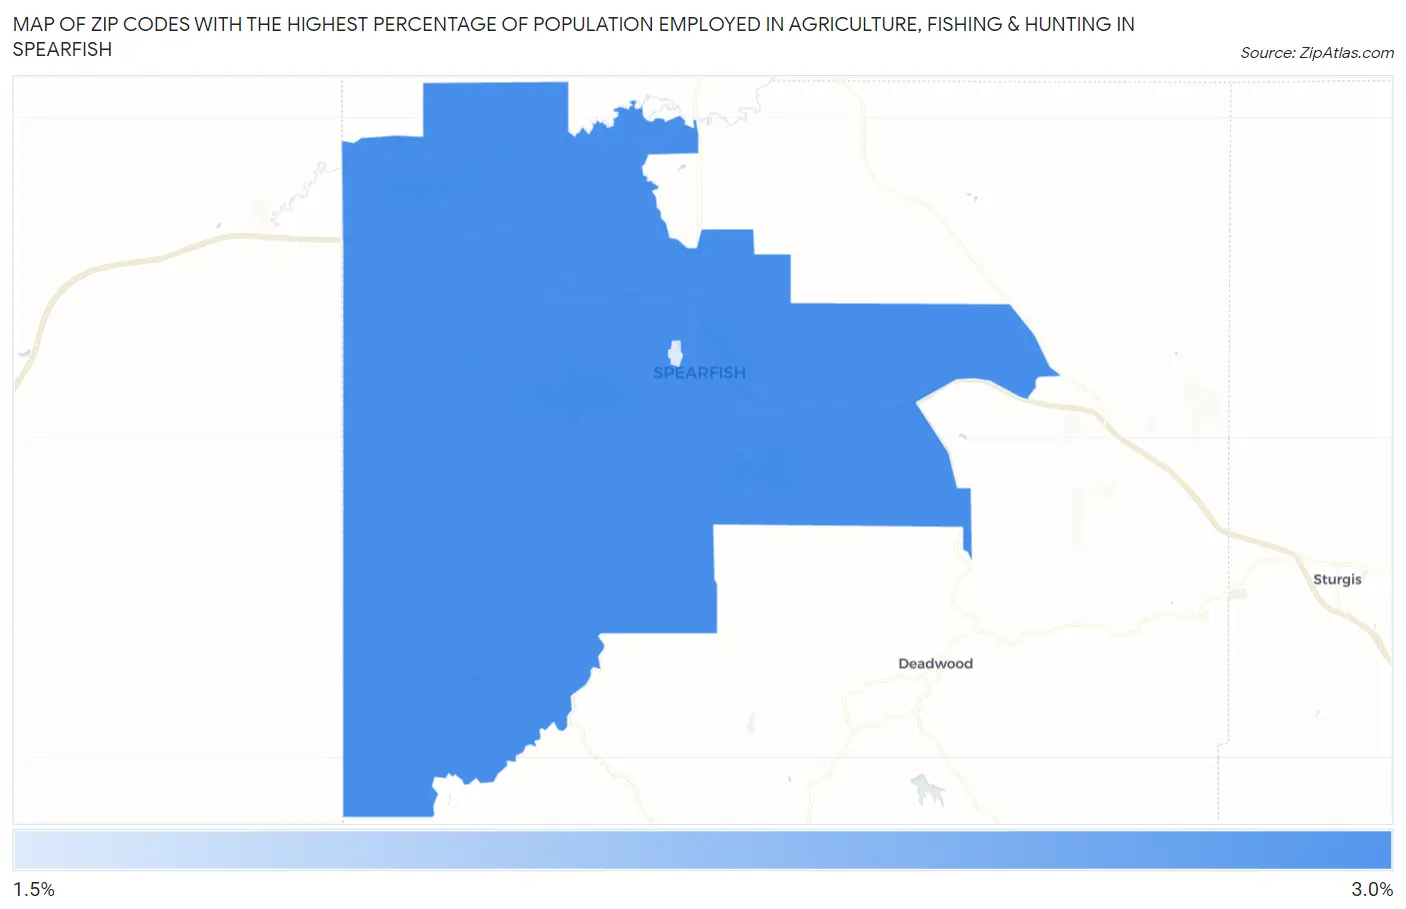
Map of Zip Codes with the Highest Percentage of Population Employed in Agriculture, Fishing & Hunting in Spearfish
0.0%
3.0%
Zip Codes with the Highest Percentage of Population Employed in Agriculture, Fishing & Hunting in Spearfish, SD
| Zip Code | % Employed | vs State | vs National | |
| 1. | 57783 | 2.9% | 5.9%(-2.95)#311 | 1.2%(+1.74)#10,677 |
1
Common Questions
What are the Top Zip Codes with the Highest Percentage of Population Employed in Agriculture, Fishing & Hunting in Spearfish, SD?
Top Zip Codes with the Highest Percentage of Population Employed in Agriculture, Fishing & Hunting in Spearfish, SD are:
What zip code has the Highest Percentage of Population Employed in Agriculture, Fishing & Hunting in Spearfish, SD?
57783 has the Highest Percentage of Population Employed in Agriculture, Fishing & Hunting in Spearfish, SD with 2.9%.
What is the Percentage of Population Employed in Agriculture, Fishing & Hunting in Spearfish, SD?
Percentage of Population Employed in Agriculture, Fishing & Hunting in Spearfish is 3.2%.
What is the Percentage of Population Employed in Agriculture, Fishing & Hunting in South Dakota?
Percentage of Population Employed in Agriculture, Fishing & Hunting in South Dakota is 5.9%.
What is the Percentage of Population Employed in Agriculture, Fishing & Hunting in the United States?
Percentage of Population Employed in Agriculture, Fishing & Hunting in the United States is 1.2%.