Zip Codes with the Highest Percentage of Population Driving Alone to Work in Spearfish, SD
RELATED REPORTS & OPTIONS
Drive | Alone
Spearfish
Compare Zip Codes
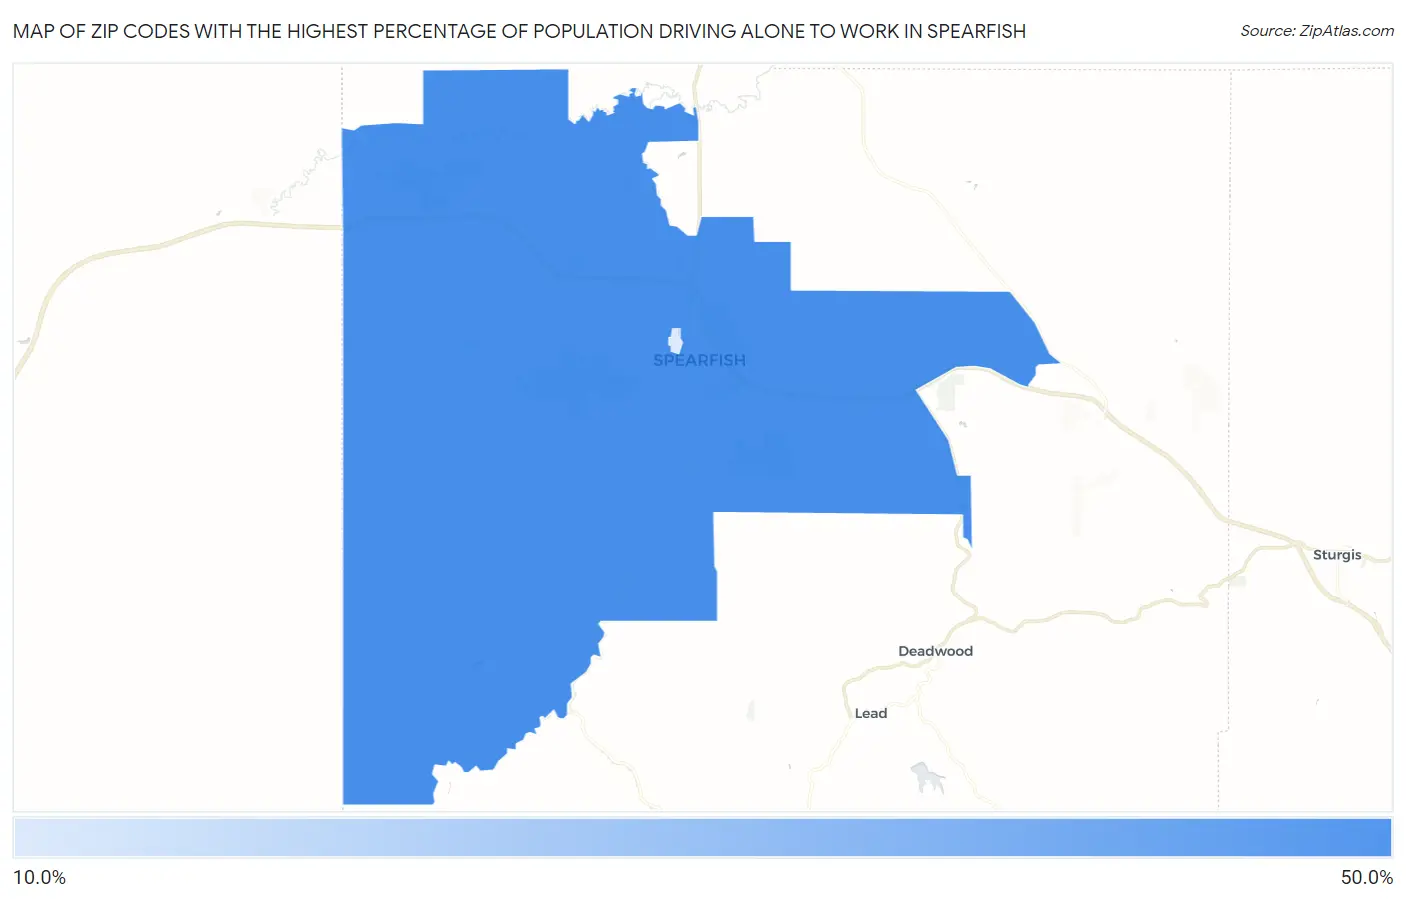
Map of Zip Codes with the Highest Percentage of Population Driving Alone to Work in Spearfish
19.4%
40.6%
Zip Codes with the Highest Percentage of Population Driving Alone to Work in Spearfish, SD
| Zip Code | % Drive Alone | vs State | vs National | |
| 1. | 57783 | 40.6% | 41.6%(-1.00)#273 | 42.1%(-1.50)#23,820 |
| 2. | 57799 | 19.4% | 41.6%(-22.2)#351 | 42.1%(-22.7)#31,512 |
1
Common Questions
What are the Top Zip Codes with the Highest Percentage of Population Driving Alone to Work in Spearfish, SD?
Top Zip Codes with the Highest Percentage of Population Driving Alone to Work in Spearfish, SD are:
What zip code has the Highest Percentage of Population Driving Alone to Work in Spearfish, SD?
57783 has the Highest Percentage of Population Driving Alone to Work in Spearfish, SD with 40.6%.
What is the Percentage of Population Driving Alone to Work in Spearfish, SD?
Percentage of Population Driving Alone to Work in Spearfish is 37.3%.
What is the Percentage of Population Driving Alone to Work in South Dakota?
Percentage of Population Driving Alone to Work in South Dakota is 41.6%.
What is the Percentage of Population Driving Alone to Work in the United States?
Percentage of Population Driving Alone to Work in the United States is 42.1%.