Zip Codes with the Highest Percentage of Population Employed in Health Diagnosing & Treating in Sun Valley, ID
RELATED REPORTS & OPTIONS
Select to Compare
Sun Valley
Compare Zip Codes
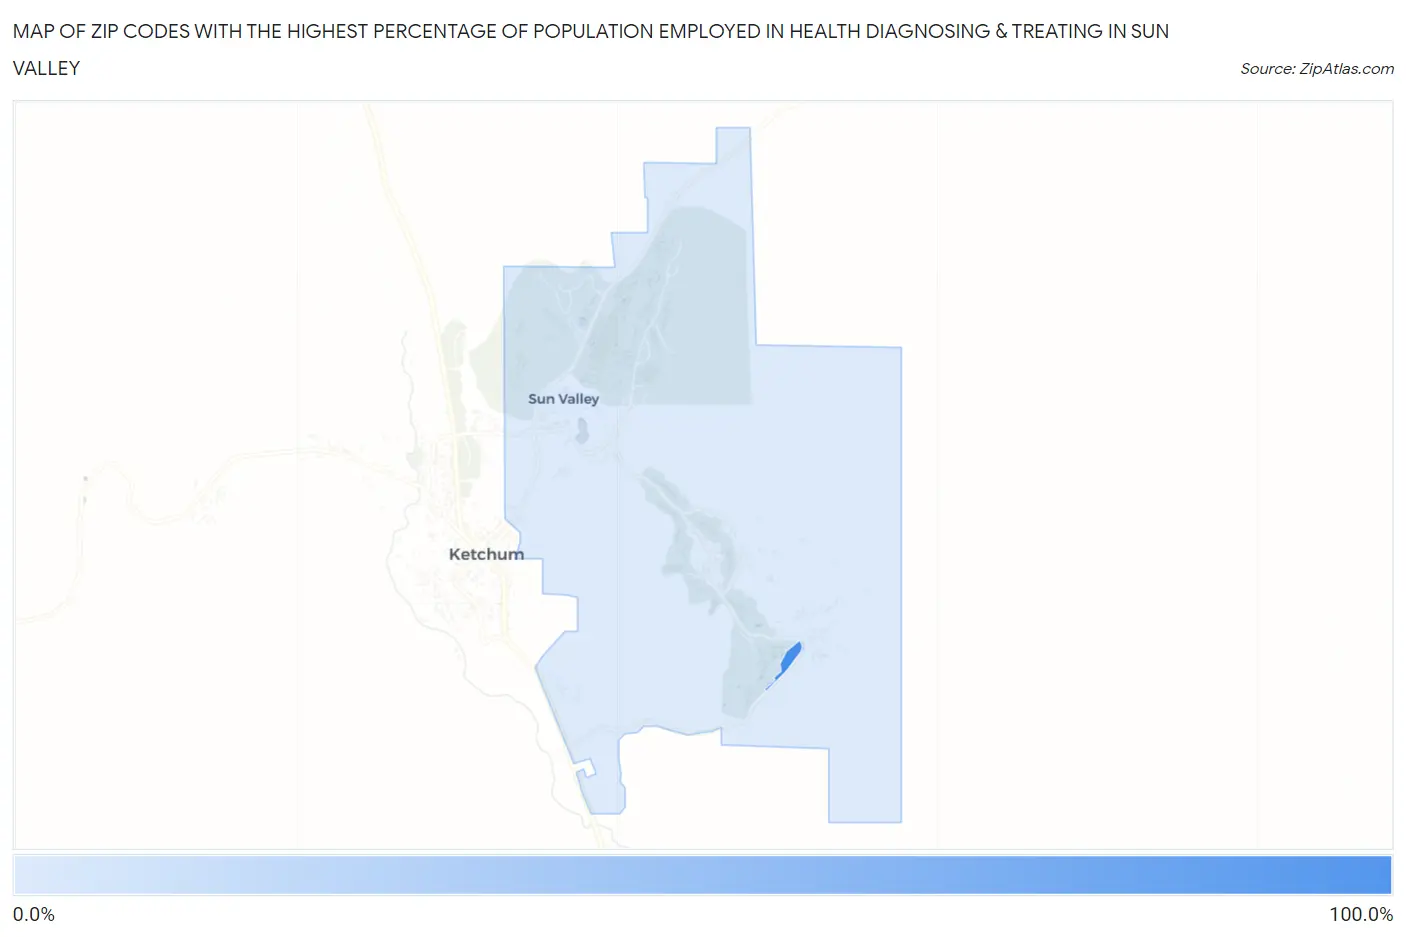
Map of Zip Codes with the Highest Percentage of Population Employed in Health Diagnosing & Treating in Sun Valley
2.1%
100.0%
Zip Codes with the Highest Percentage of Population Employed in Health Diagnosing & Treating in Sun Valley, ID
| Zip Code | % Employed | vs State | vs National | |
| 1. | 83354 | 100.0% | 5.6%(+94.4)#1 | 6.2%(+93.8)#20 |
| 2. | 83353 | 2.1% | 5.6%(-3.51)#172 | 6.2%(-4.15)#26,300 |
1
Common Questions
What are the Top Zip Codes with the Highest Percentage of Population Employed in Health Diagnosing & Treating in Sun Valley, ID?
Top Zip Codes with the Highest Percentage of Population Employed in Health Diagnosing & Treating in Sun Valley, ID are:
What zip code has the Highest Percentage of Population Employed in Health Diagnosing & Treating in Sun Valley, ID?
83354 has the Highest Percentage of Population Employed in Health Diagnosing & Treating in Sun Valley, ID with 100.0%.
What is the Percentage of Population Employed in Health Diagnosing & Treating in Sun Valley, ID?
Percentage of Population Employed in Health Diagnosing & Treating in Sun Valley is 3.2%.
What is the Percentage of Population Employed in Health Diagnosing & Treating in Idaho?
Percentage of Population Employed in Health Diagnosing & Treating in Idaho is 5.6%.
What is the Percentage of Population Employed in Health Diagnosing & Treating in the United States?
Percentage of Population Employed in Health Diagnosing & Treating in the United States is 6.2%.