Makena, HI Map & Demographics
Makena Map
Makena Overview
$152,719
PER CAPITA INCOME
$171,042
AVG FAMILY INCOME
$148,750
AVG HOUSEHOLD INCOME
0.62
INEQUALITY / GINI INDEX
158
TOTAL POPULATION
92
MALE POPULATION
66
FEMALE POPULATION
139.39
MALES / 100 FEMALES
71.74
FEMALES / 100 MALES
65.1
MEDIAN AGE
2.3
AVG FAMILY SIZE
2.1
AVG HOUSEHOLD SIZE
46
LABOR FORCE [ PEOPLE ]
30.7%
PERCENT IN LABOR FORCE
4.3%
UNEMPLOYMENT RATE
Income in Makena
Income Overview in Makena
Per Capita Income in Makena is $152,719, while median incomes of families and households are $171,042 and $148,750 respectively.
| Characteristic | Number | Measure |
| Per Capita Income | 158 | $152,719 |
| Median Family Income | 49 | $171,042 |
| Mean Family Income | 49 | $332,561 |
| Median Household Income | 76 | $148,750 |
| Mean Household Income | 76 | $246,570 |
| Income Deficit | 49 | $0 |
| Wage / Income Gap (%) | 158 | 0.00% |
| Wage / Income Gap ($) | 158 | 100.00¢ per $1 |
| Gini / Inequality Index | 158 | 0.62 |
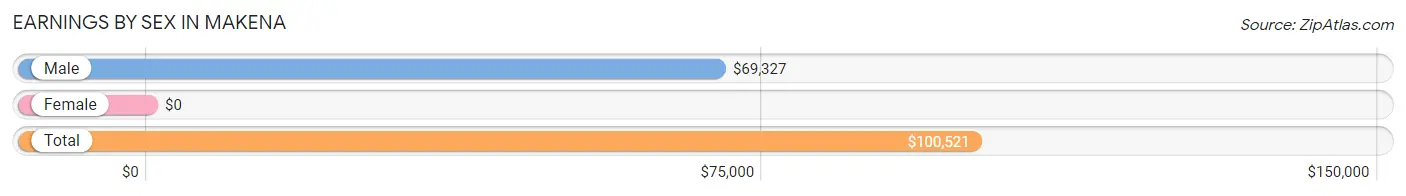
Earnings by Sex in Makena
| Sex | Number | Average Earnings |
| Male | 39 (76.5%) | $69,327 |
| Female | 12 (23.5%) | $0 |
| Total | 51 (100.0%) | $100,521 |
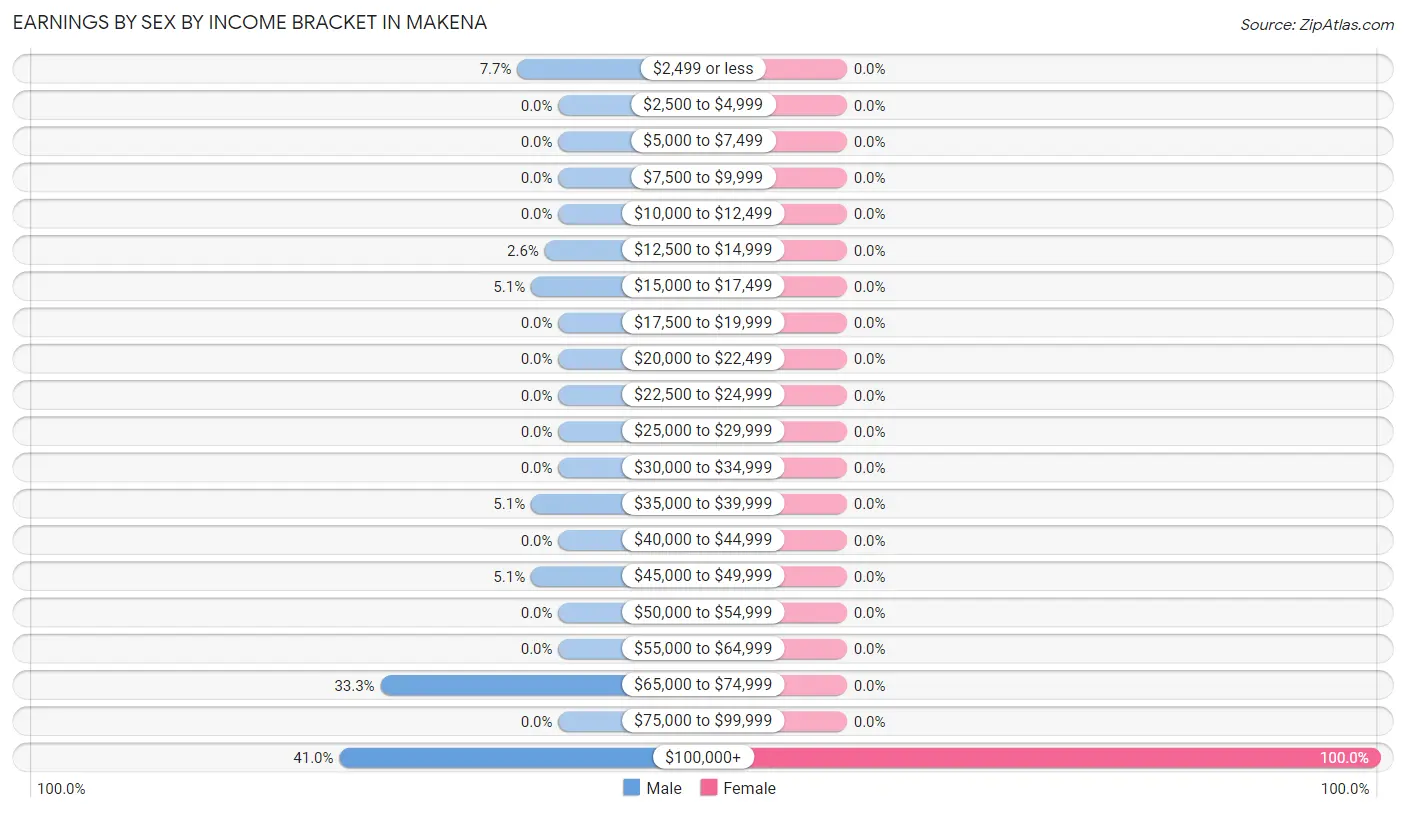
Earnings by Sex by Income Bracket in Makena
The most common earnings brackets in Makena are $100,000+ for men (16 | 41.0%) and $100,000+ for women (12 | 100.0%).
| Income | Male | Female |
| $2,499 or less | 3 (7.7%) | 0 (0.0%) |
| $2,500 to $4,999 | 0 (0.0%) | 0 (0.0%) |
| $5,000 to $7,499 | 0 (0.0%) | 0 (0.0%) |
| $7,500 to $9,999 | 0 (0.0%) | 0 (0.0%) |
| $10,000 to $12,499 | 0 (0.0%) | 0 (0.0%) |
| $12,500 to $14,999 | 1 (2.6%) | 0 (0.0%) |
| $15,000 to $17,499 | 2 (5.1%) | 0 (0.0%) |
| $17,500 to $19,999 | 0 (0.0%) | 0 (0.0%) |
| $20,000 to $22,499 | 0 (0.0%) | 0 (0.0%) |
| $22,500 to $24,999 | 0 (0.0%) | 0 (0.0%) |
| $25,000 to $29,999 | 0 (0.0%) | 0 (0.0%) |
| $30,000 to $34,999 | 0 (0.0%) | 0 (0.0%) |
| $35,000 to $39,999 | 2 (5.1%) | 0 (0.0%) |
| $40,000 to $44,999 | 0 (0.0%) | 0 (0.0%) |
| $45,000 to $49,999 | 2 (5.1%) | 0 (0.0%) |
| $50,000 to $54,999 | 0 (0.0%) | 0 (0.0%) |
| $55,000 to $64,999 | 0 (0.0%) | 0 (0.0%) |
| $65,000 to $74,999 | 13 (33.3%) | 0 (0.0%) |
| $75,000 to $99,999 | 0 (0.0%) | 0 (0.0%) |
| $100,000+ | 16 (41.0%) | 12 (100.0%) |
| Total | 39 (100.0%) | 12 (100.0%) |
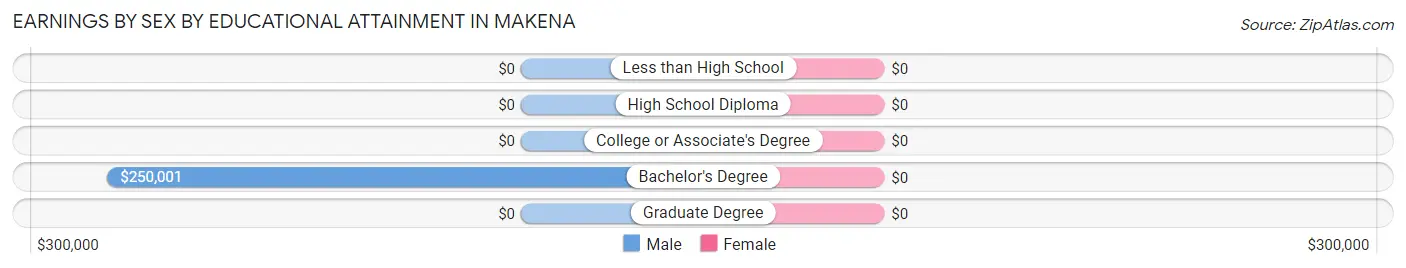
Earnings by Sex by Educational Attainment in Makena
| Educational Attainment | Male Income | Female Income |
| Less than High School | - | - |
| High School Diploma | - | - |
| College or Associate's Degree | - | - |
| Bachelor's Degree | $250,001 | $0 |
| Graduate Degree | - | - |
| Total | $69,327 | $0 |
Family Income in Makena
Family Income Brackets in Makena
According to the Makena family income data, there are 21 families falling into the $200,000+ income range, which is the most common income bracket and makes up 42.9% of all families.
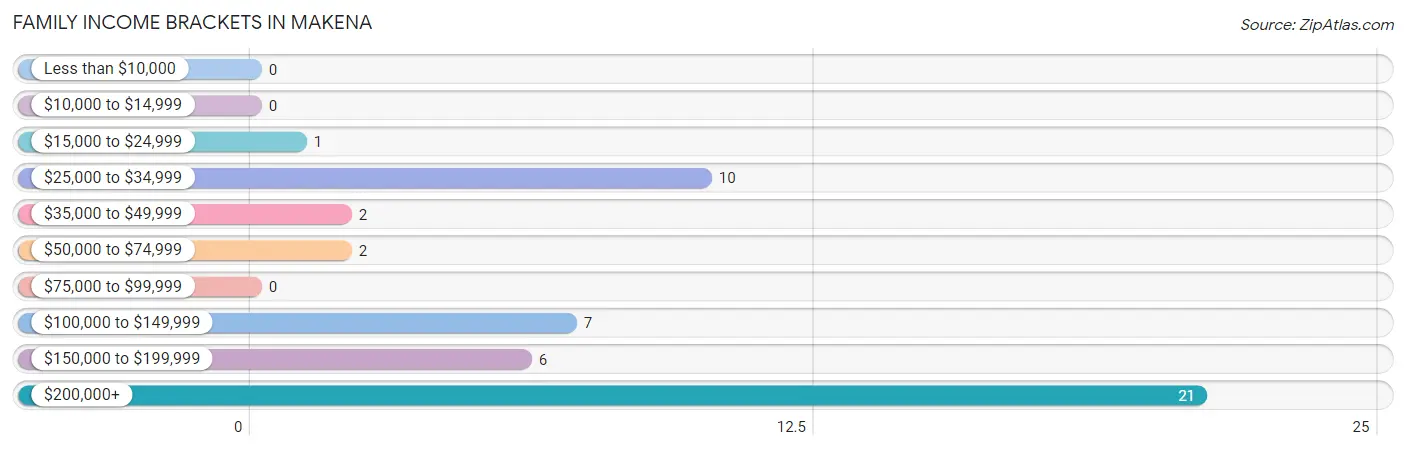
| Income Bracket | # Families | % Families |
| Less than $10,000 | 0 | 0.0% |
| $10,000 to $14,999 | 0 | 0.0% |
| $15,000 to $24,999 | 1 | 2.0% |
| $25,000 to $34,999 | 10 | 20.4% |
| $35,000 to $49,999 | 2 | 4.1% |
| $50,000 to $74,999 | 2 | 4.1% |
| $75,000 to $99,999 | 0 | 0.0% |
| $100,000 to $149,999 | 7 | 14.3% |
| $150,000 to $199,999 | 6 | 12.2% |
| $200,000+ | 21 | 42.9% |
Family Income by Famaliy Size in Makena
2-person families (41 | 83.7%) account for the highest median family income in Makena with $250,001 per family, while 2-person families (41 | 83.7%) have the highest median income of $125,000 per family member.
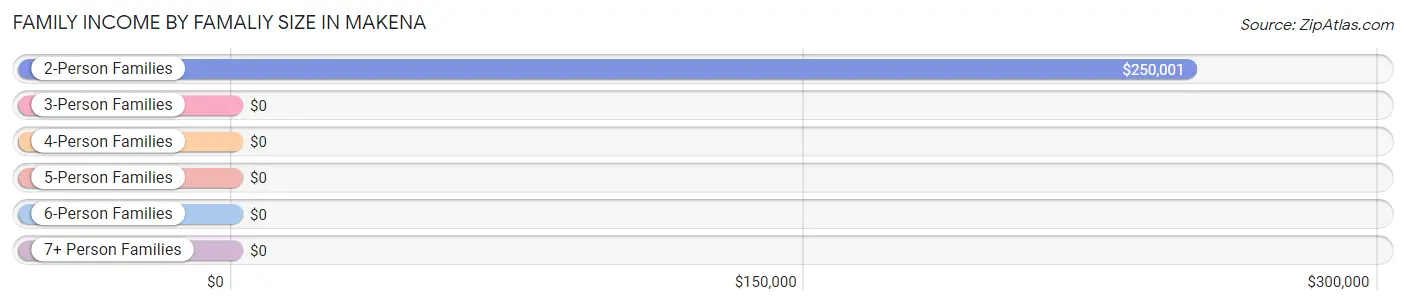
| Income Bracket | # Families | Median Income |
| 2-Person Families | 41 (83.7%) | $250,001 |
| 3-Person Families | 8 (16.3%) | $0 |
| 4-Person Families | 0 (0.0%) | $0 |
| 5-Person Families | 0 (0.0%) | $0 |
| 6-Person Families | 0 (0.0%) | $0 |
| 7+ Person Families | 0 (0.0%) | $0 |
| Total | 49 (100.0%) | $171,042 |
Family Income by Number of Earners in Makena
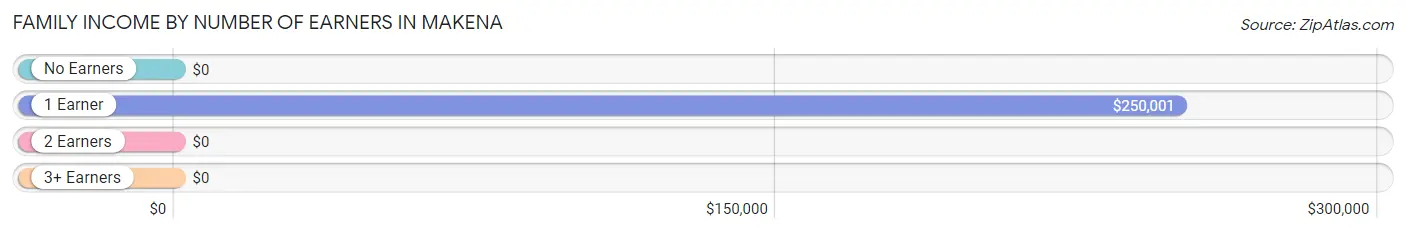
| Number of Earners | # Families | Median Income |
| No Earners | 29 (59.2%) | $0 |
| 1 Earner | 18 (36.7%) | $250,001 |
| 2 Earners | 2 (4.1%) | $0 |
| 3+ Earners | 0 (0.0%) | $0 |
| Total | 49 (100.0%) | $171,042 |
Household Income in Makena
Household Income Brackets in Makena
With 21 households falling in the category, the $200,000+ income range is the most frequent in Makena, accounting for 27.6% of all households.
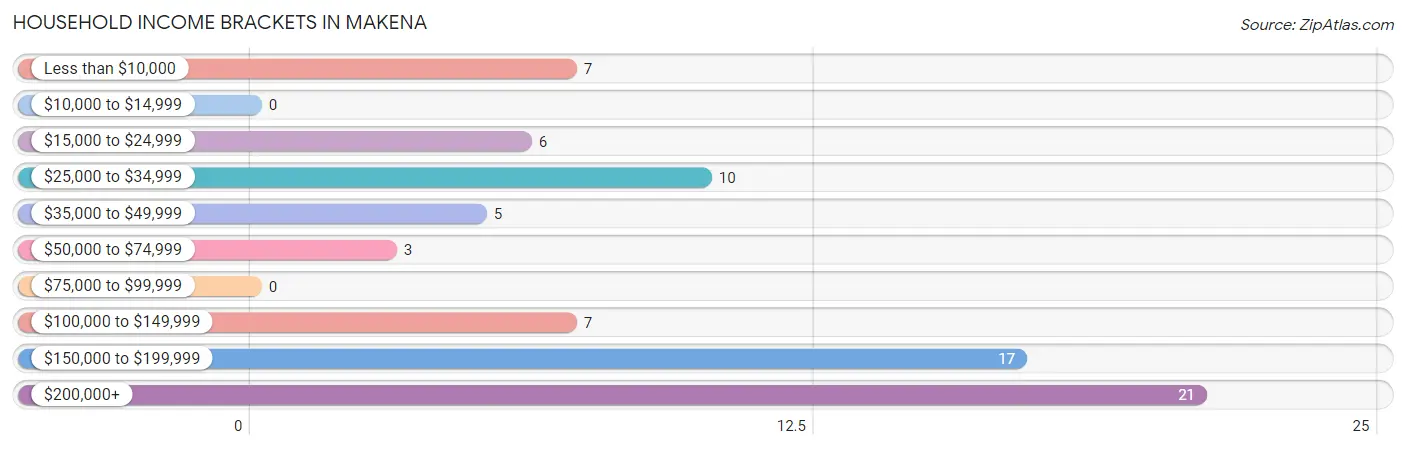
| Income Bracket | # Households | % Households |
| Less than $10,000 | 7 | 9.2% |
| $10,000 to $14,999 | 0 | 0.0% |
| $15,000 to $24,999 | 6 | 7.9% |
| $25,000 to $34,999 | 10 | 13.2% |
| $35,000 to $49,999 | 5 | 6.6% |
| $50,000 to $74,999 | 3 | 3.9% |
| $75,000 to $99,999 | 0 | 0.0% |
| $100,000 to $149,999 | 7 | 9.2% |
| $150,000 to $199,999 | 17 | 22.4% |
| $200,000+ | 21 | 27.6% |
Household Income by Householder Age in Makena
The median household income in Makena is $148,750, with the highest median household income of $250,001 found in the 45 to 64 years age bracket for the primary householder. A total of 23 households (30.3%) fall into this category.
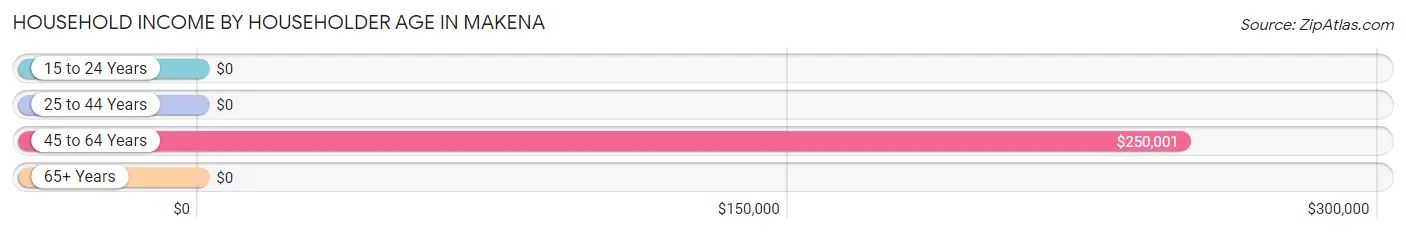
| Income Bracket | # Households | Median Income |
| 15 to 24 Years | 0 (0.0%) | $0 |
| 25 to 44 Years | 2 (2.6%) | $0 |
| 45 to 64 Years | 23 (30.3%) | $250,001 |
| 65+ Years | 51 (67.1%) | $0 |
| Total | 76 (100.0%) | $148,750 |
Poverty in Makena
Income Below Poverty by Sex and Age in Makena
With 13.0% poverty level for males and 6.1% for females among the residents of Makena, 55 to 64 year old males and 45 to 54 year old females are the most vulnerable to poverty, with 5 males (62.5%) and 4 females (100.0%) in their respective age groups living below the poverty level.
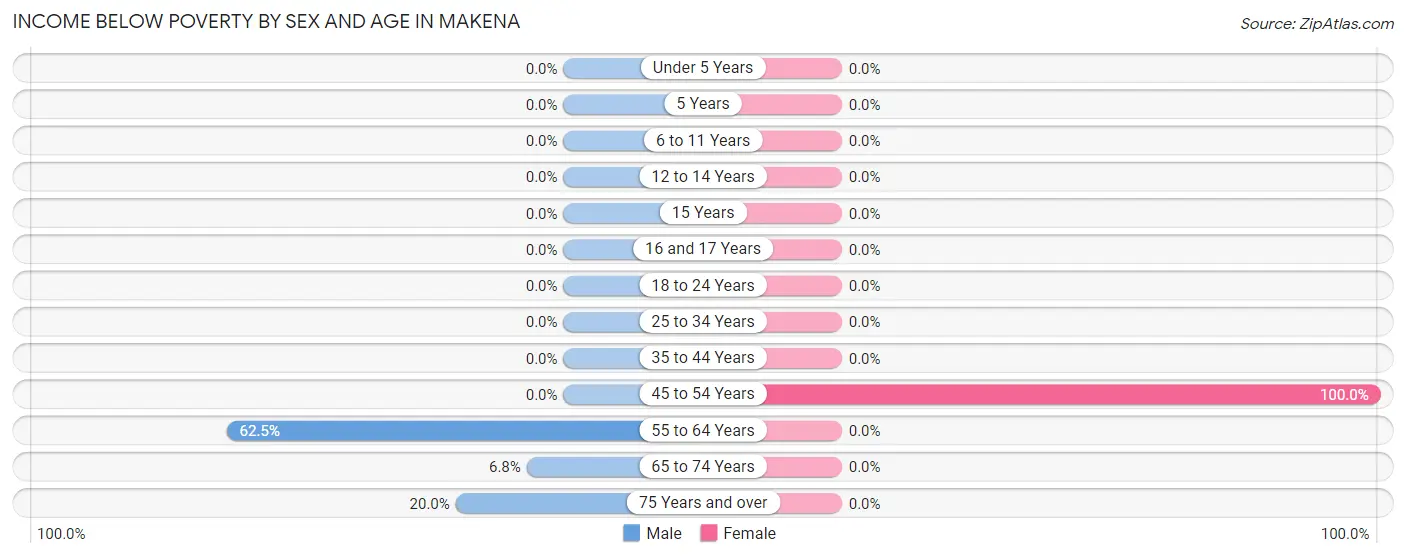
| Age Bracket | Male | Female |
| Under 5 Years | 0 (0.0%) | 0 (0.0%) |
| 5 Years | 0 (0.0%) | 0 (0.0%) |
| 6 to 11 Years | 0 (0.0%) | 0 (0.0%) |
| 12 to 14 Years | 0 (0.0%) | 0 (0.0%) |
| 15 Years | 0 (0.0%) | 0 (0.0%) |
| 16 and 17 Years | 0 (0.0%) | 0 (0.0%) |
| 18 to 24 Years | 0 (0.0%) | 0 (0.0%) |
| 25 to 34 Years | 0 (0.0%) | 0 (0.0%) |
| 35 to 44 Years | 0 (0.0%) | 0 (0.0%) |
| 45 to 54 Years | 0 (0.0%) | 4 (100.0%) |
| 55 to 64 Years | 5 (62.5%) | 0 (0.0%) |
| 65 to 74 Years | 3 (6.8%) | 0 (0.0%) |
| 75 Years and over | 4 (20.0%) | 0 (0.0%) |
| Total | 12 (13.0%) | 4 (6.1%) |
Income Above Poverty by Sex and Age in Makena
According to the poverty statistics in Makena, males aged 25 to 34 years and females aged 12 to 14 years are the age groups that are most secure financially, with 100.0% of males and 100.0% of females in these age groups living above the poverty line.
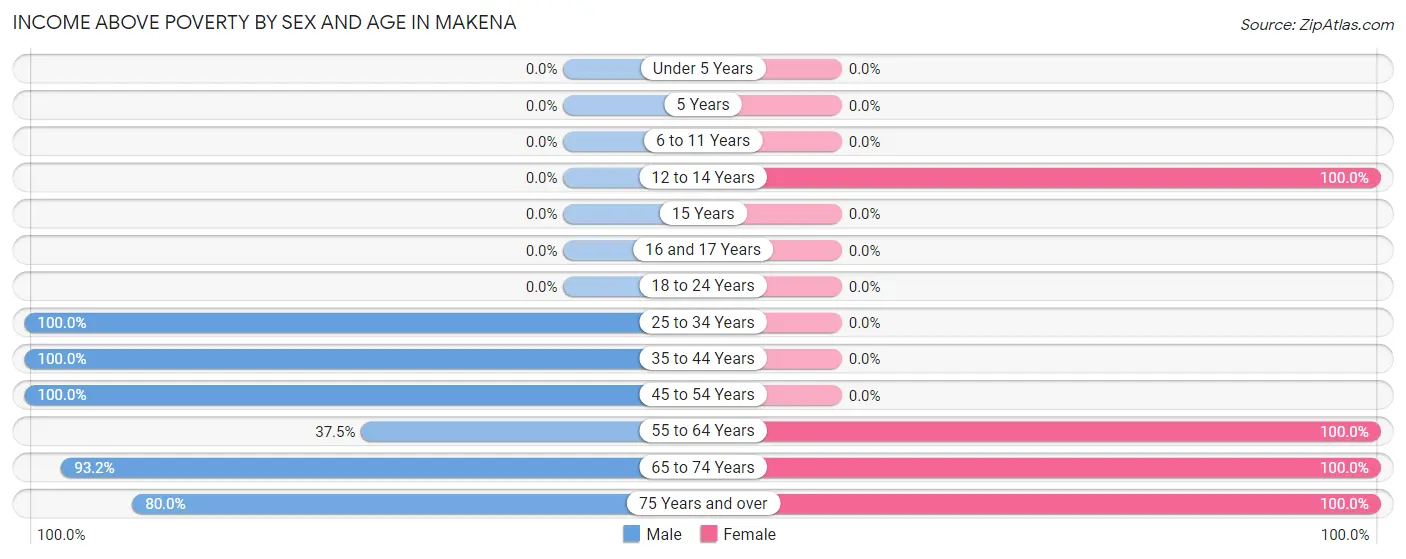
| Age Bracket | Male | Female |
| Under 5 Years | 0 (0.0%) | 0 (0.0%) |
| 5 Years | 0 (0.0%) | 0 (0.0%) |
| 6 to 11 Years | 0 (0.0%) | 0 (0.0%) |
| 12 to 14 Years | 0 (0.0%) | 8 (100.0%) |
| 15 Years | 0 (0.0%) | 0 (0.0%) |
| 16 and 17 Years | 0 (0.0%) | 0 (0.0%) |
| 18 to 24 Years | 0 (0.0%) | 0 (0.0%) |
| 25 to 34 Years | 3 (100.0%) | 0 (0.0%) |
| 35 to 44 Years | 2 (100.0%) | 0 (0.0%) |
| 45 to 54 Years | 15 (100.0%) | 0 (0.0%) |
| 55 to 64 Years | 3 (37.5%) | 38 (100.0%) |
| 65 to 74 Years | 41 (93.2%) | 13 (100.0%) |
| 75 Years and over | 16 (80.0%) | 3 (100.0%) |
| Total | 80 (87.0%) | 62 (93.9%) |
Income Below Poverty Among Married-Couple Families in Makena
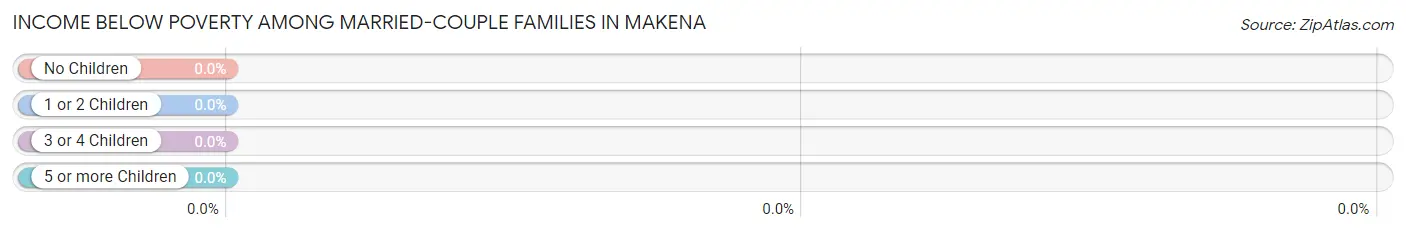
| Children | Above Poverty | Below Poverty |
| No Children | 43 (100.0%) | 0 (0.0%) |
| 1 or 2 Children | 6 (100.0%) | 0 (0.0%) |
| 3 or 4 Children | 0 (0.0%) | 0 (0.0%) |
| 5 or more Children | 0 (0.0%) | 0 (0.0%) |
| Total | 49 (100.0%) | 0 (0.0%) |
Income Below Poverty Among Single-Parent Households in Makena
| Children | Single Father | Single Mother |
| No Children | 0 (0.0%) | 0 (0.0%) |
| 1 or 2 Children | 0 (0.0%) | 0 (0.0%) |
| 3 or 4 Children | 0 (0.0%) | 0 (0.0%) |
| 5 or more Children | 0 (0.0%) | 0 (0.0%) |
| Total | 0 (0.0%) | 0 (0.0%) |
Income Below Poverty Among Married-Couple vs Single-Parent Households in Makena
| Children | Married-Couple Families | Single-Parent Households |
| No Children | 0 (0.0%) | 0 (0.0%) |
| 1 or 2 Children | 0 (0.0%) | 0 (0.0%) |
| 3 or 4 Children | 0 (0.0%) | 0 (0.0%) |
| 5 or more Children | 0 (0.0%) | 0 (0.0%) |
| Total | 0 (0.0%) | 0 (0.0%) |
Race in Makena
The most populous races in Makena are White / Caucasian (119 | 75.3%), Asian (15 | 9.5%), and Hawaiian / Pacific (15 | 9.5%).
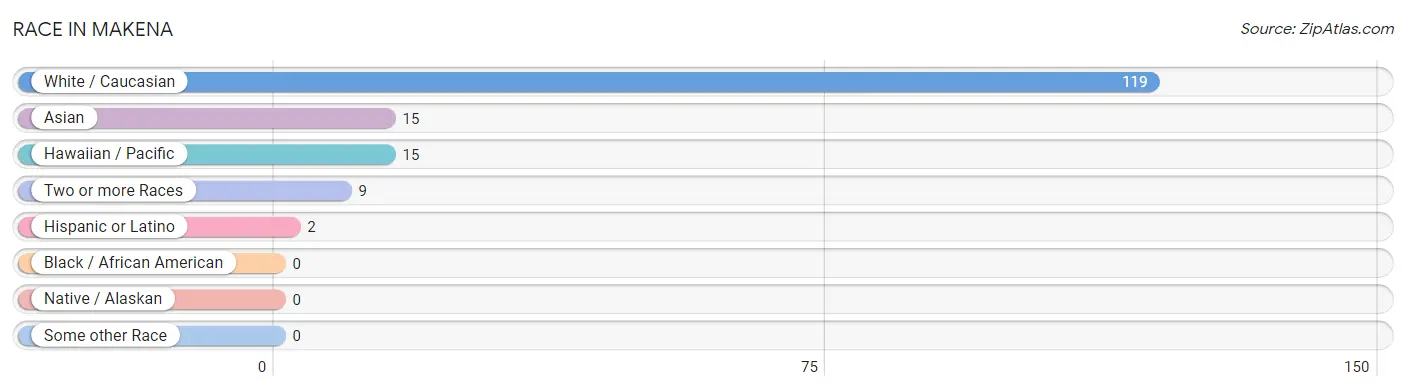
| Race | # Population | % Population |
| Asian | 15 | 9.5% |
| Black / African American | 0 | 0.0% |
| Hawaiian / Pacific | 15 | 9.5% |
| Hispanic or Latino | 2 | 1.3% |
| Native / Alaskan | 0 | 0.0% |
| White / Caucasian | 119 | 75.3% |
| Two or more Races | 9 | 5.7% |
| Some other Race | 0 | 0.0% |
| Total | 158 | 100.0% |
Ancestry in Makena
The most populous ancestries reported in Makena are Irish (24 | 15.2%), German (20 | 12.7%), English (18 | 11.4%), Italian (16 | 10.1%), and Native Hawaiian (14 | 8.9%), together accounting for 58.2% of all Makena residents.
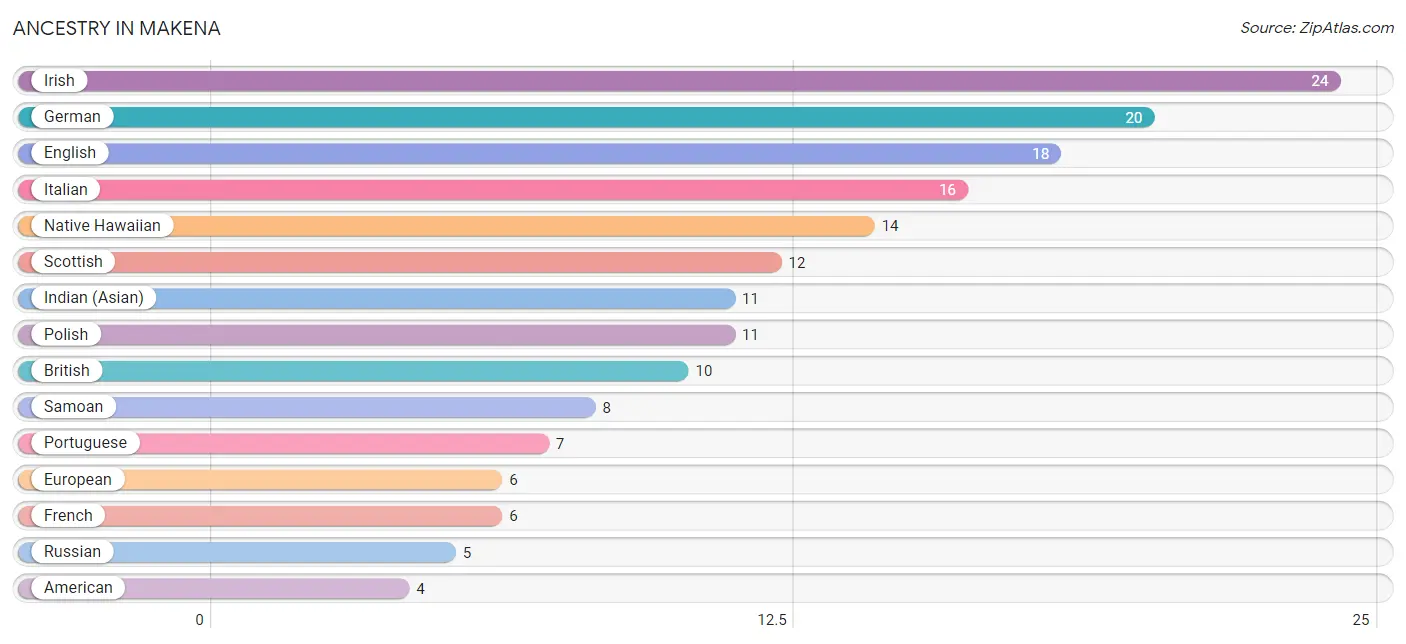
| Ancestry | # Population | % Population |
| American | 4 | 2.5% |
| Bhutanese | 4 | 2.5% |
| British | 10 | 6.3% |
| English | 18 | 11.4% |
| European | 6 | 3.8% |
| French | 6 | 3.8% |
| German | 20 | 12.7% |
| Indian (Asian) | 11 | 7.0% |
| Irish | 24 | 15.2% |
| Italian | 16 | 10.1% |
| Mexican | 2 | 1.3% |
| Native Hawaiian | 14 | 8.9% |
| Northern European | 2 | 1.3% |
| Polish | 11 | 7.0% |
| Portuguese | 7 | 4.4% |
| Romanian | 3 | 1.9% |
| Russian | 5 | 3.2% |
| Samoan | 8 | 5.1% |
| Scottish | 12 | 7.6% |
| Serbian | 1 | 0.6% |
| Slavic | 1 | 0.6% |
| Swedish | 4 | 2.5% | View All 22 Rows |
Immigrants in Makena
The most numerous immigrant groups reported in Makena came from Asia (11 | 7.0%), China (11 | 7.0%), Eastern Asia (11 | 7.0%), Hong Kong (11 | 7.0%), and Europe (6 | 3.8%), together accounting for 31.6% of all Makena residents.
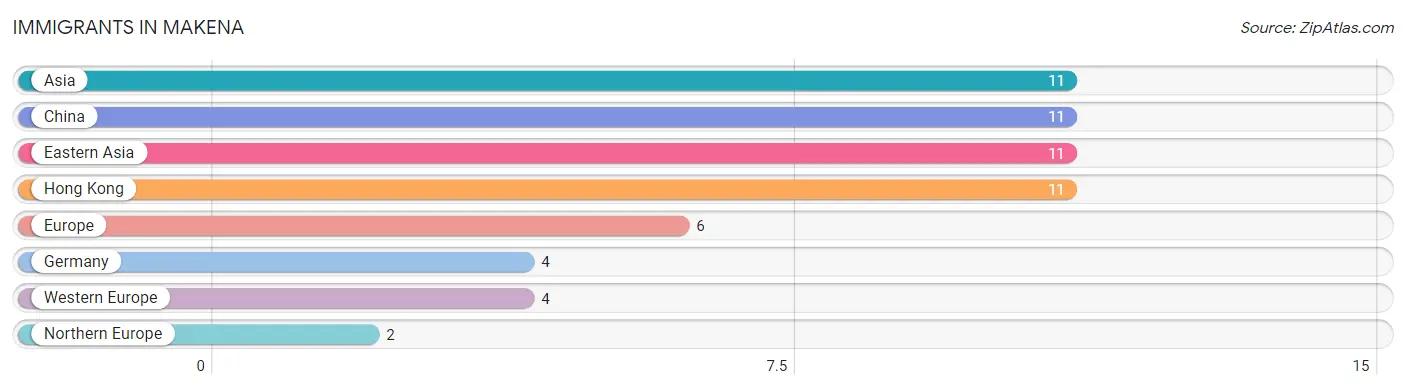
| Immigration Origin | # Population | % Population |
| Asia | 11 | 7.0% |
| China | 11 | 7.0% |
| Eastern Asia | 11 | 7.0% |
| Europe | 6 | 3.8% |
| Germany | 4 | 2.5% |
| Hong Kong | 11 | 7.0% |
| Northern Europe | 2 | 1.3% |
| Western Europe | 4 | 2.5% | View All 8 Rows |
Sex and Age in Makena
Sex and Age in Makena
The most populous age groups in Makena are 65 to 69 Years (37 | 40.2%) for men and 60 to 64 Years (37 | 56.1%) for women.
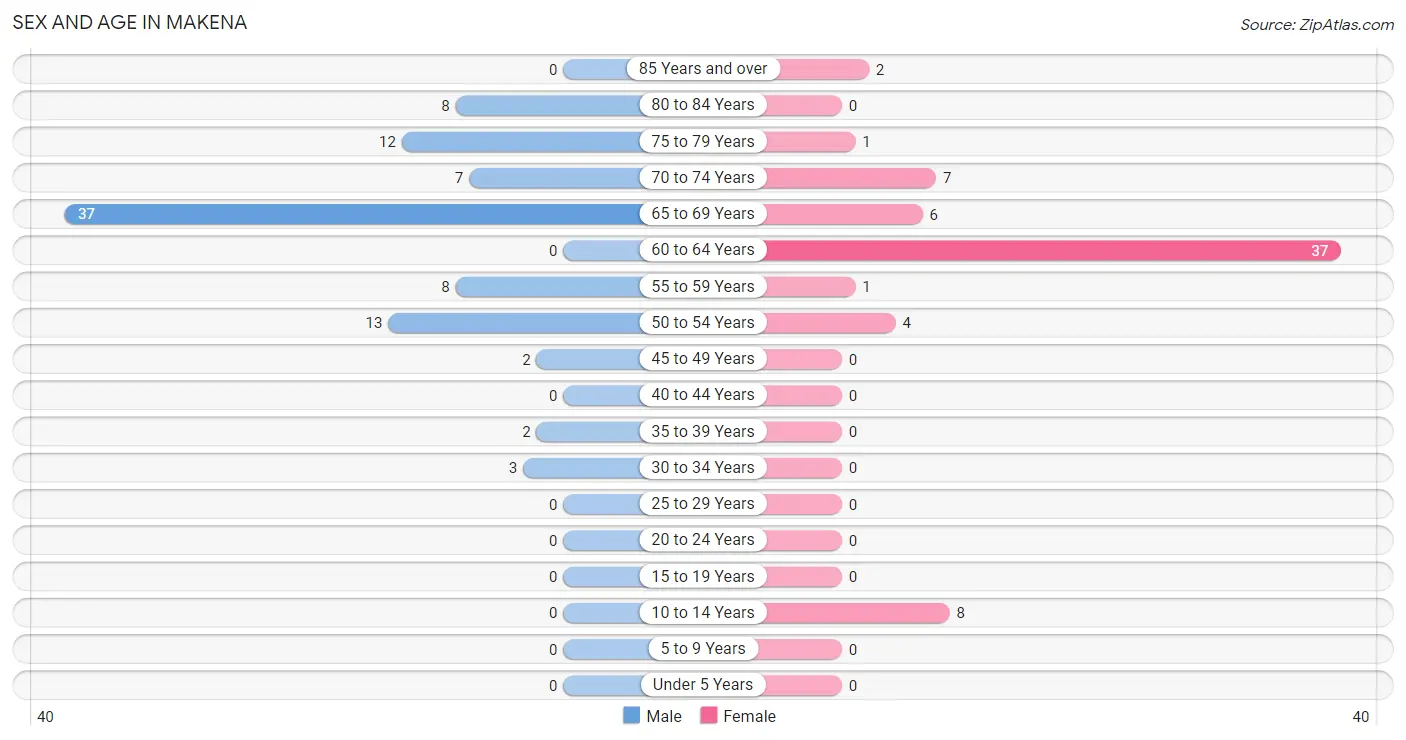
| Age Bracket | Male | Female |
| Under 5 Years | 0 (0.0%) | 0 (0.0%) |
| 5 to 9 Years | 0 (0.0%) | 0 (0.0%) |
| 10 to 14 Years | 0 (0.0%) | 8 (12.1%) |
| 15 to 19 Years | 0 (0.0%) | 0 (0.0%) |
| 20 to 24 Years | 0 (0.0%) | 0 (0.0%) |
| 25 to 29 Years | 0 (0.0%) | 0 (0.0%) |
| 30 to 34 Years | 3 (3.3%) | 0 (0.0%) |
| 35 to 39 Years | 2 (2.2%) | 0 (0.0%) |
| 40 to 44 Years | 0 (0.0%) | 0 (0.0%) |
| 45 to 49 Years | 2 (2.2%) | 0 (0.0%) |
| 50 to 54 Years | 13 (14.1%) | 4 (6.1%) |
| 55 to 59 Years | 8 (8.7%) | 1 (1.5%) |
| 60 to 64 Years | 0 (0.0%) | 37 (56.1%) |
| 65 to 69 Years | 37 (40.2%) | 6 (9.1%) |
| 70 to 74 Years | 7 (7.6%) | 7 (10.6%) |
| 75 to 79 Years | 12 (13.0%) | 1 (1.5%) |
| 80 to 84 Years | 8 (8.7%) | 0 (0.0%) |
| 85 Years and over | 0 (0.0%) | 2 (3.0%) |
| Total | 92 (100.0%) | 66 (100.0%) |
Families and Households in Makena
Median Family Size in Makena
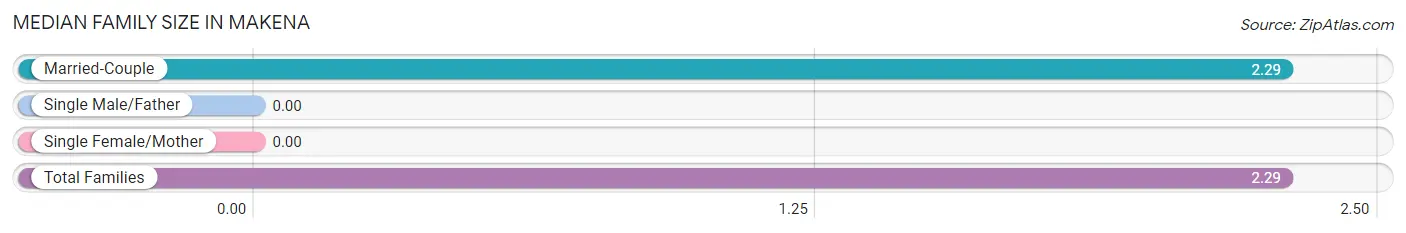
| Family Type | # Families | Family Size |
| Married-Couple | 49 (100.0%) | 2.29 |
| Single Male/Father | 0 (0.0%) | - |
| Single Female/Mother | 0 (0.0%) | - |
| Total Families | 49 (100.0%) | 2.29 |
Median Household Size in Makena
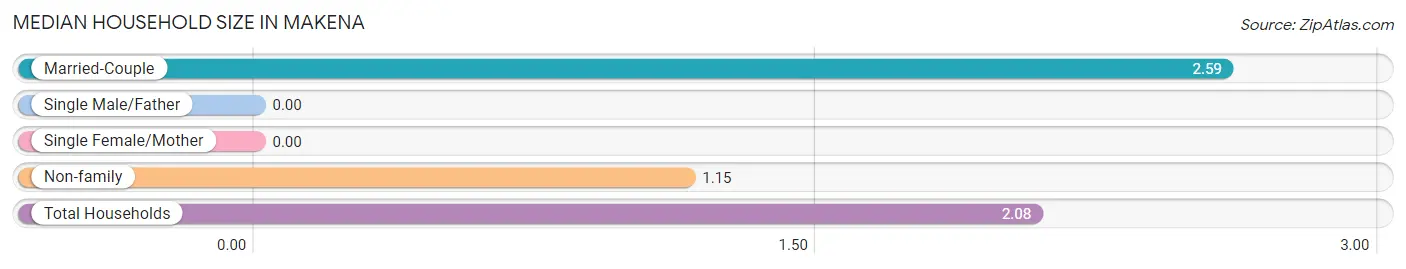
| Household Type | # Households | Household Size |
| Married-Couple | 49 (64.5%) | 2.59 |
| Single Male/Father | 0 (0.0%) | - |
| Single Female/Mother | 0 (0.0%) | - |
| Non-family | 27 (35.5%) | 1.15 |
| Total Households | 76 (100.0%) | 2.08 |
Household Size by Marriage Status in Makena
Out of a total of 76 households in Makena, 49 (64.5%) are family households, while 27 (35.5%) are nonfamily households. The most numerous type of family households are 2-person households, comprising 36, and the most common type of nonfamily households are 1-person households, comprising 22.
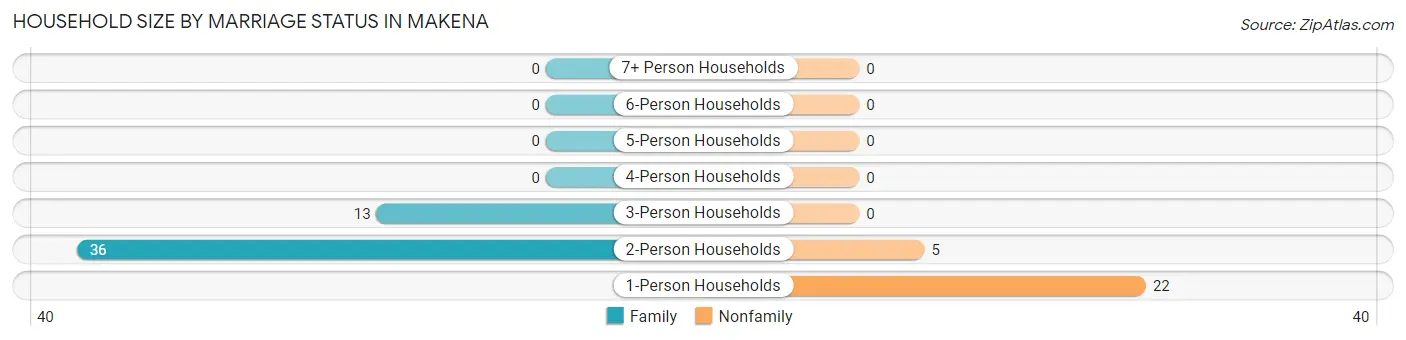
| Household Size | Family Households | Nonfamily Households |
| 1-Person Households | - | 22 (28.9%) |
| 2-Person Households | 36 (47.4%) | 5 (6.6%) |
| 3-Person Households | 13 (17.1%) | 0 (0.0%) |
| 4-Person Households | 0 (0.0%) | 0 (0.0%) |
| 5-Person Households | 0 (0.0%) | 0 (0.0%) |
| 6-Person Households | 0 (0.0%) | 0 (0.0%) |
| 7+ Person Households | 0 (0.0%) | 0 (0.0%) |
| Total | 49 (64.5%) | 27 (35.5%) |
Female Fertility in Makena
Fertility by Age in Makena
| Age Bracket | Women with Births | Births / 1,000 Women |
| 15 to 19 years | 0 (0.0%) | 0.0 |
| 20 to 34 years | 0 (0.0%) | 0.0 |
| 35 to 50 years | 0 (0.0%) | 0.0 |
| Total | 0 (0.0%) | 0.0 |
Fertility by Age by Marriage Status in Makena
| Age Bracket | Married | Unmarried |
| 15 to 19 years | 0 (0.0%) | 0 (0.0%) |
| 20 to 34 years | 0 (0.0%) | 0 (0.0%) |
| 35 to 50 years | 0 (0.0%) | 0 (0.0%) |
| Total | 0 (0.0%) | 0 (0.0%) |
Fertility by Education in Makena
| Educational Attainment | Women with Births | Births / 1,000 Women |
| Less than High School | 0 (0.0%) | 0.0 |
| High School Diploma | 0 (0.0%) | 0.0 |
| College or Associate's Degree | 0 (0.0%) | 0.0 |
| Bachelor's Degree | 0 (0.0%) | 0.0 |
| Graduate Degree | 0 (0.0%) | 0.0 |
| Total | 0 (0.0%) | 0.0 |
Fertility by Education by Marriage Status in Makena
| Educational Attainment | Married | Unmarried |
| Less than High School | 0 (0.0%) | 0 (0.0%) |
| High School Diploma | 0 (0.0%) | 0 (0.0%) |
| College or Associate's Degree | 0 (0.0%) | 0 (0.0%) |
| Bachelor's Degree | 0 (0.0%) | 0 (0.0%) |
| Graduate Degree | 0 (0.0%) | 0 (0.0%) |
| Total | 0 (0.0%) | 0 (0.0%) |
Employment Characteristics in Makena
Employment by Class of Employer in Makena
Among the 44 employed individuals in Makena, self-employed (incorporated) (18 | 40.9%), private company employees (15 | 34.1%), and state government employees (6 | 13.6%) make up the most common classes of employment.
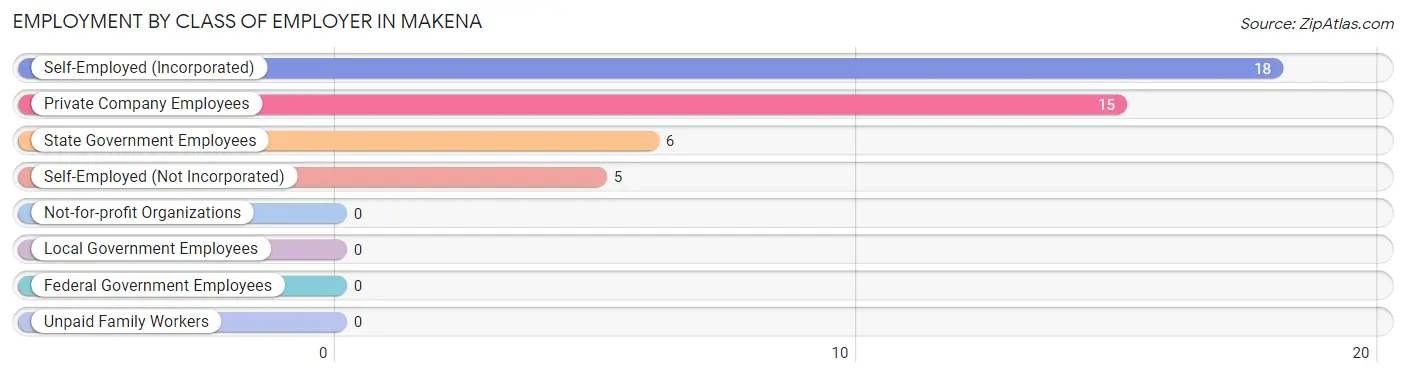
| Employer Class | # Employees | % Employees |
| Private Company Employees | 15 | 34.1% |
| Self-Employed (Incorporated) | 18 | 40.9% |
| Self-Employed (Not Incorporated) | 5 | 11.4% |
| Not-for-profit Organizations | 0 | 0.0% |
| Local Government Employees | 0 | 0.0% |
| State Government Employees | 6 | 13.6% |
| Federal Government Employees | 0 | 0.0% |
| Unpaid Family Workers | 0 | 0.0% |
| Total | 44 | 100.0% |
Employment Status by Age in Makena
According to the labor force statistics for Makena, out of the total population over 16 years of age (150), 30.7% or 46 individuals are in the labor force, with 4.3% or 2 of them unemployed. The age group with the highest labor force participation rate is 30 to 34 years, with 100.0% or 3 individuals in the labor force. Within the labor force, the 30 to 34 years age range has the highest percentage of unemployed individuals, with 33.3% or 1 of them being unemployed.
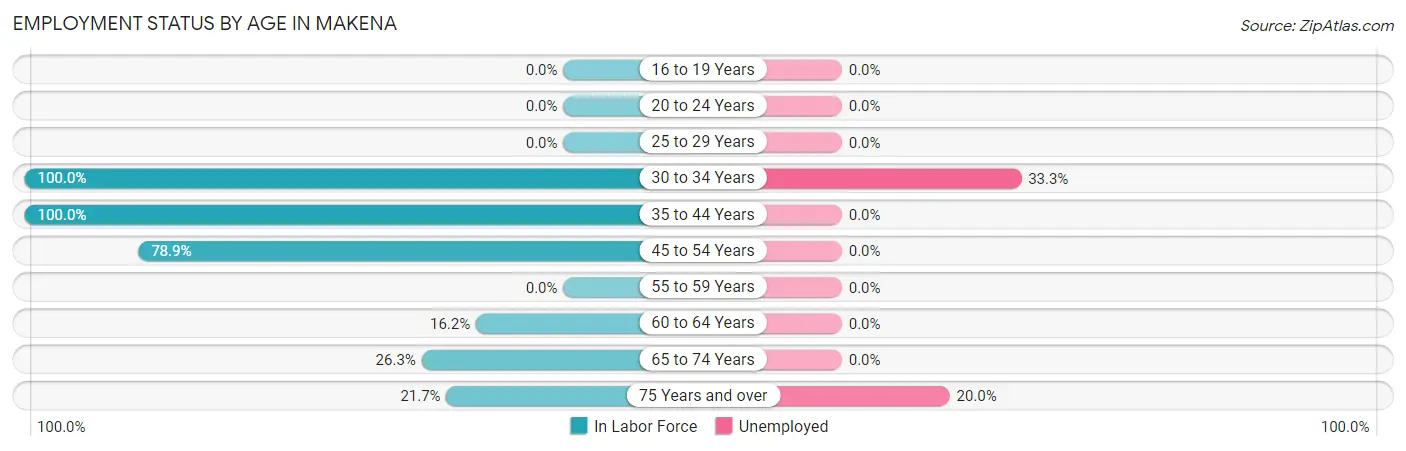
| Age Bracket | In Labor Force | Unemployed |
| 16 to 19 Years | 0 (0.0%) | 0 (0.0%) |
| 20 to 24 Years | 0 (0.0%) | 0 (0.0%) |
| 25 to 29 Years | 0 (0.0%) | 0 (0.0%) |
| 30 to 34 Years | 3 (100.0%) | 1 (33.3%) |
| 35 to 44 Years | 2 (100.0%) | 0 (0.0%) |
| 45 to 54 Years | 15 (78.9%) | 0 (0.0%) |
| 55 to 59 Years | 0 (0.0%) | 0 (0.0%) |
| 60 to 64 Years | 6 (16.2%) | 0 (0.0%) |
| 65 to 74 Years | 15 (26.3%) | 0 (0.0%) |
| 75 Years and over | 5 (21.7%) | 1 (20.0%) |
| Total | 46 (30.7%) | 2 (4.3%) |
Employment Status by Educational Attainment in Makena
According to labor force statistics for Makena, 37.1% of individuals (26) out of the total population between 25 and 64 years of age (70) are in the labor force, with 3.8% or 1 of them being unemployed. The group with the highest labor force participation rate are those with the educational attainment of high school diploma, with 75.0% or 15 individuals in the labor force. Within the labor force, individuals with college / associate degree education have the highest percentage of unemployment, with 20.0% or 1 of them being unemployed.
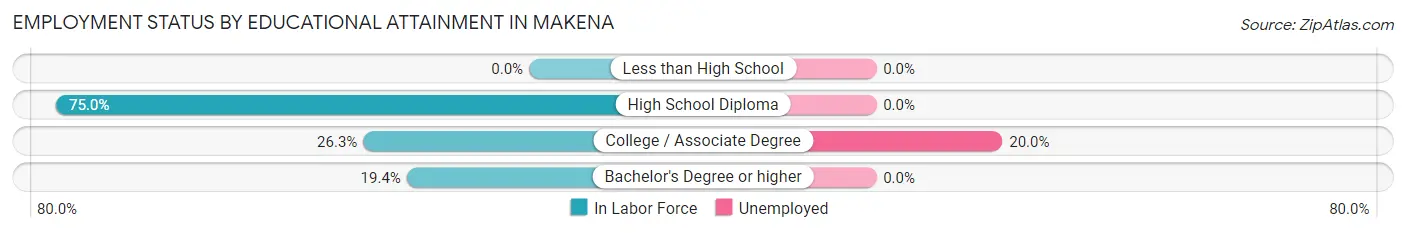
| Educational Attainment | In Labor Force | Unemployed |
| Less than High School | 0 (0.0%) | 0 (0.0%) |
| High School Diploma | 15 (75.0%) | 0 (0.0%) |
| College / Associate Degree | 5 (26.3%) | 4 (20.0%) |
| Bachelor's Degree or higher | 6 (19.4%) | 0 (0.0%) |
| Total | 26 (37.1%) | 3 (3.8%) |
Employment Occupations by Sex in Makena
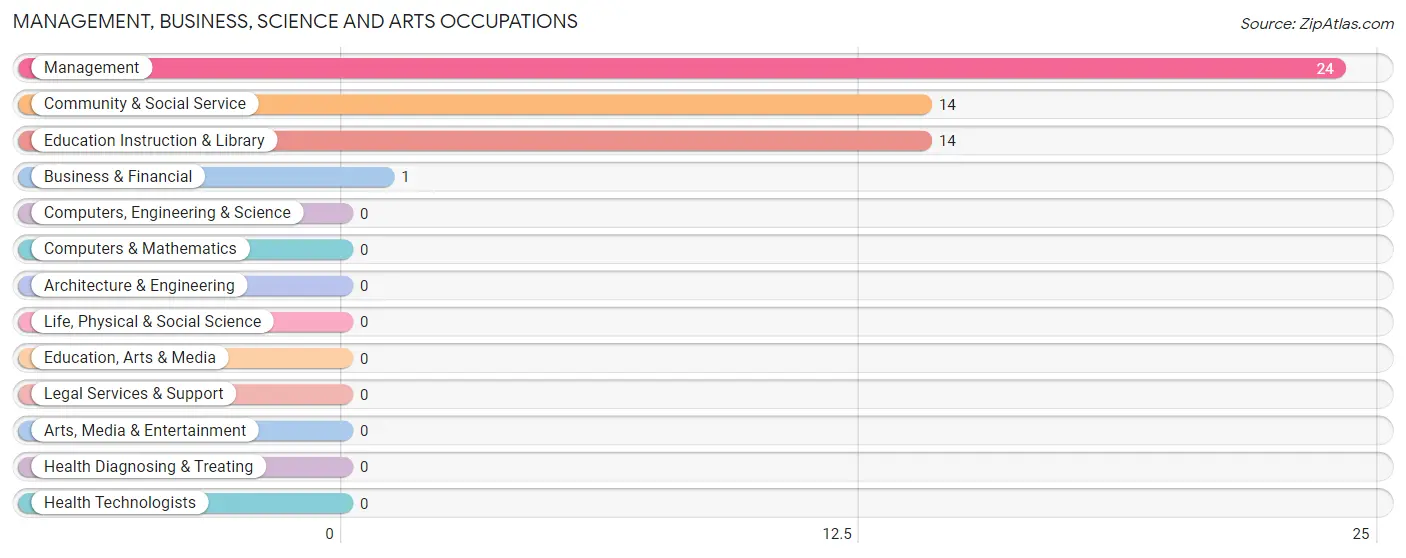
Management, Business, Science and Arts Occupations
The most common Management, Business, Science and Arts occupations in Makena are Management (24 | 54.5%), Community & Social Service (14 | 31.8%), Education Instruction & Library (14 | 31.8%), and Business & Financial (1 | 2.3%).
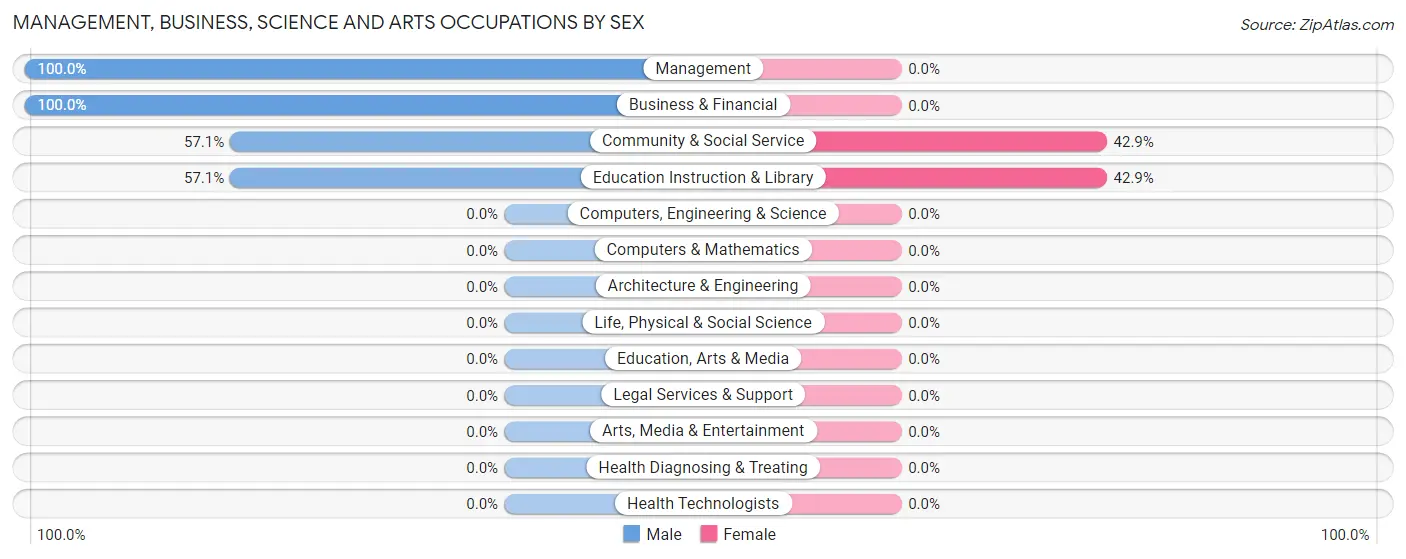
Management, Business, Science and Arts Occupations by Sex
Within the Management, Business, Science and Arts occupations in Makena, the most male-oriented occupations are Management (100.0%), Business & Financial (100.0%), and Community & Social Service (57.1%), while the most female-oriented occupations are Community & Social Service (42.9%), and Education Instruction & Library (42.9%).
| Occupation | Male | Female |
| Management | 24 (100.0%) | 0 (0.0%) |
| Business & Financial | 1 (100.0%) | 0 (0.0%) |
| Computers, Engineering & Science | 0 (0.0%) | 0 (0.0%) |
| Computers & Mathematics | 0 (0.0%) | 0 (0.0%) |
| Architecture & Engineering | 0 (0.0%) | 0 (0.0%) |
| Life, Physical & Social Science | 0 (0.0%) | 0 (0.0%) |
| Community & Social Service | 8 (57.1%) | 6 (42.9%) |
| Education, Arts & Media | 0 (0.0%) | 0 (0.0%) |
| Legal Services & Support | 0 (0.0%) | 0 (0.0%) |
| Education Instruction & Library | 8 (57.1%) | 6 (42.9%) |
| Arts, Media & Entertainment | 0 (0.0%) | 0 (0.0%) |
| Health Diagnosing & Treating | 0 (0.0%) | 0 (0.0%) |
| Health Technologists | 0 (0.0%) | 0 (0.0%) |
| Total (Category) | 33 (84.6%) | 6 (15.4%) |
| Total (Overall) | 38 (86.4%) | 6 (13.6%) |
Services Occupations
Services Occupations by Sex
| Occupation | Male | Female |
| Healthcare Support | 0 (0.0%) | 0 (0.0%) |
| Security & Protection | 0 (0.0%) | 0 (0.0%) |
| Firefighting & Prevention | 0 (0.0%) | 0 (0.0%) |
| Law Enforcement | 0 (0.0%) | 0 (0.0%) |
| Food Preparation & Serving | 0 (0.0%) | 0 (0.0%) |
| Cleaning & Maintenance | 0 (0.0%) | 0 (0.0%) |
| Personal Care & Service | 0 (0.0%) | 0 (0.0%) |
| Total (Category) | 0 (0.0%) | 0 (0.0%) |
| Total (Overall) | 38 (86.4%) | 6 (13.6%) |
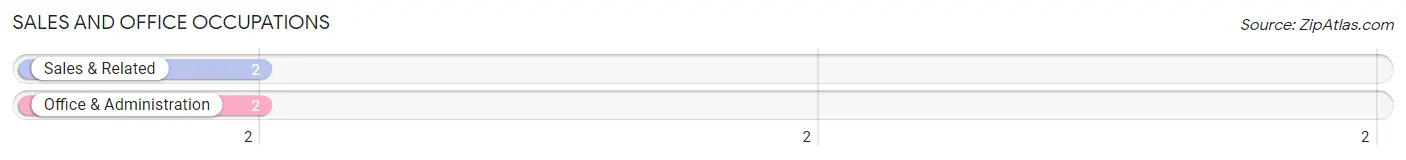
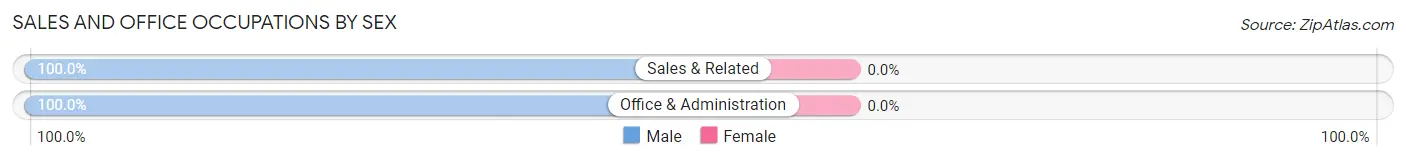
Sales and Office Occupations
The most common Sales and Office occupations in Makena are Sales & Related (2 | 4.5%), and Office & Administration (2 | 4.5%).
Sales and Office Occupations by Sex
| Occupation | Male | Female |
| Sales & Related | 2 (100.0%) | 0 (0.0%) |
| Office & Administration | 2 (100.0%) | 0 (0.0%) |
| Total (Category) | 4 (100.0%) | 0 (0.0%) |
| Total (Overall) | 38 (86.4%) | 6 (13.6%) |
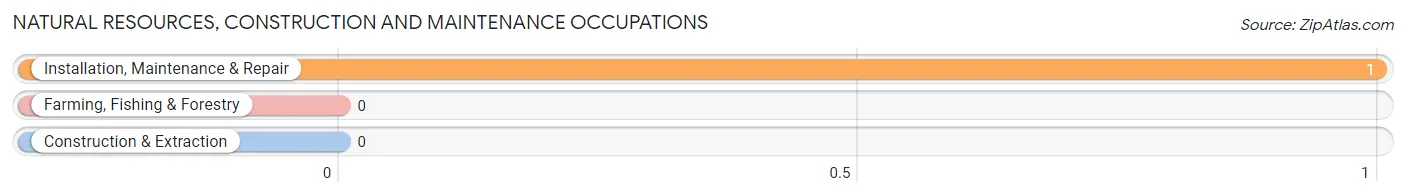
Natural Resources, Construction and Maintenance Occupations
The most common Natural Resources, Construction and Maintenance occupations in Makena are , and Installation, Maintenance & Repair (1 | 2.3%).
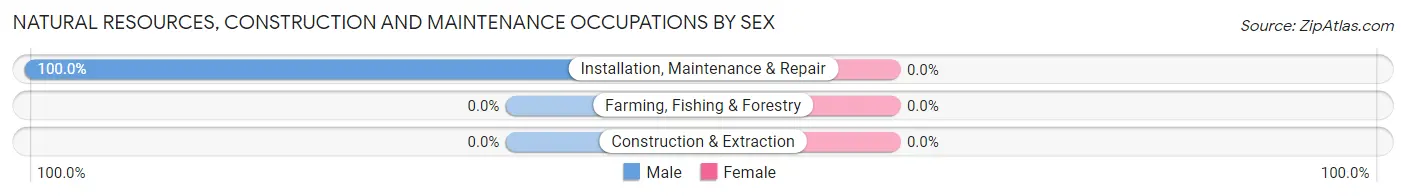
Natural Resources, Construction and Maintenance Occupations by Sex
| Occupation | Male | Female |
| Farming, Fishing & Forestry | 0 (0.0%) | 0 (0.0%) |
| Construction & Extraction | 0 (0.0%) | 0 (0.0%) |
| Installation, Maintenance & Repair | 1 (100.0%) | 0 (0.0%) |
| Total (Category) | 1 (100.0%) | 0 (0.0%) |
| Total (Overall) | 38 (86.4%) | 6 (13.6%) |
Production, Transportation and Moving Occupations
Production, Transportation and Moving Occupations by Sex
| Occupation | Male | Female |
| Production | 0 (0.0%) | 0 (0.0%) |
| Transportation | 0 (0.0%) | 0 (0.0%) |
| Material Moving | 0 (0.0%) | 0 (0.0%) |
| Total (Category) | 0 (0.0%) | 0 (0.0%) |
| Total (Overall) | 38 (86.4%) | 6 (13.6%) |
Employment Industries by Sex in Makena
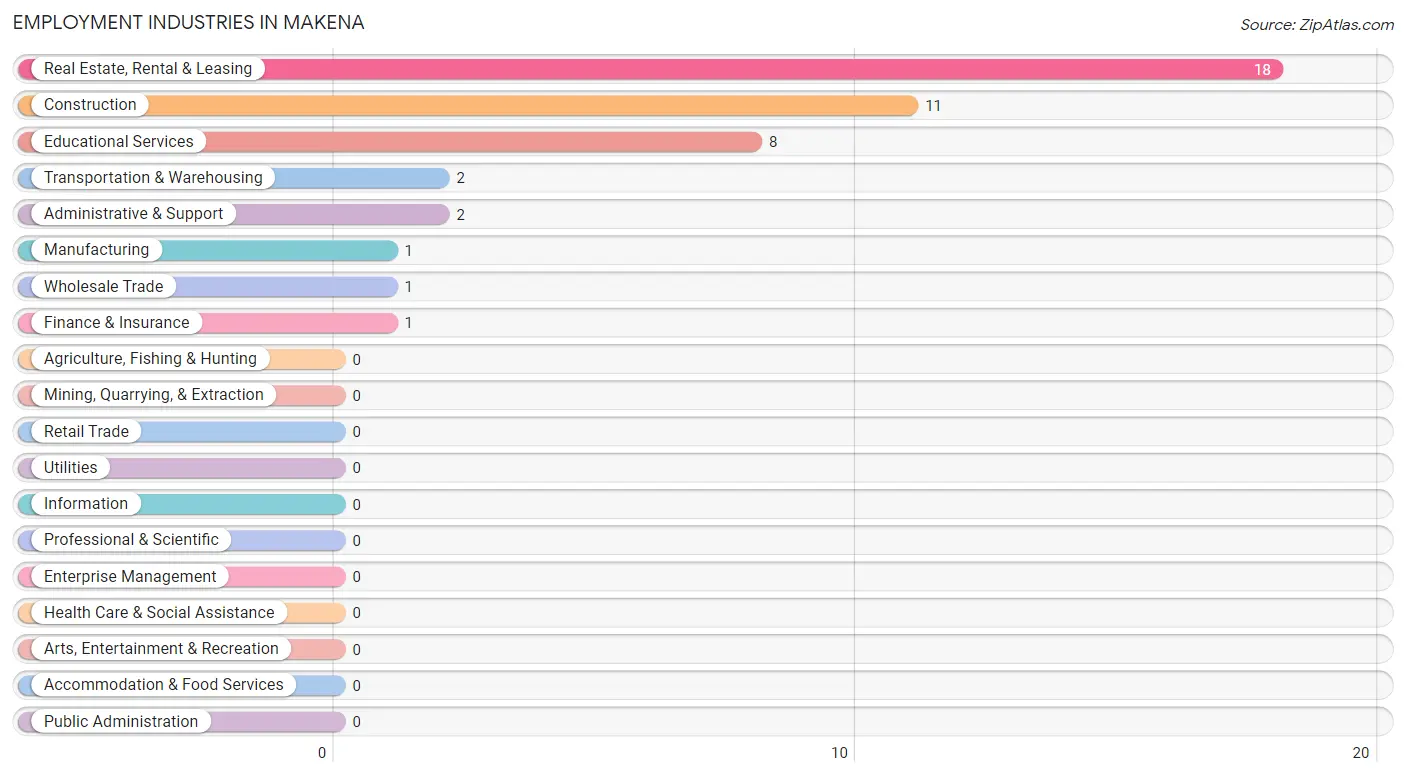
Employment Industries in Makena
The major employment industries in Makena include Real Estate, Rental & Leasing (18 | 40.9%), Construction (11 | 25.0%), Educational Services (8 | 18.2%), Transportation & Warehousing (2 | 4.5%), and Administrative & Support (2 | 4.5%).
Employment Industries by Sex in Makena
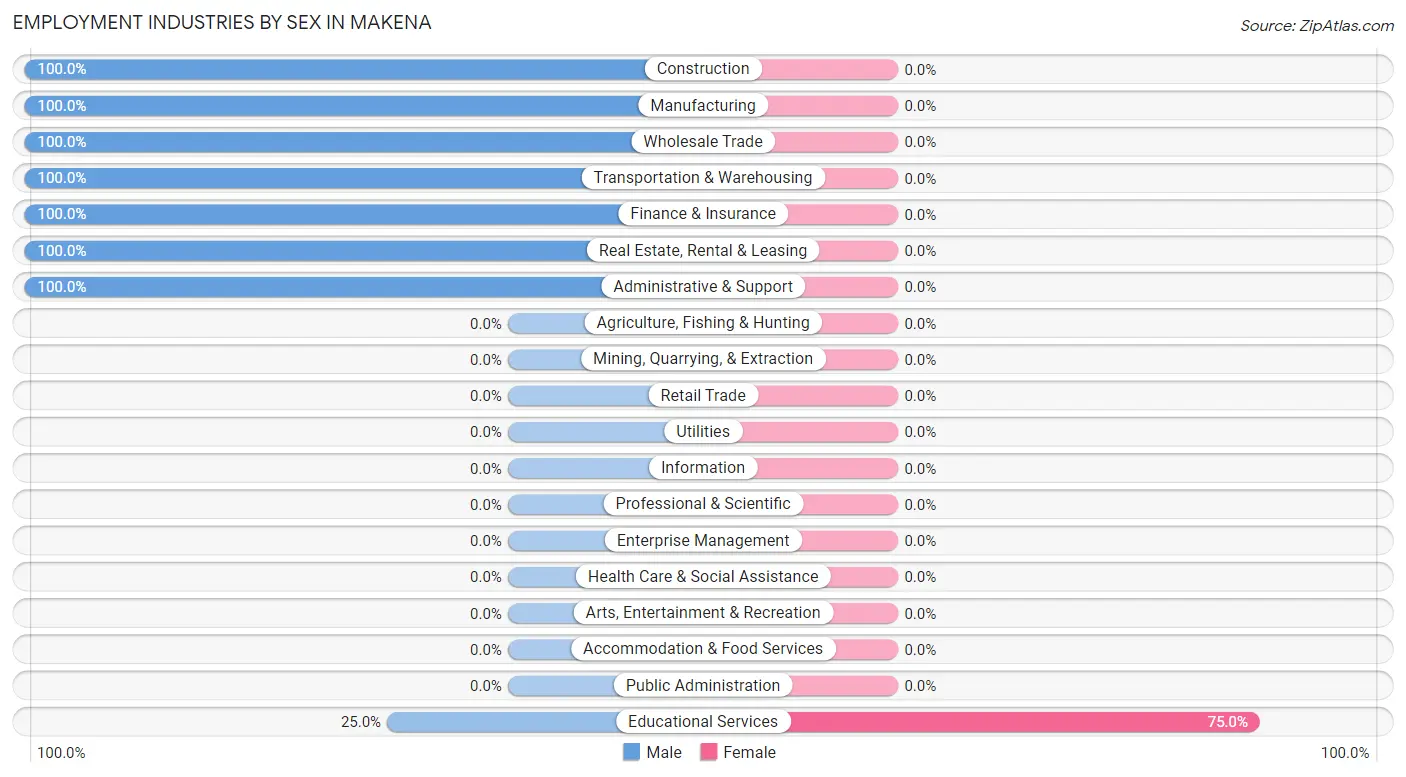
| Industry | Male | Female |
| Agriculture, Fishing & Hunting | 0 (0.0%) | 0 (0.0%) |
| Mining, Quarrying, & Extraction | 0 (0.0%) | 0 (0.0%) |
| Construction | 11 (100.0%) | 0 (0.0%) |
| Manufacturing | 1 (100.0%) | 0 (0.0%) |
| Wholesale Trade | 1 (100.0%) | 0 (0.0%) |
| Retail Trade | 0 (0.0%) | 0 (0.0%) |
| Transportation & Warehousing | 2 (100.0%) | 0 (0.0%) |
| Utilities | 0 (0.0%) | 0 (0.0%) |
| Information | 0 (0.0%) | 0 (0.0%) |
| Finance & Insurance | 1 (100.0%) | 0 (0.0%) |
| Real Estate, Rental & Leasing | 18 (100.0%) | 0 (0.0%) |
| Professional & Scientific | 0 (0.0%) | 0 (0.0%) |
| Enterprise Management | 0 (0.0%) | 0 (0.0%) |
| Administrative & Support | 2 (100.0%) | 0 (0.0%) |
| Educational Services | 2 (25.0%) | 6 (75.0%) |
| Health Care & Social Assistance | 0 (0.0%) | 0 (0.0%) |
| Arts, Entertainment & Recreation | 0 (0.0%) | 0 (0.0%) |
| Accommodation & Food Services | 0 (0.0%) | 0 (0.0%) |
| Public Administration | 0 (0.0%) | 0 (0.0%) |
| Total | 38 (86.4%) | 6 (13.6%) |
Education in Makena
School Enrollment in Makena
The most common levels of schooling among the 10 students in Makena are middle school (8 | 80.0%), and college / undergraduate (2 | 20.0%).
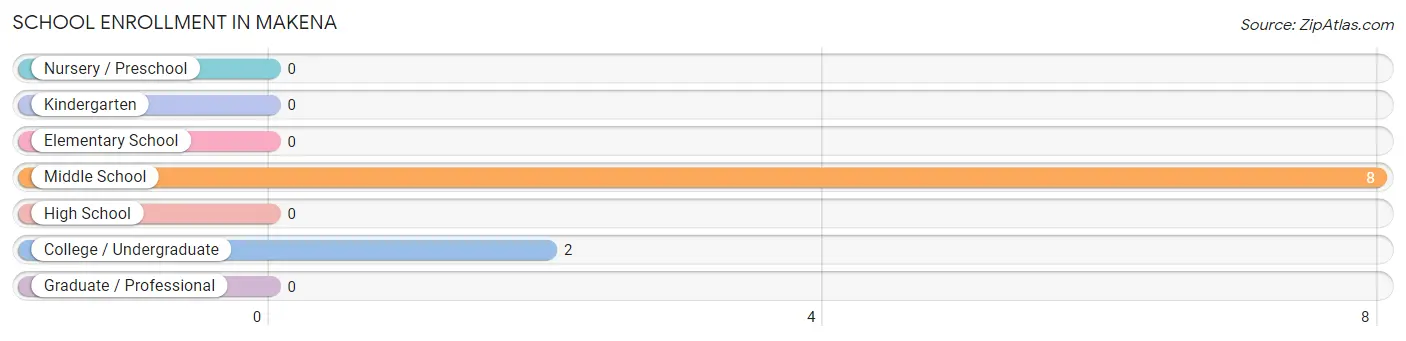
| School Level | # Students | % Students |
| Nursery / Preschool | 0 | 0.0% |
| Kindergarten | 0 | 0.0% |
| Elementary School | 0 | 0.0% |
| Middle School | 8 | 80.0% |
| High School | 0 | 0.0% |
| College / Undergraduate | 2 | 20.0% |
| Graduate / Professional | 0 | 0.0% |
| Total | 10 | 100.0% |
School Enrollment by Age by Funding Source in Makena
Out of a total of 10 students who are enrolled in schools in Makena, 8 (80.0%) attend a private institution, while the remaining 2 (20.0%) are enrolled in public schools. The age group of 10 to 14 year olds has the highest likelihood of being enrolled in private schools, with 8 (100.0% in the age bracket) enrolled. Conversely, the age group of 35 years and over has the lowest likelihood of being enrolled in a private school, with 2 (100.0% in the age bracket) attending a public institution.
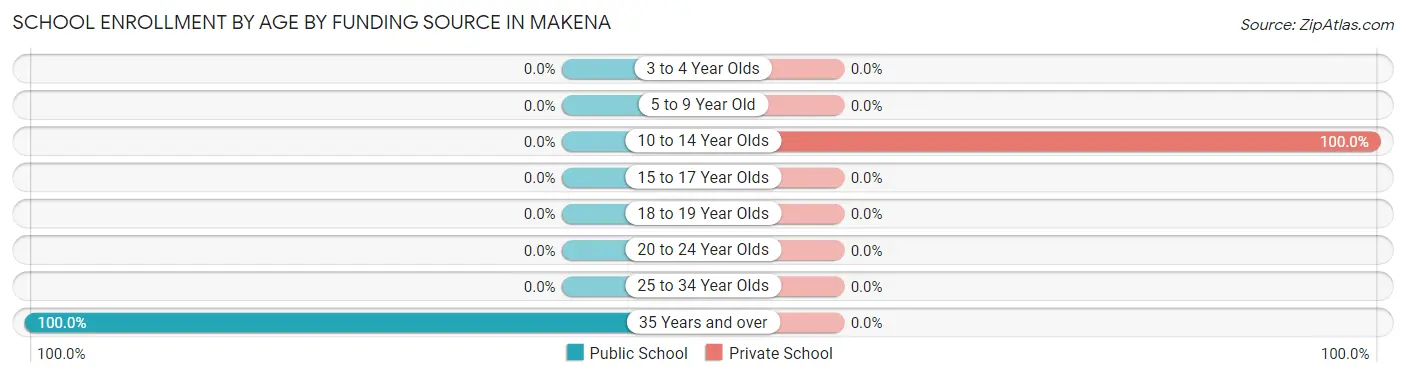
| Age Bracket | Public School | Private School |
| 3 to 4 Year Olds | 0 (0.0%) | 0 (0.0%) |
| 5 to 9 Year Old | 0 (0.0%) | 0 (0.0%) |
| 10 to 14 Year Olds | 0 (0.0%) | 8 (100.0%) |
| 15 to 17 Year Olds | 0 (0.0%) | 0 (0.0%) |
| 18 to 19 Year Olds | 0 (0.0%) | 0 (0.0%) |
| 20 to 24 Year Olds | 0 (0.0%) | 0 (0.0%) |
| 25 to 34 Year Olds | 0 (0.0%) | 0 (0.0%) |
| 35 Years and over | 2 (100.0%) | 0 (0.0%) |
| Total | 2 (20.0%) | 8 (80.0%) |
Educational Attainment by Field of Study in Makena
Engineering (20 | 19.8%), social sciences (19 | 18.8%), business (17 | 16.8%), education (17 | 16.8%), and computers & mathematics (14 | 13.9%) are the most common fields of study among 101 individuals in Makena who have obtained a bachelor's degree or higher.
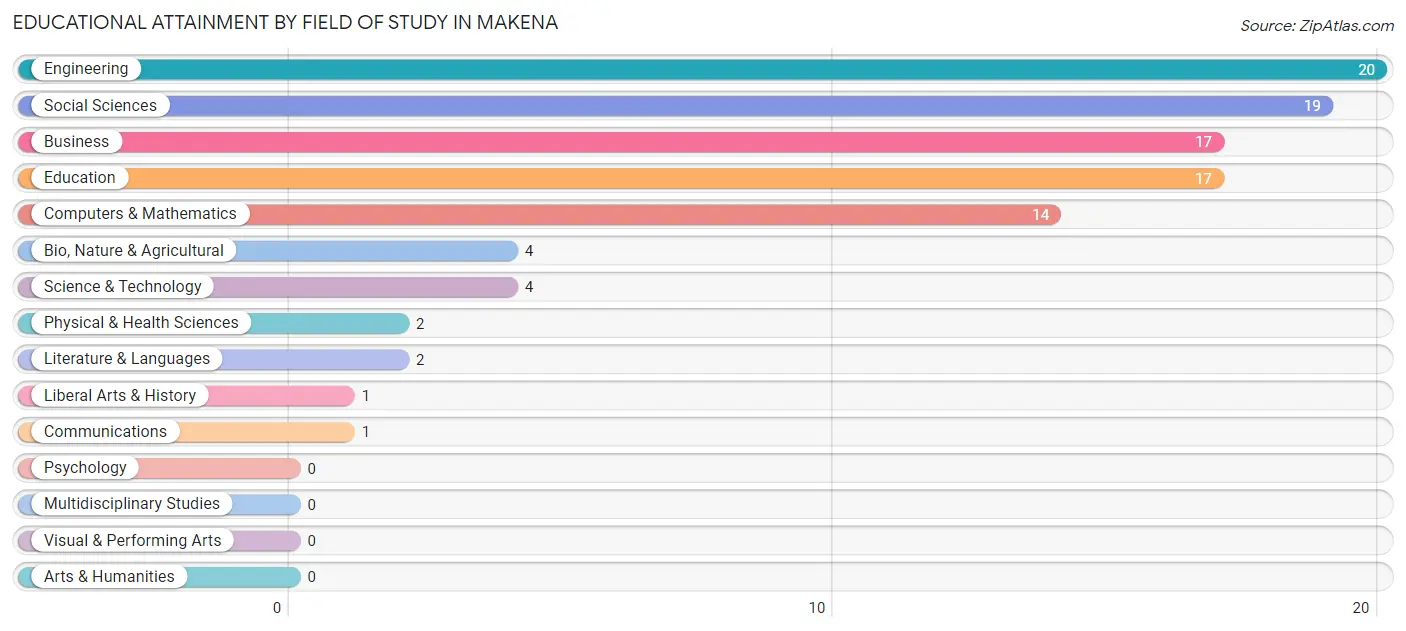
| Field of Study | # Graduates | % Graduates |
| Computers & Mathematics | 14 | 13.9% |
| Bio, Nature & Agricultural | 4 | 4.0% |
| Physical & Health Sciences | 2 | 2.0% |
| Psychology | 0 | 0.0% |
| Social Sciences | 19 | 18.8% |
| Engineering | 20 | 19.8% |
| Multidisciplinary Studies | 0 | 0.0% |
| Science & Technology | 4 | 4.0% |
| Business | 17 | 16.8% |
| Education | 17 | 16.8% |
| Literature & Languages | 2 | 2.0% |
| Liberal Arts & History | 1 | 1.0% |
| Visual & Performing Arts | 0 | 0.0% |
| Communications | 1 | 1.0% |
| Arts & Humanities | 0 | 0.0% |
| Total | 101 | 100.0% |
Transportation & Commute in Makena
Vehicle Availability by Sex in Makena
The most prevalent vehicle ownership categories in Makena are males with 3 vehicles (26, accounting for 68.4%) and females with 3 vehicles (0, making up 433.3%).
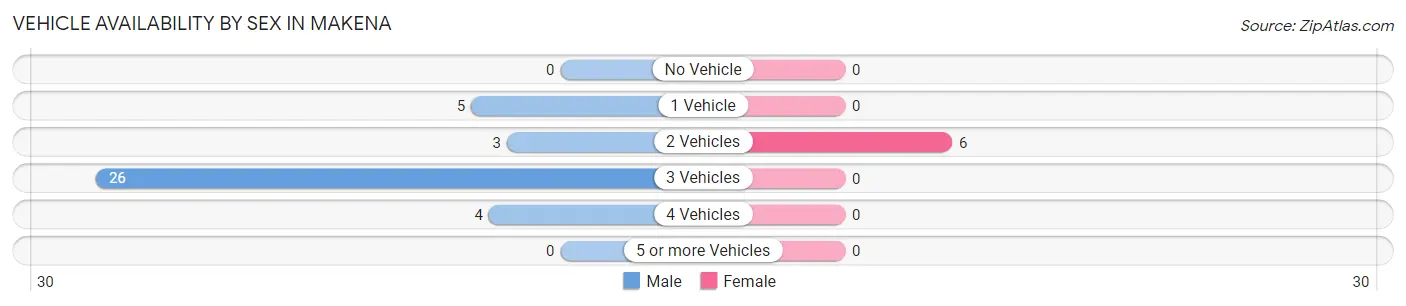
| Vehicles Available | Male | Female |
| No Vehicle | 0 (0.0%) | 0 (0.0%) |
| 1 Vehicle | 5 (13.2%) | 0 (0.0%) |
| 2 Vehicles | 3 (7.9%) | 6 (100.0%) |
| 3 Vehicles | 26 (68.4%) | 0 (0.0%) |
| 4 Vehicles | 4 (10.5%) | 0 (0.0%) |
| 5 or more Vehicles | 0 (0.0%) | 0 (0.0%) |
| Total | 38 (100.0%) | 6 (100.0%) |
Commute Time in Makena
The most frequently occuring commute durations in Makena are 5 to 9 minutes (19 commuters, 47.5%), 20 to 24 minutes (11 commuters, 27.5%), and 45 to 59 minutes (7 commuters, 17.5%).
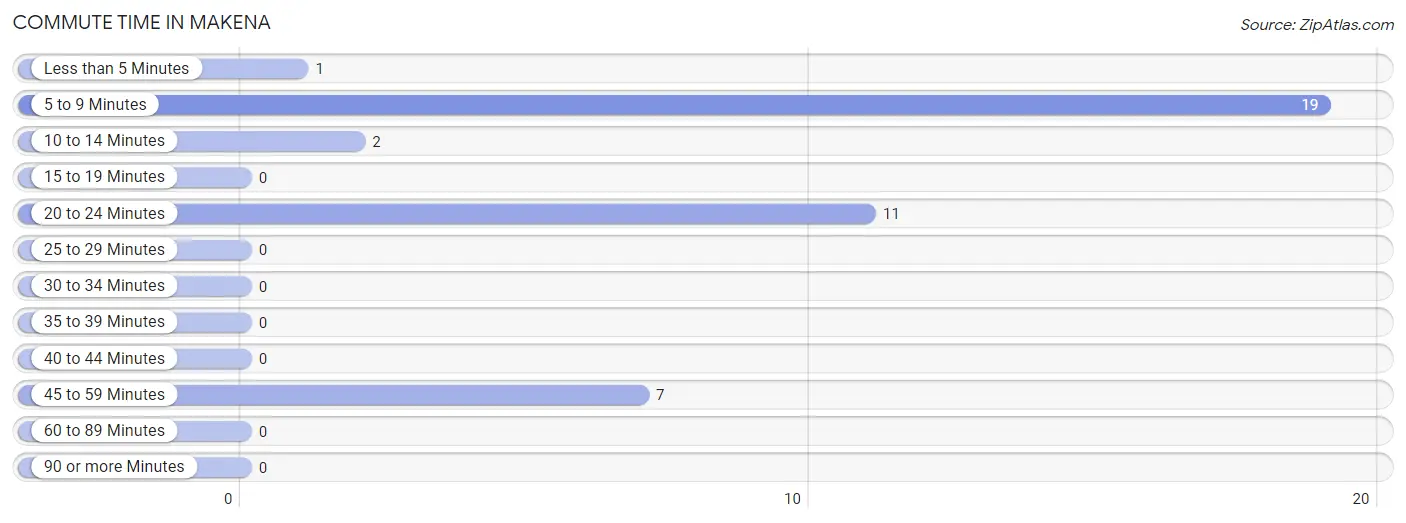
| Commute Time | # Commuters | % Commuters |
| Less than 5 Minutes | 1 | 2.5% |
| 5 to 9 Minutes | 19 | 47.5% |
| 10 to 14 Minutes | 2 | 5.0% |
| 15 to 19 Minutes | 0 | 0.0% |
| 20 to 24 Minutes | 11 | 27.5% |
| 25 to 29 Minutes | 0 | 0.0% |
| 30 to 34 Minutes | 0 | 0.0% |
| 35 to 39 Minutes | 0 | 0.0% |
| 40 to 44 Minutes | 0 | 0.0% |
| 45 to 59 Minutes | 7 | 17.5% |
| 60 to 89 Minutes | 0 | 0.0% |
| 90 or more Minutes | 0 | 0.0% |
Commute Time by Sex in Makena
The most common commute times in Makena are 5 to 9 minutes (19 commuters, 55.9%) for males and 45 to 59 minutes (6 commuters, 100.0%) for females.
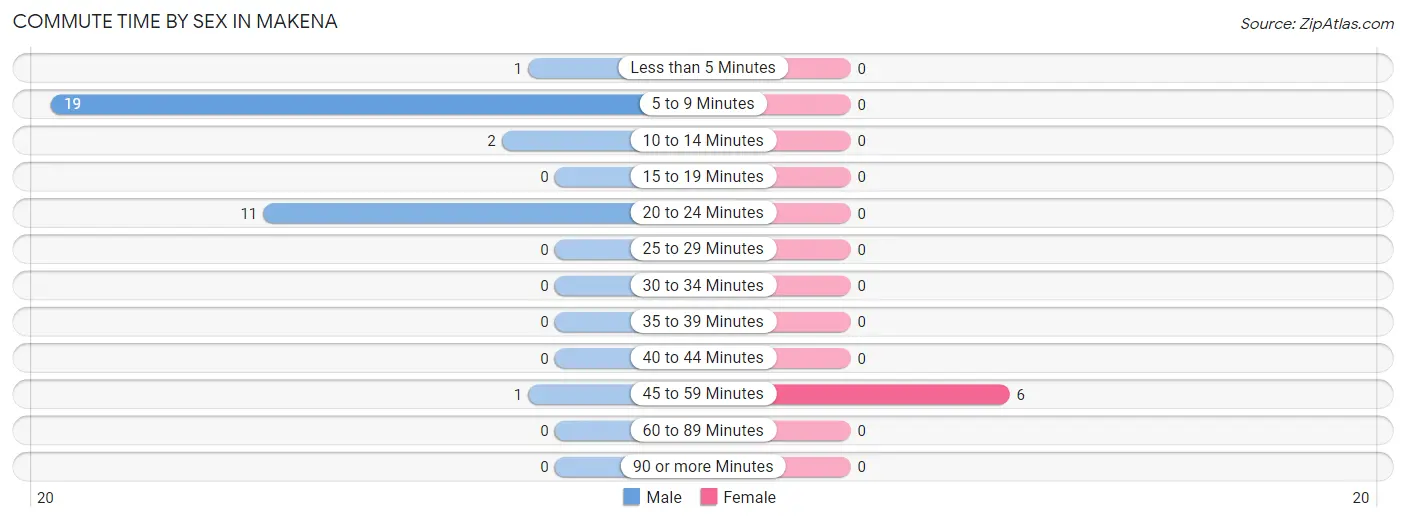
| Commute Time | Male | Female |
| Less than 5 Minutes | 1 (2.9%) | 0 (0.0%) |
| 5 to 9 Minutes | 19 (55.9%) | 0 (0.0%) |
| 10 to 14 Minutes | 2 (5.9%) | 0 (0.0%) |
| 15 to 19 Minutes | 0 (0.0%) | 0 (0.0%) |
| 20 to 24 Minutes | 11 (32.4%) | 0 (0.0%) |
| 25 to 29 Minutes | 0 (0.0%) | 0 (0.0%) |
| 30 to 34 Minutes | 0 (0.0%) | 0 (0.0%) |
| 35 to 39 Minutes | 0 (0.0%) | 0 (0.0%) |
| 40 to 44 Minutes | 0 (0.0%) | 0 (0.0%) |
| 45 to 59 Minutes | 1 (2.9%) | 6 (100.0%) |
| 60 to 89 Minutes | 0 (0.0%) | 0 (0.0%) |
| 90 or more Minutes | 0 (0.0%) | 0 (0.0%) |
Time of Departure to Work by Sex in Makena
The most frequent times of departure to work in Makena are 7:00 AM to 7:29 AM (16, 47.1%) for males and 7:00 AM to 7:29 AM (6, 100.0%) for females.
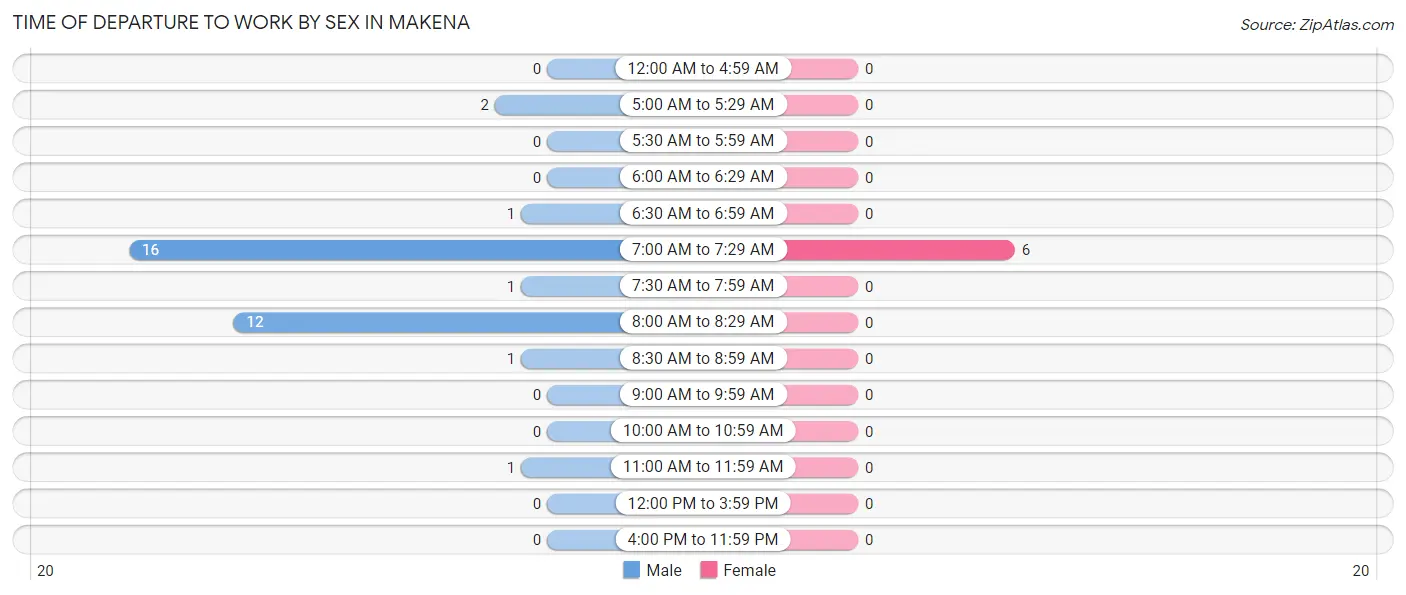
| Time of Departure | Male | Female |
| 12:00 AM to 4:59 AM | 0 (0.0%) | 0 (0.0%) |
| 5:00 AM to 5:29 AM | 2 (5.9%) | 0 (0.0%) |
| 5:30 AM to 5:59 AM | 0 (0.0%) | 0 (0.0%) |
| 6:00 AM to 6:29 AM | 0 (0.0%) | 0 (0.0%) |
| 6:30 AM to 6:59 AM | 1 (2.9%) | 0 (0.0%) |
| 7:00 AM to 7:29 AM | 16 (47.1%) | 6 (100.0%) |
| 7:30 AM to 7:59 AM | 1 (2.9%) | 0 (0.0%) |
| 8:00 AM to 8:29 AM | 12 (35.3%) | 0 (0.0%) |
| 8:30 AM to 8:59 AM | 1 (2.9%) | 0 (0.0%) |
| 9:00 AM to 9:59 AM | 0 (0.0%) | 0 (0.0%) |
| 10:00 AM to 10:59 AM | 0 (0.0%) | 0 (0.0%) |
| 11:00 AM to 11:59 AM | 1 (2.9%) | 0 (0.0%) |
| 12:00 PM to 3:59 PM | 0 (0.0%) | 0 (0.0%) |
| 4:00 PM to 11:59 PM | 0 (0.0%) | 0 (0.0%) |
| Total | 34 (100.0%) | 6 (100.0%) |
Housing Occupancy in Makena
Occupancy by Ownership in Makena
Of the total 76 dwellings in Makena, owner-occupied units account for 75 (98.7%), while renter-occupied units make up 1 (1.3%).
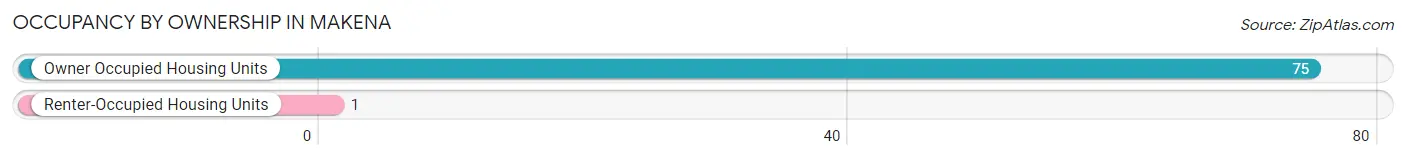
| Occupancy | # Housing Units | % Housing Units |
| Owner Occupied Housing Units | 75 | 98.7% |
| Renter-Occupied Housing Units | 1 | 1.3% |
| Total Occupied Housing Units | 76 | 100.0% |
Occupancy by Household Size in Makena
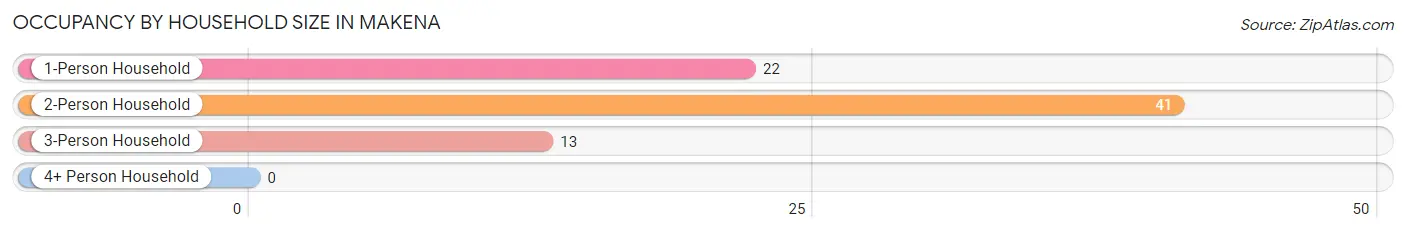
| Household Size | # Housing Units | % Housing Units |
| 1-Person Household | 22 | 28.9% |
| 2-Person Household | 41 | 53.9% |
| 3-Person Household | 13 | 17.1% |
| 4+ Person Household | 0 | 0.0% |
| Total Housing Units | 76 | 100.0% |
Occupancy by Ownership by Household Size in Makena
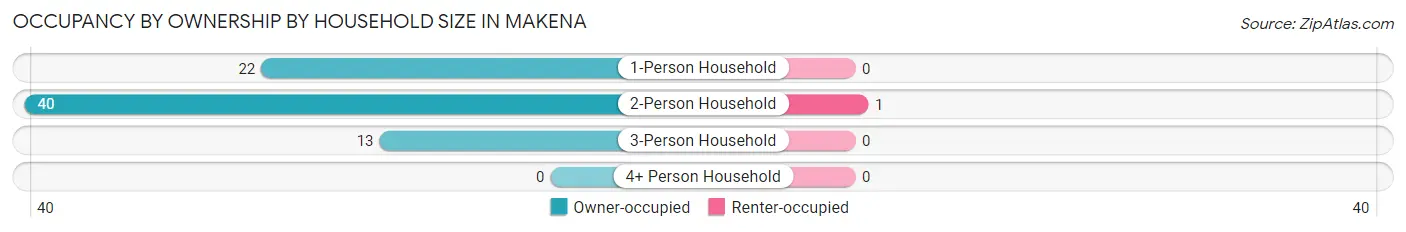
| Household Size | Owner-occupied | Renter-occupied |
| 1-Person Household | 22 (100.0%) | 0 (0.0%) |
| 2-Person Household | 40 (97.6%) | 1 (2.4%) |
| 3-Person Household | 13 (100.0%) | 0 (0.0%) |
| 4+ Person Household | 0 (0.0%) | 0 (0.0%) |
| Total Housing Units | 75 (98.7%) | 1 (1.3%) |
Occupancy by Educational Attainment in Makena
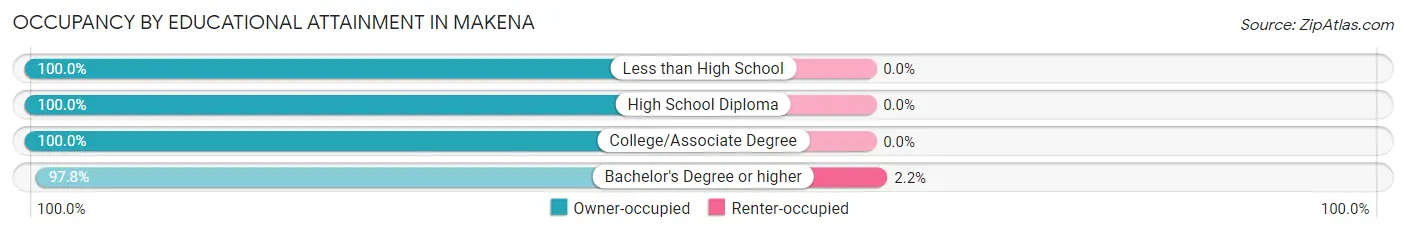
| Household Size | Owner-occupied | Renter-occupied |
| Less than High School | 2 (100.0%) | 0 (0.0%) |
| High School Diploma | 9 (100.0%) | 0 (0.0%) |
| College/Associate Degree | 20 (100.0%) | 0 (0.0%) |
| Bachelor's Degree or higher | 44 (97.8%) | 1 (2.2%) |
Occupancy by Age of Householder in Makena
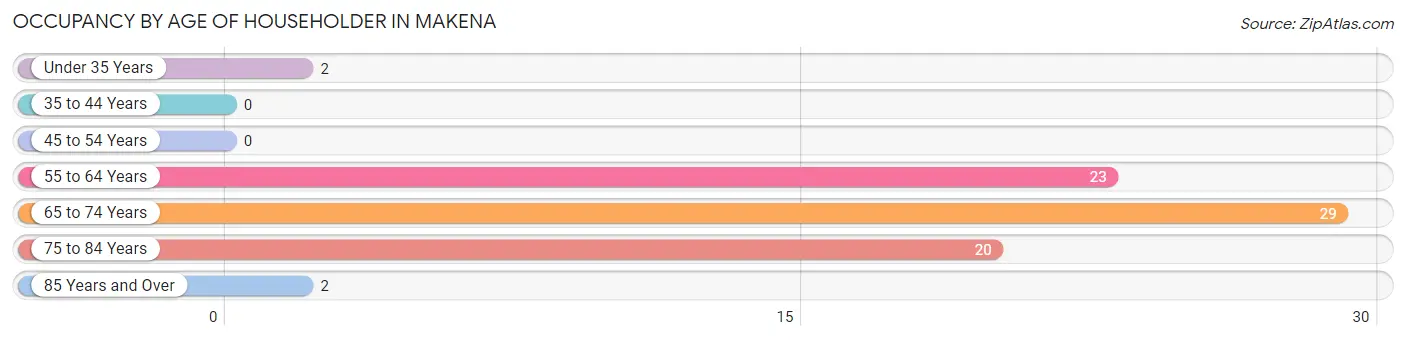
| Age Bracket | # Households | % Households |
| Under 35 Years | 2 | 2.6% |
| 35 to 44 Years | 0 | 0.0% |
| 45 to 54 Years | 0 | 0.0% |
| 55 to 64 Years | 23 | 30.3% |
| 65 to 74 Years | 29 | 38.2% |
| 75 to 84 Years | 20 | 26.3% |
| 85 Years and Over | 2 | 2.6% |
| Total | 76 | 100.0% |
Housing Finances in Makena
Median Income by Occupancy in Makena
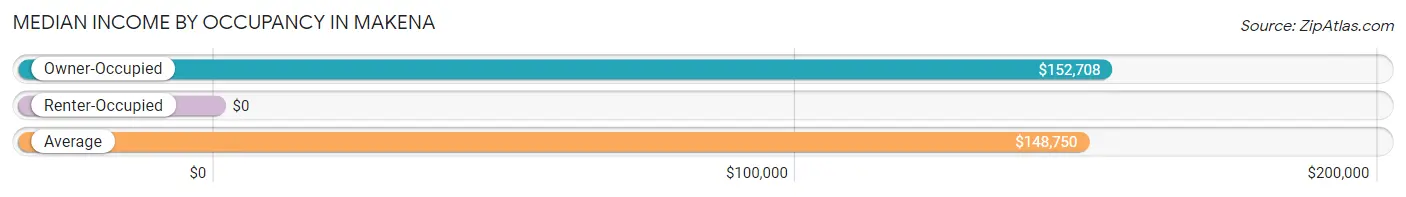
| Occupancy Type | # Households | Median Income |
| Owner-Occupied | 75 (98.7%) | $152,708 |
| Renter-Occupied | 1 (1.3%) | $0 |
| Average | 76 (100.0%) | $148,750 |
Occupancy by Householder Income Bracket in Makena
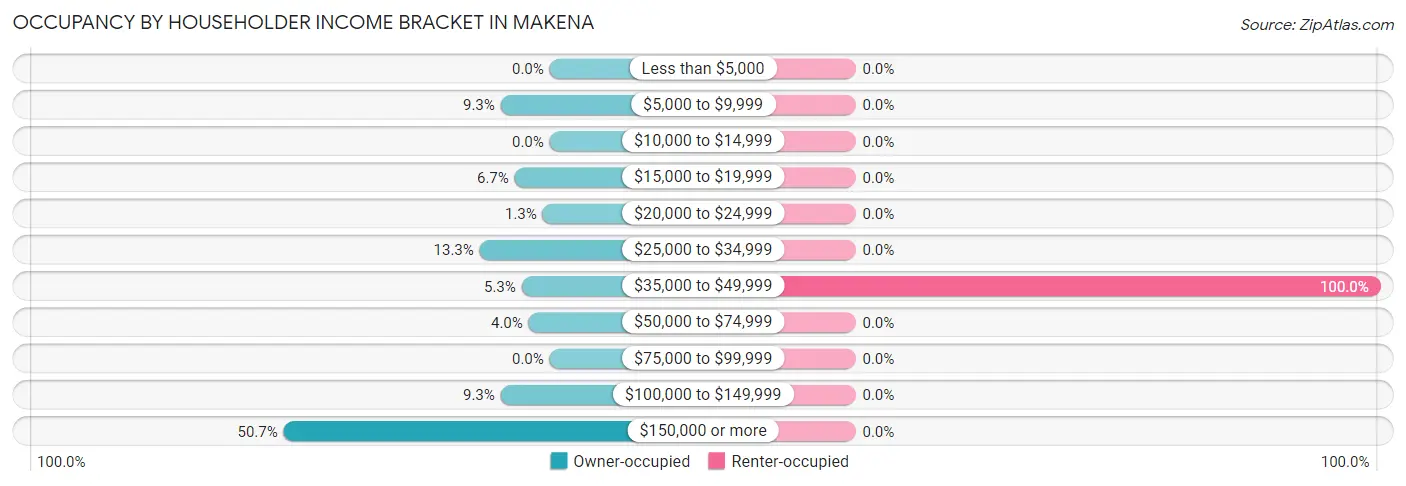
| Income Bracket | Owner-occupied | Renter-occupied |
| Less than $5,000 | 0 (0.0%) | 0 (0.0%) |
| $5,000 to $9,999 | 7 (9.3%) | 0 (0.0%) |
| $10,000 to $14,999 | 0 (0.0%) | 0 (0.0%) |
| $15,000 to $19,999 | 5 (6.7%) | 0 (0.0%) |
| $20,000 to $24,999 | 1 (1.3%) | 0 (0.0%) |
| $25,000 to $34,999 | 10 (13.3%) | 0 (0.0%) |
| $35,000 to $49,999 | 4 (5.3%) | 1 (100.0%) |
| $50,000 to $74,999 | 3 (4.0%) | 0 (0.0%) |
| $75,000 to $99,999 | 0 (0.0%) | 0 (0.0%) |
| $100,000 to $149,999 | 7 (9.3%) | 0 (0.0%) |
| $150,000 or more | 38 (50.7%) | 0 (0.0%) |
| Total | 75 (100.0%) | 1 (100.0%) |
Monthly Housing Cost Tiers in Makena
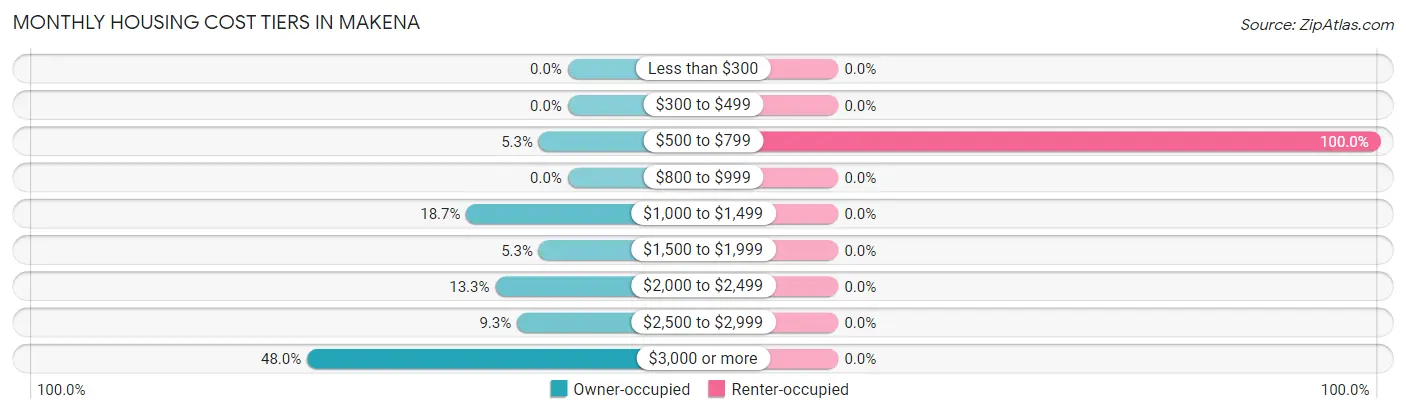
| Monthly Cost | Owner-occupied | Renter-occupied |
| Less than $300 | 0 (0.0%) | 0 (0.0%) |
| $300 to $499 | 0 (0.0%) | 0 (0.0%) |
| $500 to $799 | 4 (5.3%) | 1 (100.0%) |
| $800 to $999 | 0 (0.0%) | 0 (0.0%) |
| $1,000 to $1,499 | 14 (18.7%) | 0 (0.0%) |
| $1,500 to $1,999 | 4 (5.3%) | 0 (0.0%) |
| $2,000 to $2,499 | 10 (13.3%) | 0 (0.0%) |
| $2,500 to $2,999 | 7 (9.3%) | 0 (0.0%) |
| $3,000 or more | 36 (48.0%) | 0 (0.0%) |
| Total | 75 (100.0%) | 1 (100.0%) |
Physical Housing Characteristics in Makena
Housing Structures in Makena
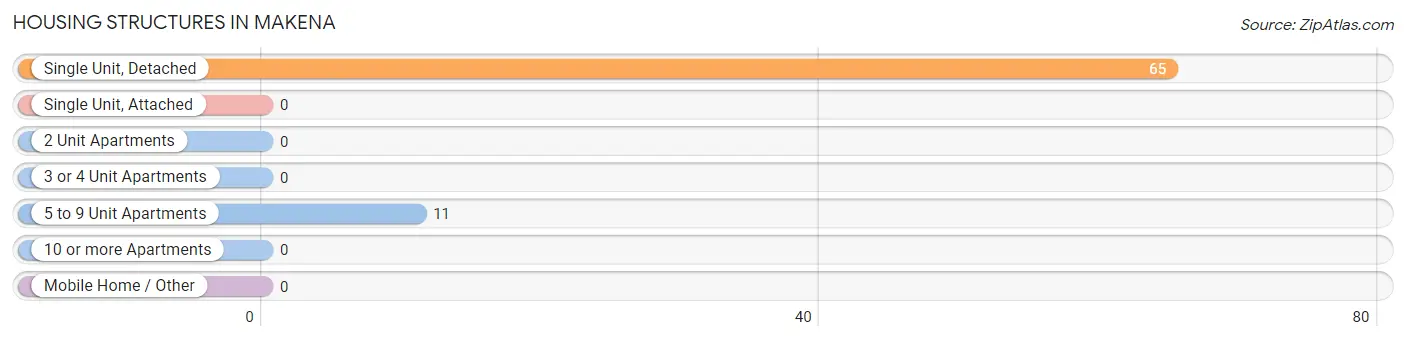
| Structure Type | # Housing Units | % Housing Units |
| Single Unit, Detached | 65 | 85.5% |
| Single Unit, Attached | 0 | 0.0% |
| 2 Unit Apartments | 0 | 0.0% |
| 3 or 4 Unit Apartments | 0 | 0.0% |
| 5 to 9 Unit Apartments | 11 | 14.5% |
| 10 or more Apartments | 0 | 0.0% |
| Mobile Home / Other | 0 | 0.0% |
| Total | 76 | 100.0% |
Housing Structures by Occupancy in Makena
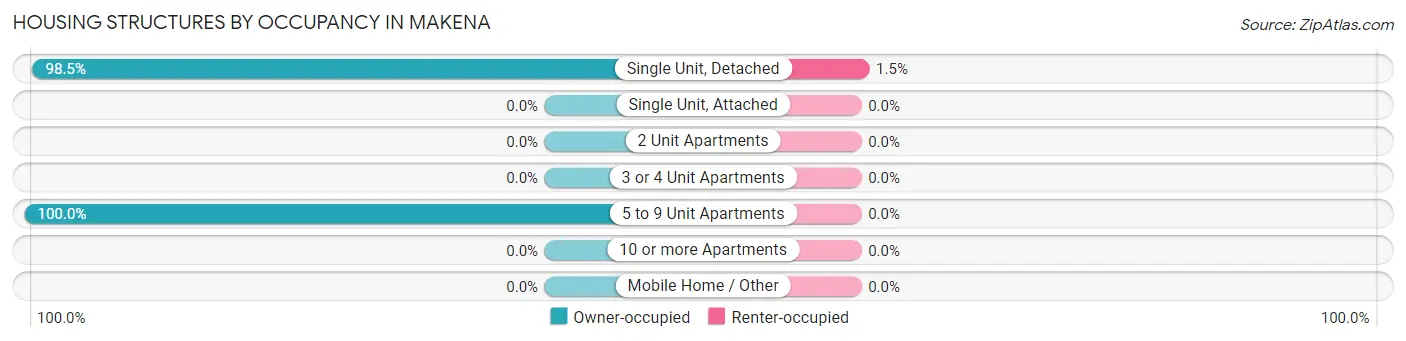
| Structure Type | Owner-occupied | Renter-occupied |
| Single Unit, Detached | 64 (98.5%) | 1 (1.5%) |
| Single Unit, Attached | 0 (0.0%) | 0 (0.0%) |
| 2 Unit Apartments | 0 (0.0%) | 0 (0.0%) |
| 3 or 4 Unit Apartments | 0 (0.0%) | 0 (0.0%) |
| 5 to 9 Unit Apartments | 11 (100.0%) | 0 (0.0%) |
| 10 or more Apartments | 0 (0.0%) | 0 (0.0%) |
| Mobile Home / Other | 0 (0.0%) | 0 (0.0%) |
| Total | 75 (98.7%) | 1 (1.3%) |
Housing Structures by Number of Rooms in Makena
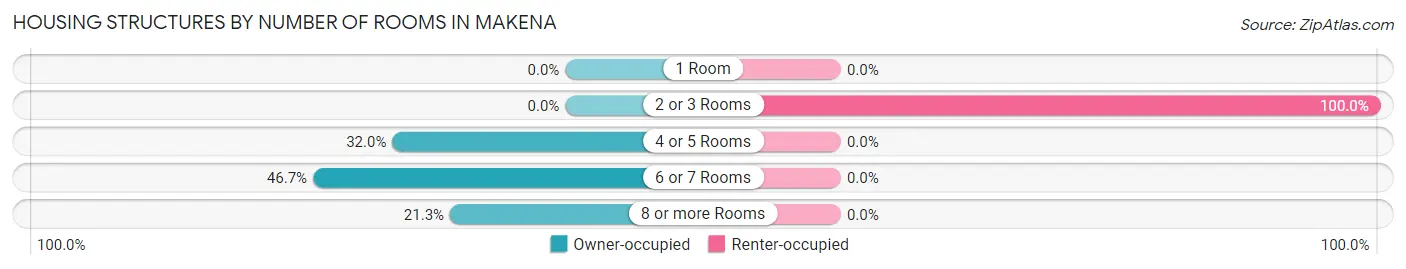
| Number of Rooms | Owner-occupied | Renter-occupied |
| 1 Room | 0 (0.0%) | 0 (0.0%) |
| 2 or 3 Rooms | 0 (0.0%) | 1 (100.0%) |
| 4 or 5 Rooms | 24 (32.0%) | 0 (0.0%) |
| 6 or 7 Rooms | 35 (46.7%) | 0 (0.0%) |
| 8 or more Rooms | 16 (21.3%) | 0 (0.0%) |
| Total | 75 (100.0%) | 1 (100.0%) |
Housing Structure by Heating Type in Makena
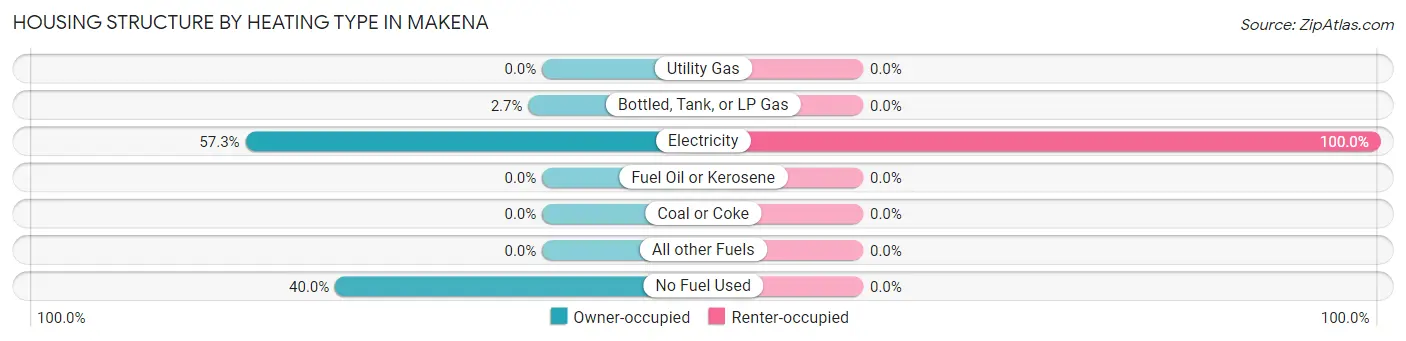
| Heating Type | Owner-occupied | Renter-occupied |
| Utility Gas | 0 (0.0%) | 0 (0.0%) |
| Bottled, Tank, or LP Gas | 2 (2.7%) | 0 (0.0%) |
| Electricity | 43 (57.3%) | 1 (100.0%) |
| Fuel Oil or Kerosene | 0 (0.0%) | 0 (0.0%) |
| Coal or Coke | 0 (0.0%) | 0 (0.0%) |
| All other Fuels | 0 (0.0%) | 0 (0.0%) |
| No Fuel Used | 30 (40.0%) | 0 (0.0%) |
| Total | 75 (100.0%) | 1 (100.0%) |
Household Vehicle Usage in Makena
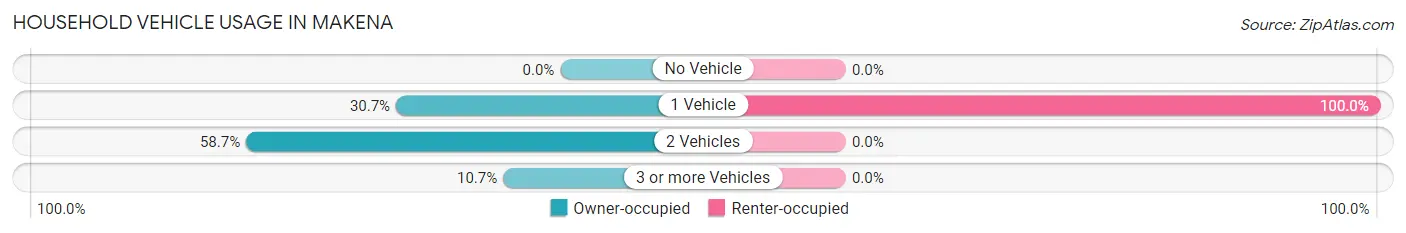
| Vehicles per Household | Owner-occupied | Renter-occupied |
| No Vehicle | 0 (0.0%) | 0 (0.0%) |
| 1 Vehicle | 23 (30.7%) | 1 (100.0%) |
| 2 Vehicles | 44 (58.7%) | 0 (0.0%) |
| 3 or more Vehicles | 8 (10.7%) | 0 (0.0%) |
| Total | 75 (100.0%) | 1 (100.0%) |
Real Estate & Mortgages in Makena
Real Estate and Mortgage Overview in Makena
| Characteristic | Without Mortgage | With Mortgage |
| Housing Units | 37 | 38 |
| Median Property Value | $2,000,001 | $1,975,000 |
| Median Household Income | $152,708 | $19 |
| Monthly Housing Costs | $1,501 | $32 |
| Real Estate Taxes | $7,375 | $0 |
Property Value by Mortgage Status in Makena
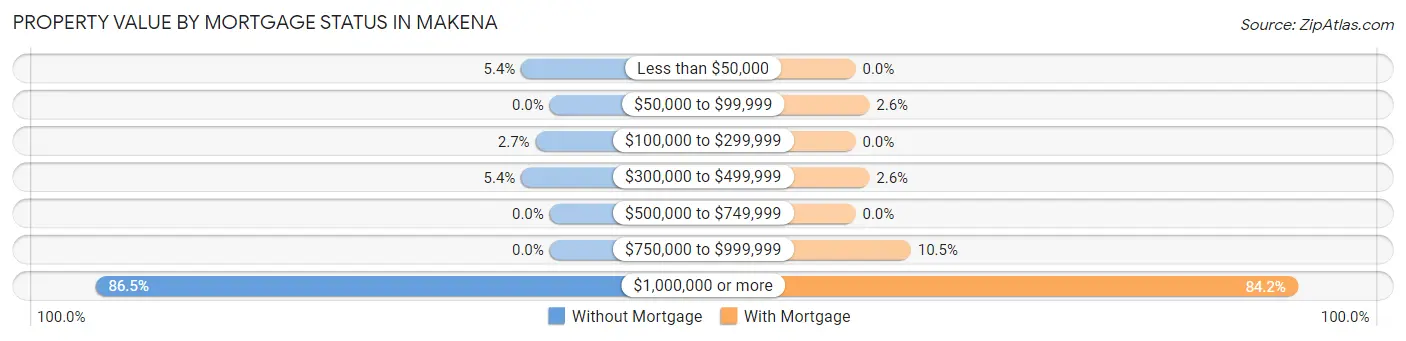
| Property Value | Without Mortgage | With Mortgage |
| Less than $50,000 | 2 (5.4%) | 0 (0.0%) |
| $50,000 to $99,999 | 0 (0.0%) | 1 (2.6%) |
| $100,000 to $299,999 | 1 (2.7%) | 0 (0.0%) |
| $300,000 to $499,999 | 2 (5.4%) | 1 (2.6%) |
| $500,000 to $749,999 | 0 (0.0%) | 0 (0.0%) |
| $750,000 to $999,999 | 0 (0.0%) | 4 (10.5%) |
| $1,000,000 or more | 32 (86.5%) | 32 (84.2%) |
| Total | 37 (100.0%) | 38 (100.0%) |
Household Income by Mortgage Status in Makena
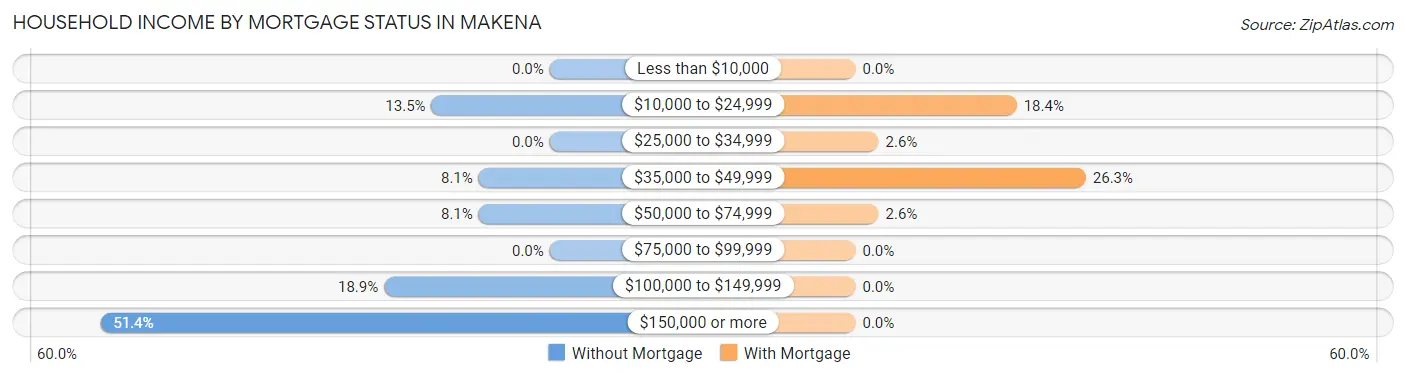
| Household Income | Without Mortgage | With Mortgage |
| Less than $10,000 | 0 (0.0%) | 0 (0.0%) |
| $10,000 to $24,999 | 5 (13.5%) | 7 (18.4%) |
| $25,000 to $34,999 | 0 (0.0%) | 1 (2.6%) |
| $35,000 to $49,999 | 3 (8.1%) | 10 (26.3%) |
| $50,000 to $74,999 | 3 (8.1%) | 1 (2.6%) |
| $75,000 to $99,999 | 0 (0.0%) | 0 (0.0%) |
| $100,000 to $149,999 | 7 (18.9%) | 0 (0.0%) |
| $150,000 or more | 19 (51.3%) | 0 (0.0%) |
| Total | 37 (100.0%) | 38 (100.0%) |
Property Value to Household Income Ratio in Makena
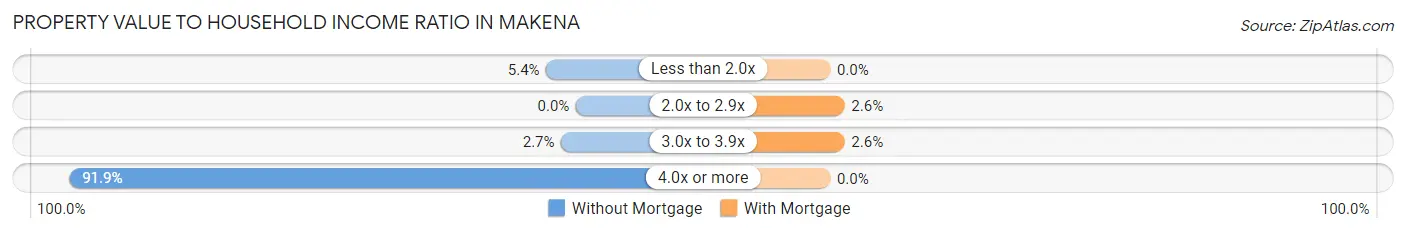
| Value-to-Income Ratio | Without Mortgage | With Mortgage |
| Less than 2.0x | 2 (5.4%) | 0 (0.0%) |
| 2.0x to 2.9x | 0 (0.0%) | 1 (2.6%) |
| 3.0x to 3.9x | 1 (2.7%) | 1 (2.6%) |
| 4.0x or more | 34 (91.9%) | 0 (0.0%) |
| Total | 37 (100.0%) | 38 (100.0%) |
Real Estate Taxes by Mortgage Status in Makena
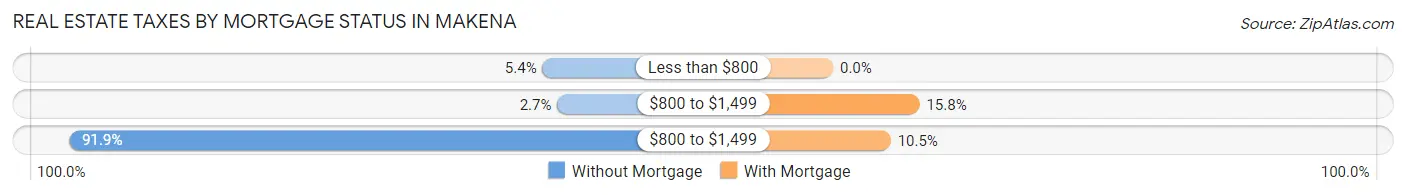
| Property Taxes | Without Mortgage | With Mortgage |
| Less than $800 | 2 (5.4%) | 0 (0.0%) |
| $800 to $1,499 | 1 (2.7%) | 6 (15.8%) |
| $800 to $1,499 | 34 (91.9%) | 4 (10.5%) |
| Total | 37 (100.0%) | 38 (100.0%) |
Health & Disability in Makena
Health Insurance Coverage by Age in Makena
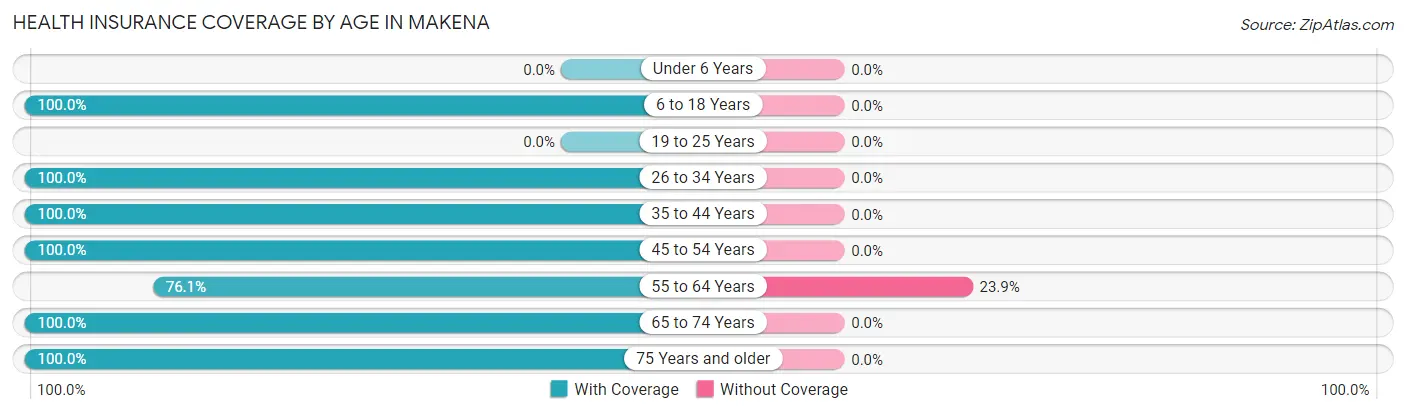
| Age Bracket | With Coverage | Without Coverage |
| Under 6 Years | 0 (0.0%) | 0 (0.0%) |
| 6 to 18 Years | 8 (100.0%) | 0 (0.0%) |
| 19 to 25 Years | 0 (0.0%) | 0 (0.0%) |
| 26 to 34 Years | 3 (100.0%) | 0 (0.0%) |
| 35 to 44 Years | 2 (100.0%) | 0 (0.0%) |
| 45 to 54 Years | 19 (100.0%) | 0 (0.0%) |
| 55 to 64 Years | 35 (76.1%) | 11 (23.9%) |
| 65 to 74 Years | 57 (100.0%) | 0 (0.0%) |
| 75 Years and older | 23 (100.0%) | 0 (0.0%) |
| Total | 147 (93.0%) | 11 (7.0%) |
Health Insurance Coverage by Citizenship Status in Makena
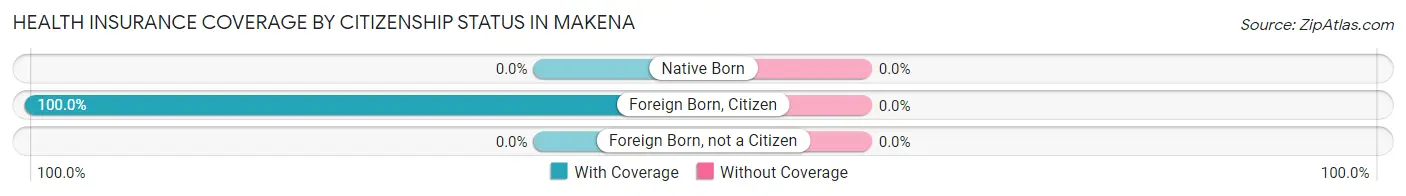
| Citizenship Status | With Coverage | Without Coverage |
| Native Born | 0 (0.0%) | 0 (0.0%) |
| Foreign Born, Citizen | 8 (100.0%) | 0 (0.0%) |
| Foreign Born, not a Citizen | 0 (0.0%) | 0 (0.0%) |
Health Insurance Coverage by Household Income in Makena
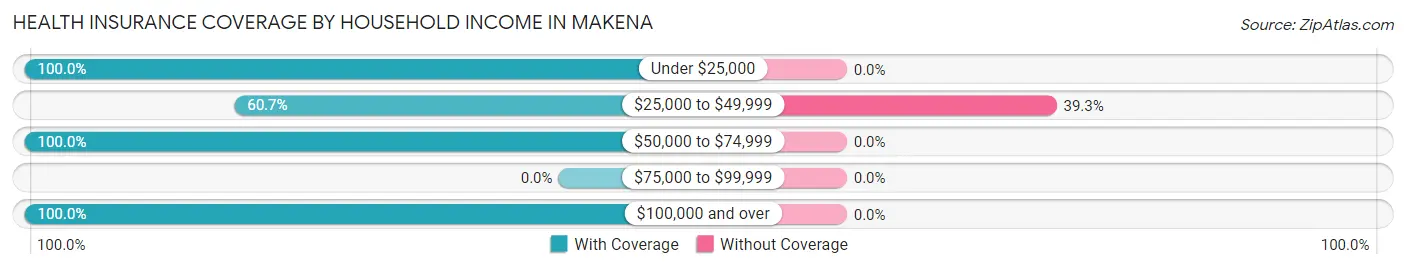
| Household Income | With Coverage | Without Coverage |
| Under $25,000 | 18 (100.0%) | 0 (0.0%) |
| $25,000 to $49,999 | 17 (60.7%) | 11 (39.3%) |
| $50,000 to $74,999 | 7 (100.0%) | 0 (0.0%) |
| $75,000 to $99,999 | 0 (0.0%) | 0 (0.0%) |
| $100,000 and over | 105 (100.0%) | 0 (0.0%) |
Public vs Private Health Insurance Coverage by Age in Makena
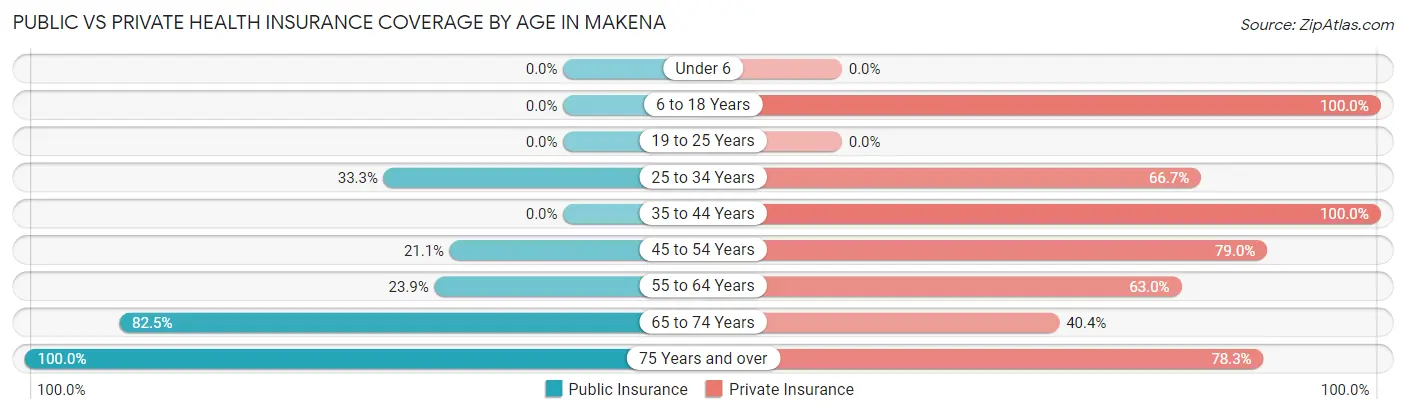
| Age Bracket | Public Insurance | Private Insurance |
| Under 6 | 0 (0.0%) | 0 (0.0%) |
| 6 to 18 Years | 0 (0.0%) | 8 (100.0%) |
| 19 to 25 Years | 0 (0.0%) | 0 (0.0%) |
| 25 to 34 Years | 1 (33.3%) | 2 (66.7%) |
| 35 to 44 Years | 0 (0.0%) | 2 (100.0%) |
| 45 to 54 Years | 4 (21.0%) | 15 (78.9%) |
| 55 to 64 Years | 11 (23.9%) | 29 (63.0%) |
| 65 to 74 Years | 47 (82.5%) | 23 (40.4%) |
| 75 Years and over | 23 (100.0%) | 18 (78.3%) |
| Total | 86 (54.4%) | 97 (61.4%) |
Disability Status by Sex by Age in Makena
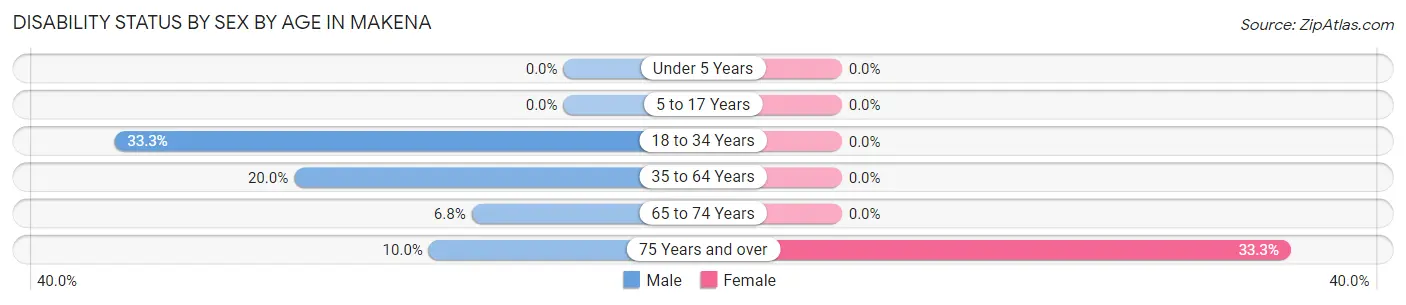
| Age Bracket | Male | Female |
| Under 5 Years | 0 (0.0%) | 0 (0.0%) |
| 5 to 17 Years | 0 (0.0%) | 0 (0.0%) |
| 18 to 34 Years | 1 (33.3%) | 0 (0.0%) |
| 35 to 64 Years | 5 (20.0%) | 0 (0.0%) |
| 65 to 74 Years | 3 (6.8%) | 0 (0.0%) |
| 75 Years and over | 2 (10.0%) | 1 (33.3%) |
Disability Class by Sex by Age in Makena
Disability Class: Hearing Difficulty
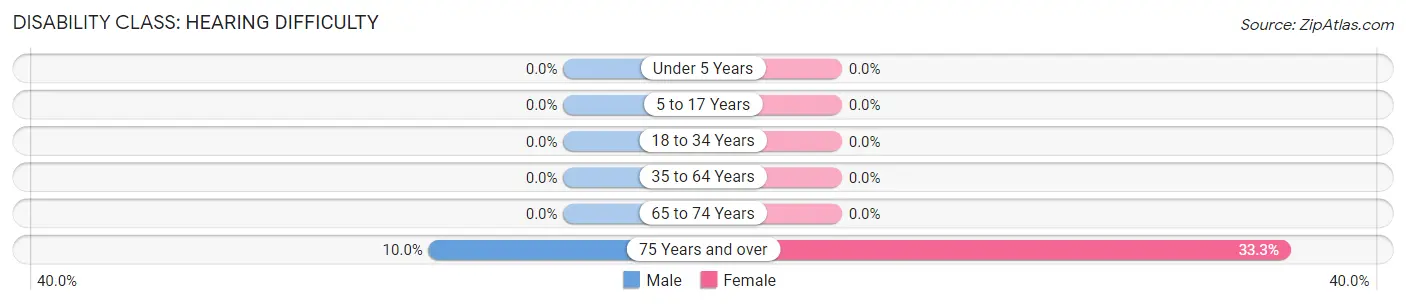
| Age Bracket | Male | Female |
| Under 5 Years | 0 (0.0%) | 0 (0.0%) |
| 5 to 17 Years | 0 (0.0%) | 0 (0.0%) |
| 18 to 34 Years | 0 (0.0%) | 0 (0.0%) |
| 35 to 64 Years | 0 (0.0%) | 0 (0.0%) |
| 65 to 74 Years | 0 (0.0%) | 0 (0.0%) |
| 75 Years and over | 2 (10.0%) | 1 (33.3%) |
Disability Class: Vision Difficulty
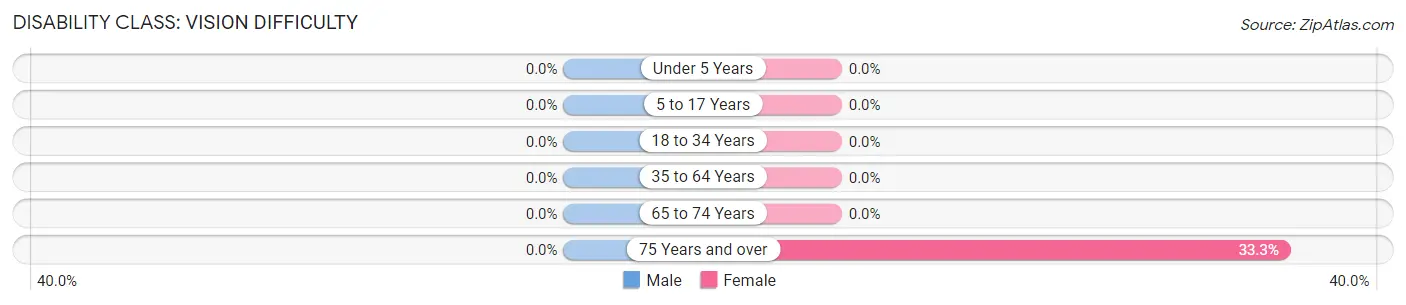
| Age Bracket | Male | Female |
| Under 5 Years | 0 (0.0%) | 0 (0.0%) |
| 5 to 17 Years | 0 (0.0%) | 0 (0.0%) |
| 18 to 34 Years | 0 (0.0%) | 0 (0.0%) |
| 35 to 64 Years | 0 (0.0%) | 0 (0.0%) |
| 65 to 74 Years | 0 (0.0%) | 0 (0.0%) |
| 75 Years and over | 0 (0.0%) | 1 (33.3%) |
Disability Class: Cognitive Difficulty
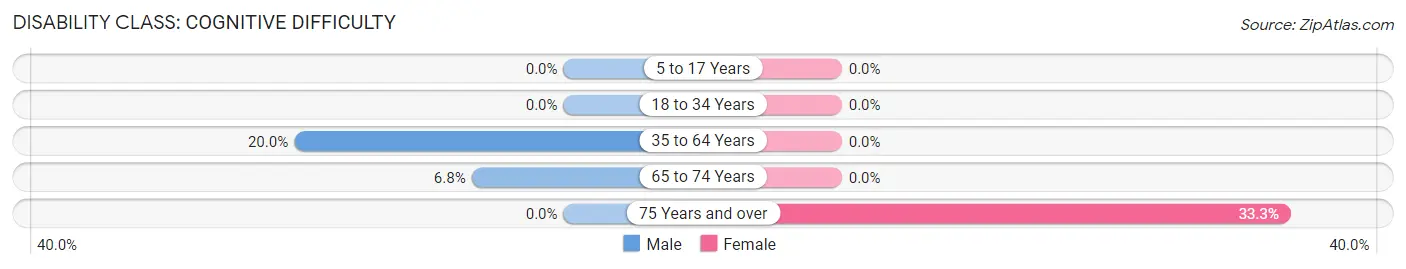
| Age Bracket | Male | Female |
| 5 to 17 Years | 0 (0.0%) | 0 (0.0%) |
| 18 to 34 Years | 0 (0.0%) | 0 (0.0%) |
| 35 to 64 Years | 5 (20.0%) | 0 (0.0%) |
| 65 to 74 Years | 3 (6.8%) | 0 (0.0%) |
| 75 Years and over | 0 (0.0%) | 1 (33.3%) |
Disability Class: Ambulatory Difficulty
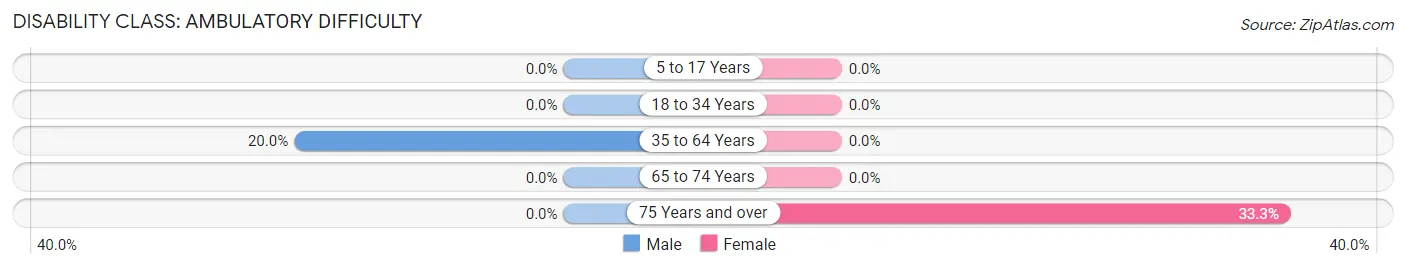
| Age Bracket | Male | Female |
| 5 to 17 Years | 0 (0.0%) | 0 (0.0%) |
| 18 to 34 Years | 0 (0.0%) | 0 (0.0%) |
| 35 to 64 Years | 5 (20.0%) | 0 (0.0%) |
| 65 to 74 Years | 0 (0.0%) | 0 (0.0%) |
| 75 Years and over | 0 (0.0%) | 1 (33.3%) |
Disability Class: Self-Care Difficulty

| Age Bracket | Male | Female |
| 5 to 17 Years | 0 (0.0%) | 0 (0.0%) |
| 18 to 34 Years | 0 (0.0%) | 0 (0.0%) |
| 35 to 64 Years | 5 (20.0%) | 0 (0.0%) |
| 65 to 74 Years | 0 (0.0%) | 0 (0.0%) |
| 75 Years and over | 0 (0.0%) | 1 (33.3%) |
Technology Access in Makena
Computing Device Access in Makena
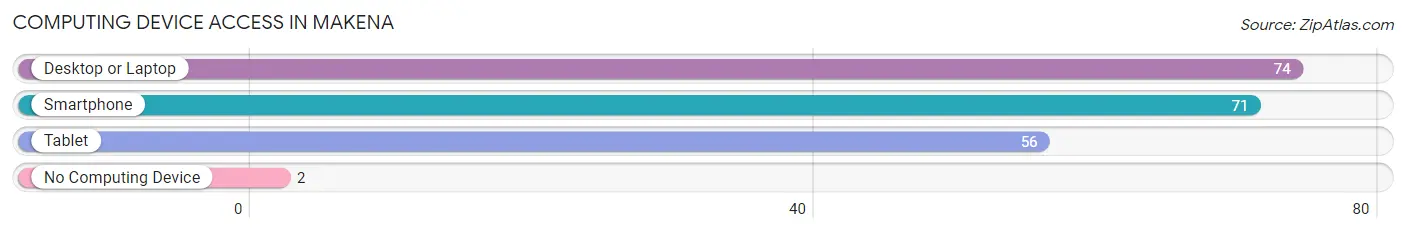
| Device Type | # Households | % Households |
| Desktop or Laptop | 74 | 97.4% |
| Smartphone | 71 | 93.4% |
| Tablet | 56 | 73.7% |
| No Computing Device | 2 | 2.6% |
| Total | 76 | 100.0% |
Internet Access in Makena
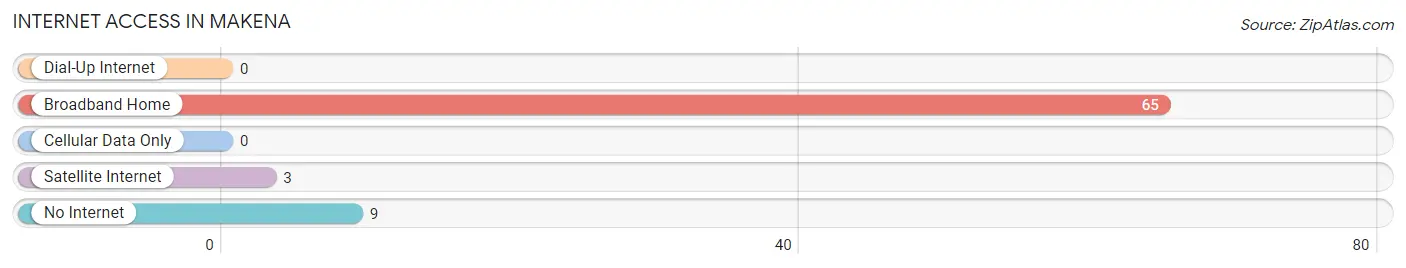
| Internet Type | # Households | % Households |
| Dial-Up Internet | 0 | 0.0% |
| Broadband Home | 65 | 85.5% |
| Cellular Data Only | 0 | 0.0% |
| Satellite Internet | 3 | 4.0% |
| No Internet | 9 | 11.8% |
| Total | 76 | 100.0% |
Makena Summary
Makena is a small unincorporated community located on the island of Maui in the state of Hawaii. It is located on the south shore of the island, just south of Wailea and Kihei. The area is known for its beautiful beaches, lush tropical vegetation, and stunning views of the Pacific Ocean.
History
Makena has a long and rich history. The area was first settled by Polynesian voyagers in the late 1700s. These settlers were drawn to the area for its abundant resources, including fish, fruit, and other food sources. The area was also home to a large population of Hawaiian royalty, who built a number of heiau (temples) in the area.
In the early 1800s, Makena was a popular destination for whalers and traders. The area was also home to a number of sugar plantations, which were established in the mid-1800s. These plantations brought a large influx of immigrants to the area, including Chinese, Japanese, Portuguese, and Filipino workers.
In the late 1800s, Makena was a popular destination for wealthy visitors from the mainland United States. The area was home to a number of luxurious resorts, including the Makena Beach Hotel, which was built in 1891.
Geography
Makena is located on the south shore of Maui, just south of Wailea and Kihei. The area is known for its beautiful beaches, lush tropical vegetation, and stunning views of the Pacific Ocean. The area is also home to a number of small coves and bays, which are popular for swimming, snorkeling, and other water activities.
The area is also home to a number of small islands, including Molokini, which is a popular destination for snorkeling and diving. The area is also home to a number of small islets, including Kaho‘olawe, which is a protected wildlife refuge.
Economy
Makena is primarily a tourist destination, and the area is home to a number of resorts, hotels, and other tourist attractions. The area is also home to a number of small businesses, including restaurants, shops, and other services.
The area is also home to a number of agricultural operations, including cattle ranches, fruit orchards, and other farms. The area is also home to a number of small fishing operations, which provide fresh seafood to local restaurants and markets.
Demographics
As of the 2010 census, the population of Makena was 1,845. The population is primarily of Native Hawaiian and other Pacific Islander descent. The area is also home to a number of immigrants from other parts of the world, including the United States, Japan, China, and the Philippines.
The median household income in Makena is $63,917, and the median home value is $717,000. The area is also home to a number of affluent residents, including a number of celebrities and other high-profile individuals.
Conclusion
Makena is a small unincorporated community located on the island of Maui in the state of Hawaii. The area is known for its beautiful beaches, lush tropical vegetation, and stunning views of the Pacific Ocean. The area is also home to a number of resorts, hotels, and other tourist attractions, as well as a number of small businesses, agricultural operations, and fishing operations. The population of Makena is primarily of Native Hawaiian and other Pacific Islander descent, and the area is also home to a number of immigrants from other parts of the world. The median household income in Makena is $63,917, and the median home value is $717,000.
Common Questions
What is Per Capita Income in Makena?
Per Capita income in Makena is $152,719.
What is the Median Family Income in Makena?
Median Family Income in Makena is $171,042.
What is the Median Household income in Makena?
Median Household Income in Makena is $148,750.
What is Inequality or Gini Index in Makena?
Inequality or Gini Index in Makena is 0.62.
What is the Total Population of Makena?
Total Population of Makena is 158.
What is the Total Male Population of Makena?
Total Male Population of Makena is 92.
What is the Total Female Population of Makena?
Total Female Population of Makena is 66.
What is the Ratio of Males per 100 Females in Makena?
There are 139.39 Males per 100 Females in Makena.
What is the Ratio of Females per 100 Males in Makena?
There are 71.74 Females per 100 Males in Makena.
What is the Median Population Age in Makena?
Median Population Age in Makena is 65.1 Years.
What is the Average Family Size in Makena
Average Family Size in Makena is 2.3 People.
What is the Average Household Size in Makena
Average Household Size in Makena is 2.1 People.
How Large is the Labor Force in Makena?
There are 46 People in the Labor Forcein in Makena.
What is the Percentage of People in the Labor Force in Makena?
30.7% of People are in the Labor Force in Makena.
What is the Unemployment Rate in Makena?
Unemployment Rate in Makena is 4.3%.