Zip Codes with the Highest Percentage of Population with a Degree in Social Sciences in Anchorage, AK

RELATED REPORTS & OPTIONS

Social Sciences
Population
Families and Households
Female Fertility
Female Fertility (Unmarried)
Race (Community Size)
Race (Percentage)
Ancestry (Community Size)
AfricanAlaska NativeAlaskan AthabascanAlbanianAleutAmericanApacheArabArapahoArgentineanArmenianAustralianAustrianBangladeshiBelgianBhutaneseBlackfeetBrazilianBritishBulgarianBurmeseCajunCanadianCelticCentral AmericanCentral American IndianCherokeeChickasawChippewaChoctawColombianComancheCosta RicanCreekCroatianCrowCubanCzechCzechoslovakianDanishDelawareDominicanDutchEastern EuropeanEcuadorianEgyptianEnglishEstonianEuropeanFilipinoFinnishFrenchFrench American IndianFrench CanadianGermanGerman RussianGreekGuamanian / ChamorroGuatemalanGuyaneseHaitianHonduranHungarianIcelanderIndian (Asian)InupiatIranianIrishIroquoisItalianJamaicanJapaneseKoreanLaotianLatvianLebaneseLiberianLithuanianLumbeeMacedonianMalaysianMarshalleseMenomineeMexicanMexican American IndianMongolianNative HawaiianNavajoNepaleseNew ZealanderNicaraguanNigerianNorthern EuropeanNorwegianOsagePakistaniPanamanianPeruvianPolishPortuguesePotawatomiPuebloPuerto RicanRomanianRussianSalvadoranSamoanScandinavianScotch-IrishScottishSeminoleSerbianShoshoneSiouxSlavicSlovakSloveneSomaliSouth AfricanSouth AmericanSouth American IndianSpaniardSpanishSri LankanSubsaharan AfricanSudaneseSwedishSwissThaiTlingit-HaidaTonganTrinidadian and TobagonianTsimshianTurkishUkrainianVenezuelanWelshYugoslavianYup'ik
Ancestry (Percentage)
AfricanAlaska NativeAlaskan AthabascanAlbanianAleutAmericanApacheArabArapahoArgentineanArmenianAustralianAustrianBangladeshiBelgianBhutaneseBlackfeetBrazilianBritishBulgarianBurmeseCajunCanadianCelticCentral AmericanCentral American IndianCherokeeChickasawChippewaChoctawColombianComancheCosta RicanCreekCroatianCrowCubanCzechCzechoslovakianDanishDelawareDominicanDutchEastern EuropeanEcuadorianEgyptianEnglishEstonianEuropeanFilipinoFinnishFrenchFrench American IndianFrench CanadianGermanGerman RussianGreekGuamanian / ChamorroGuatemalanGuyaneseHaitianHonduranHungarianIcelanderIndian (Asian)InupiatIranianIrishIroquoisItalianJamaicanJapaneseKoreanLaotianLatvianLebaneseLiberianLithuanianLumbeeMacedonianMalaysianMarshalleseMenomineeMexicanMexican American IndianMongolianNative HawaiianNavajoNepaleseNew ZealanderNicaraguanNigerianNorthern EuropeanNorwegianOsagePakistaniPanamanianPeruvianPolishPortuguesePotawatomiPuebloPuerto RicanRomanianRussianSalvadoranSamoanScandinavianScotch-IrishScottishSeminoleSerbianShoshoneSiouxSlavicSlovakSloveneSomaliSouth AfricanSouth AmericanSouth American IndianSpaniardSpanishSri LankanSubsaharan AfricanSudaneseSwedishSwissThaiTlingit-HaidaTonganTrinidadian and TobagonianTsimshianTurkishUkrainianVenezuelanWelshYugoslavianYup'ik
Immigrant Origin (Total)
Immigrant Origin (Percentage)
Income
Income (Families)
Income (Households)
Poverty
Poverty (Families)
Unemployment
Employment Occupations
Employment Industries
Employer Class
Commute Time
Commute Means
School Enrollment
Education by Degree Field
Occupancy
Finances
Physical Characteristics
Anchorage
Compare Zip Codes
Comparison Subject

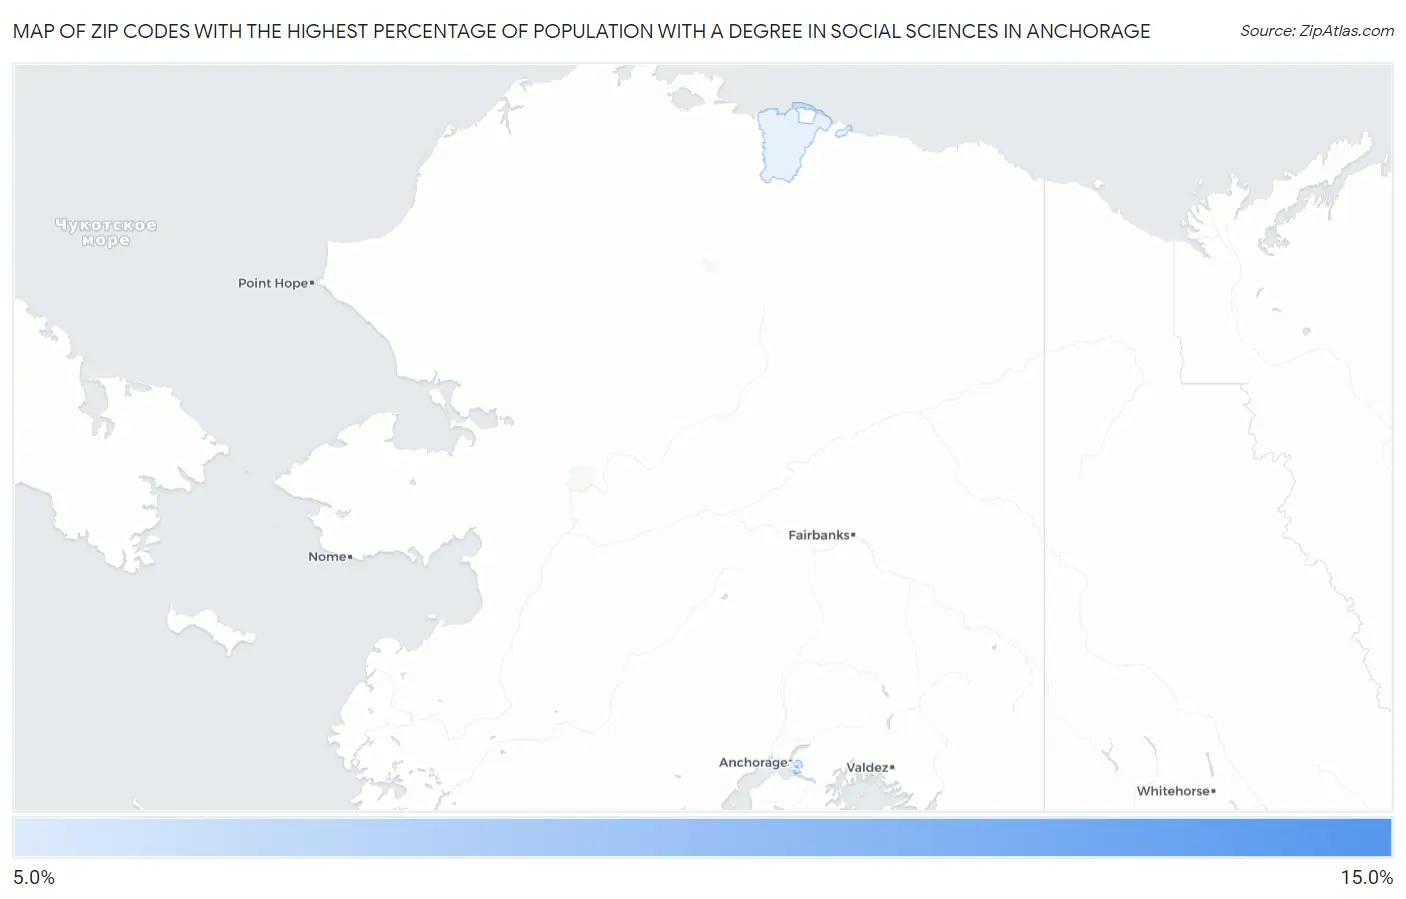
Map of Zip Codes with the Highest Percentage of Population with a Degree in Social Sciences in Anchorage

0.0%
15.0%
Zip Codes with the Highest Percentage of Population with a Degree in Social Sciences in Anchorage Map

Zip Codes with the Highest Percentage of Population with a Degree in Social Sciences in Anchorage, AK

Zip Code % Graduates vs State vs National
1.9950114.9%8.1%(+6.81)#278.1%(+6.86)#1,981
2.9950811.2%8.1%(+3.04)#358.1%(+3.09)#4,210
3.9950310.4%8.1%(+2.23)#378.1%(+2.28)#5,119
4.995178.7%8.1%(+0.579)#458.1%(+0.626)#7,430
5.995028.7%8.1%(+0.539)#478.1%(+0.587)#7,504
6.995158.2%8.1%(+0.040)#548.1%(+0.088)#8,442
7.995077.6%8.1%(-0.536)#608.1%(-0.488)#9,598
8.995166.4%8.1%(-1.70)#638.1%(-1.66)#12,329
9.995045.7%8.1%(-2.40)#728.1%(-2.35)#14,010
10.995185.2%8.1%(-2.88)#778.1%(-2.83)#15,246

Common Questions

What are the Top 10 Zip Codes with the Highest Percentage of Population with a Degree in Social Sciences in Anchorage, AK?
Top 10 Zip Codes with the Highest Percentage of Population with a Degree in Social Sciences in Anchorage, AK are:
#1
14.9%
#2
11.2%
#3
10.4%
#4
8.7%
#5
8.7%
#6
8.2%
#7
7.6%
#8
6.4%
#9
5.7%
#10
5.2%
What zip code has the Highest Percentage of Population with a Degree in Social Sciences in Anchorage, AK?
99501 has the Highest Percentage of Population with a Degree in Social Sciences in Anchorage, AK with 14.9%.
What is the Percentage of Population with a Degree in Social Sciences in Anchorage, AK?
Percentage of Population with a Degree in Social Sciences in Anchorage is 8.7%.
What is the Percentage of Population with a Degree in Social Sciences in Alaska?
Percentage of Population with a Degree in Social Sciences in Alaska is 8.1%.
What is the Percentage of Population with a Degree in Social Sciences in the United States?
Percentage of Population with a Degree in Social Sciences in the United States is 8.1%.