Berryville, VA Map & Demographics
Berryville Map
Berryville Overview
$42,131
PER CAPITA INCOME
$113,704
AVG FAMILY INCOME
$91,089
AVG HOUSEHOLD INCOME
33.9%
WAGE / INCOME GAP [ % ]
66.1¢/ $1
WAGE / INCOME GAP [ $ ]
0.39
INEQUALITY / GINI INDEX
4,598
TOTAL POPULATION
2,246
MALE POPULATION
2,352
FEMALE POPULATION
95.49
MALES / 100 FEMALES
104.72
FEMALES / 100 MALES
48.9
MEDIAN AGE
3.2
AVG FAMILY SIZE
2.7
AVG HOUSEHOLD SIZE
1,902
LABOR FORCE [ PEOPLE ]
49.3%
PERCENT IN LABOR FORCE
4.9%
UNEMPLOYMENT RATE
Berryville Zip Codes
Berryville Area Codes
Income in Berryville
Income Overview in Berryville
Per Capita Income in Berryville is $42,131, while median incomes of families and households are $113,704 and $91,089 respectively.
| Characteristic | Number | Measure |
| Per Capita Income | 4,598 | $42,131 |
| Median Family Income | 1,042 | $113,704 |
| Mean Family Income | 1,042 | $117,925 |
| Median Household Income | 1,659 | $91,089 |
| Mean Household Income | 1,659 | $97,448 |
| Income Deficit | 1,042 | $0 |
| Wage / Income Gap (%) | 4,598 | 33.94% |
| Wage / Income Gap ($) | 4,598 | 66.06¢ per $1 |
| Gini / Inequality Index | 4,598 | 0.39 |
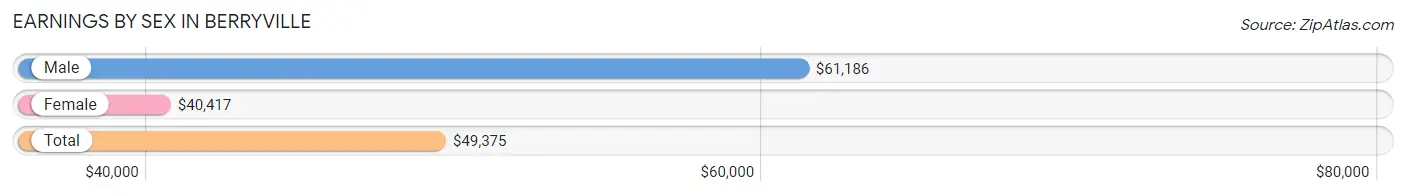
Earnings by Sex in Berryville
Average Earnings in Berryville are $49,375, $61,186 for men and $40,417 for women, a difference of 33.9%.
| Sex | Number | Average Earnings |
| Male | 1,063 (54.6%) | $61,186 |
| Female | 882 (45.4%) | $40,417 |
| Total | 1,945 (100.0%) | $49,375 |
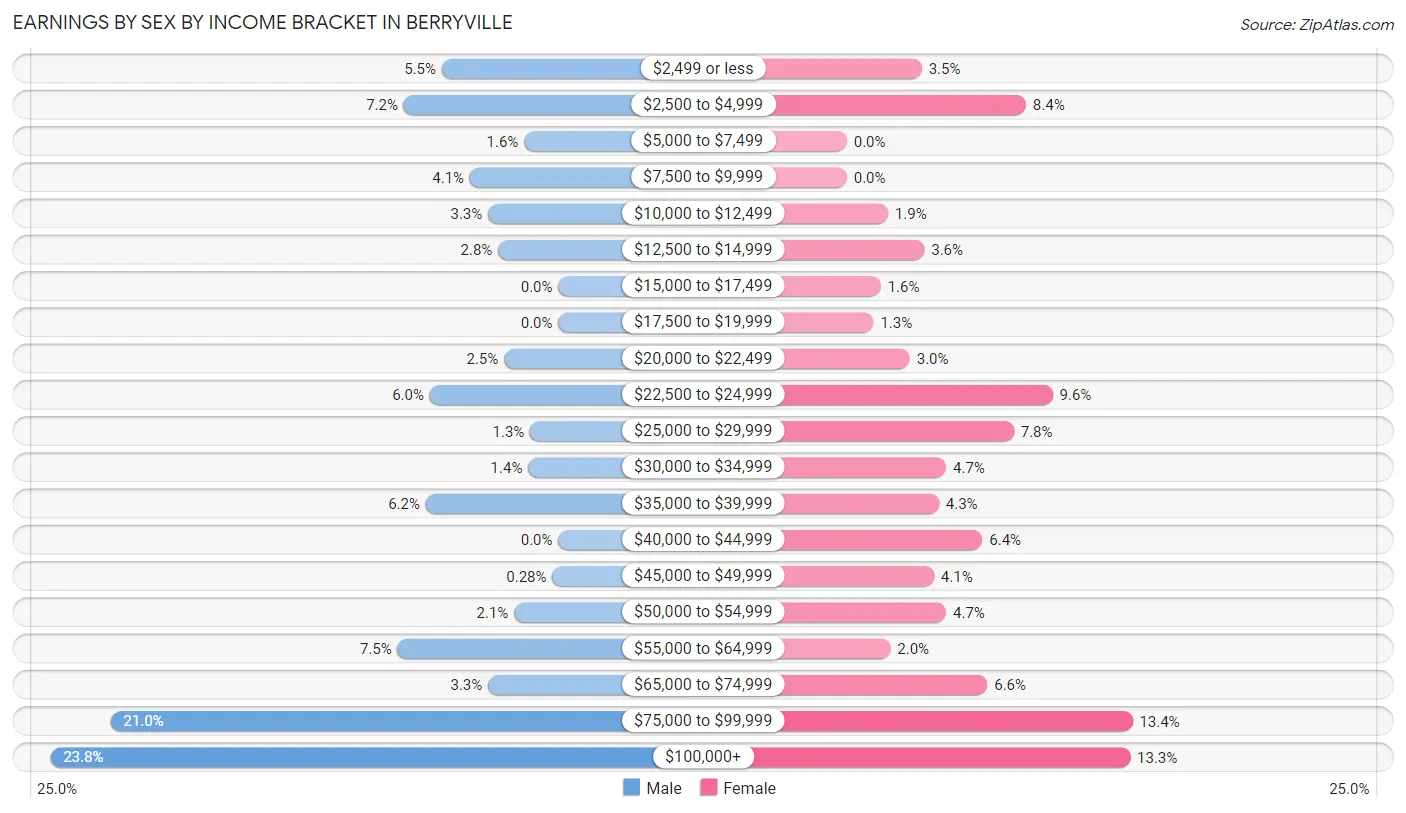
Earnings by Sex by Income Bracket in Berryville
The most common earnings brackets in Berryville are $100,000+ for men (253 | 23.8%) and $75,000 to $99,999 for women (118 | 13.4%).
| Income | Male | Female |
| $2,499 or less | 58 (5.5%) | 31 (3.5%) |
| $2,500 to $4,999 | 77 (7.2%) | 74 (8.4%) |
| $5,000 to $7,499 | 17 (1.6%) | 0 (0.0%) |
| $7,500 to $9,999 | 44 (4.1%) | 0 (0.0%) |
| $10,000 to $12,499 | 35 (3.3%) | 17 (1.9%) |
| $12,500 to $14,999 | 30 (2.8%) | 32 (3.6%) |
| $15,000 to $17,499 | 0 (0.0%) | 14 (1.6%) |
| $17,500 to $19,999 | 0 (0.0%) | 11 (1.3%) |
| $20,000 to $22,499 | 27 (2.5%) | 26 (2.9%) |
| $22,500 to $24,999 | 64 (6.0%) | 85 (9.6%) |
| $25,000 to $29,999 | 14 (1.3%) | 69 (7.8%) |
| $30,000 to $34,999 | 15 (1.4%) | 41 (4.6%) |
| $35,000 to $39,999 | 66 (6.2%) | 38 (4.3%) |
| $40,000 to $44,999 | 0 (0.0%) | 56 (6.4%) |
| $45,000 to $49,999 | 3 (0.3%) | 36 (4.1%) |
| $50,000 to $54,999 | 22 (2.1%) | 41 (4.6%) |
| $55,000 to $64,999 | 80 (7.5%) | 18 (2.0%) |
| $65,000 to $74,999 | 35 (3.3%) | 58 (6.6%) |
| $75,000 to $99,999 | 223 (21.0%) | 118 (13.4%) |
| $100,000+ | 253 (23.8%) | 117 (13.3%) |
| Total | 1,063 (100.0%) | 882 (100.0%) |
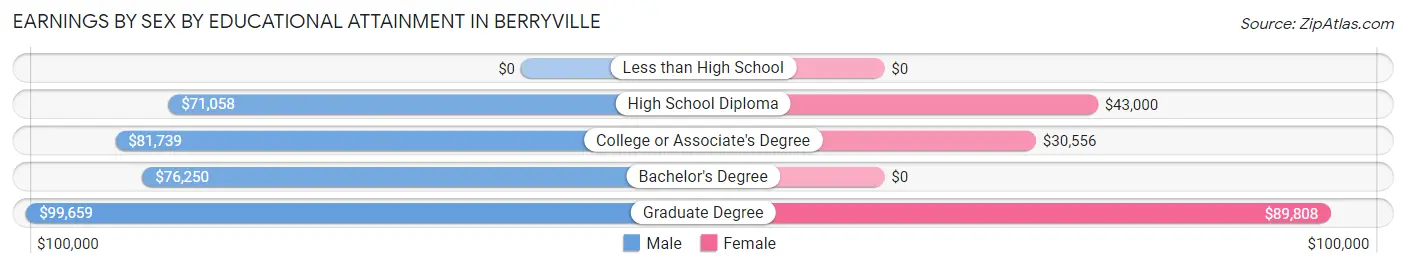
Earnings by Sex by Educational Attainment in Berryville
Average earnings in Berryville are $78,512 for men and $44,145 for women, a difference of 43.8%. Men with an educational attainment of graduate degree enjoy the highest average annual earnings of $99,659, while those with high school diploma education earn the least with $71,058. Women with an educational attainment of graduate degree earn the most with the average annual earnings of $89,808, while those with college or associate's degree education have the smallest earnings of $30,556.
| Educational Attainment | Male Income | Female Income |
| Less than High School | - | - |
| High School Diploma | $71,058 | $43,000 |
| College or Associate's Degree | $81,739 | $30,556 |
| Bachelor's Degree | $76,250 | $0 |
| Graduate Degree | $99,659 | $89,808 |
| Total | $78,512 | $44,145 |
Family Income in Berryville
Family Income Brackets in Berryville
According to the Berryville family income data, there are 352 families falling into the $100,000 to $149,999 income range, which is the most common income bracket and makes up 33.8% of all families. Conversely, the less than $10,000 income bracket is the least frequent group with only 13 families (1.3%) belonging to this category.
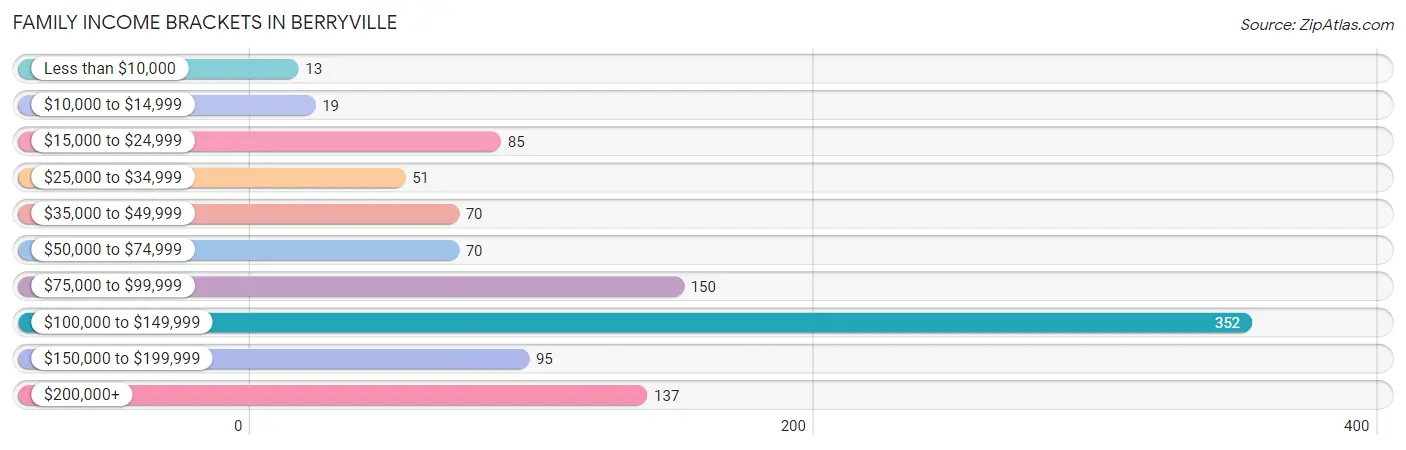
| Income Bracket | # Families | % Families |
| Less than $10,000 | 13 | 1.2% |
| $10,000 to $14,999 | 19 | 1.8% |
| $15,000 to $24,999 | 85 | 8.2% |
| $25,000 to $34,999 | 51 | 4.9% |
| $35,000 to $49,999 | 70 | 6.7% |
| $50,000 to $74,999 | 70 | 6.7% |
| $75,000 to $99,999 | 150 | 14.4% |
| $100,000 to $149,999 | 352 | 33.8% |
| $150,000 to $199,999 | 95 | 9.1% |
| $200,000+ | 137 | 13.1% |
Family Income by Famaliy Size in Berryville
7+ person families (29 | 2.8%) account for the highest median family income in Berryville with $217,417 per family, while 2-person families (537 | 51.5%) have the highest median income of $48,282 per family member.
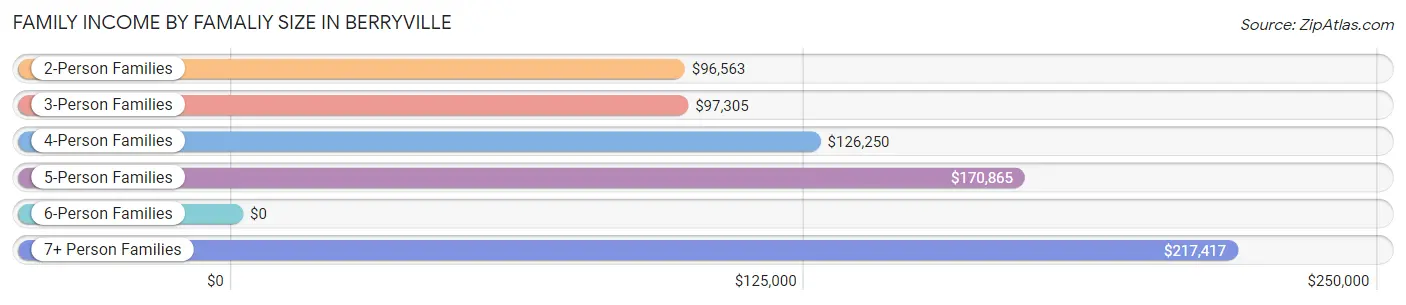
| Income Bracket | # Families | Median Income |
| 2-Person Families | 537 (51.5%) | $96,563 |
| 3-Person Families | 277 (26.6%) | $97,305 |
| 4-Person Families | 80 (7.7%) | $126,250 |
| 5-Person Families | 81 (7.8%) | $170,865 |
| 6-Person Families | 38 (3.6%) | $0 |
| 7+ Person Families | 29 (2.8%) | $217,417 |
| Total | 1,042 (100.0%) | $113,704 |
Family Income by Number of Earners in Berryville
The median family income in Berryville is $113,704, with families comprising 2 earners (259) having the highest median family income of $139,901, while families with 1 earner (319) have the lowest median family income of $61,985, accounting for 24.9% and 30.6% of families, respectively.
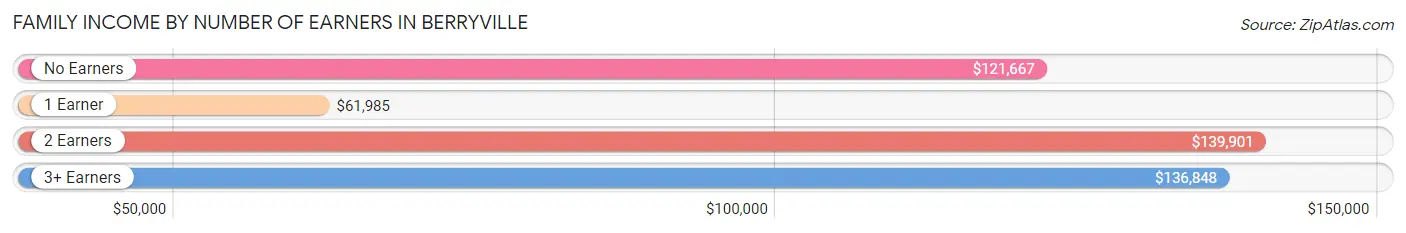
| Number of Earners | # Families | Median Income |
| No Earners | 326 (31.3%) | $121,667 |
| 1 Earner | 319 (30.6%) | $61,985 |
| 2 Earners | 259 (24.9%) | $139,901 |
| 3+ Earners | 138 (13.2%) | $136,848 |
| Total | 1,042 (100.0%) | $113,704 |
Household Income in Berryville
Household Income Brackets in Berryville
With 474 households falling in the category, the $100,000 to $149,999 income range is the most frequent in Berryville, accounting for 28.6% of all households. In contrast, only 41 households (2.5%) fall into the $10,000 to $14,999 income bracket, making it the least populous group.
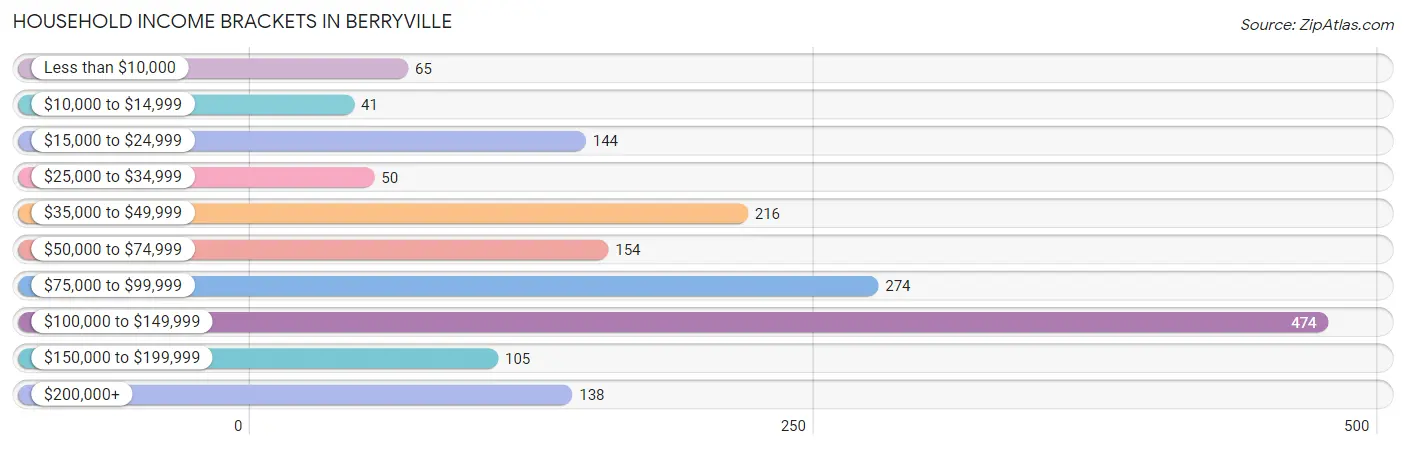
| Income Bracket | # Households | % Households |
| Less than $10,000 | 65 | 3.9% |
| $10,000 to $14,999 | 41 | 2.5% |
| $15,000 to $24,999 | 144 | 8.7% |
| $25,000 to $34,999 | 50 | 3.0% |
| $35,000 to $49,999 | 216 | 13.0% |
| $50,000 to $74,999 | 154 | 9.3% |
| $75,000 to $99,999 | 274 | 16.5% |
| $100,000 to $149,999 | 474 | 28.6% |
| $150,000 to $199,999 | 105 | 6.3% |
| $200,000+ | 138 | 8.3% |
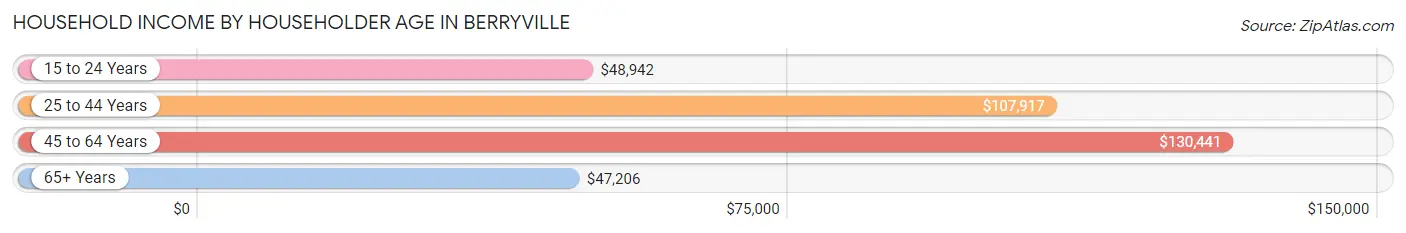
Household Income by Householder Age in Berryville
The median household income in Berryville is $91,089, with the highest median household income of $130,441 found in the 45 to 64 years age bracket for the primary householder. A total of 640 households (38.6%) fall into this category. Meanwhile, the 65+ years age bracket for the primary householder has the lowest median household income of $47,206, with 574 households (34.6%) in this group.
| Income Bracket | # Households | Median Income |
| 15 to 24 Years | 56 (3.4%) | $48,942 |
| 25 to 44 Years | 389 (23.4%) | $107,917 |
| 45 to 64 Years | 640 (38.6%) | $130,441 |
| 65+ Years | 574 (34.6%) | $47,206 |
| Total | 1,659 (100.0%) | $91,089 |
Poverty in Berryville
Income Below Poverty by Sex and Age in Berryville
With 11.1% poverty level for males and 12.1% for females among the residents of Berryville, 18 to 24 year old males and 5 year old females are the most vulnerable to poverty, with 90 males (46.6%) and 29 females (100.0%) in their respective age groups living below the poverty level.
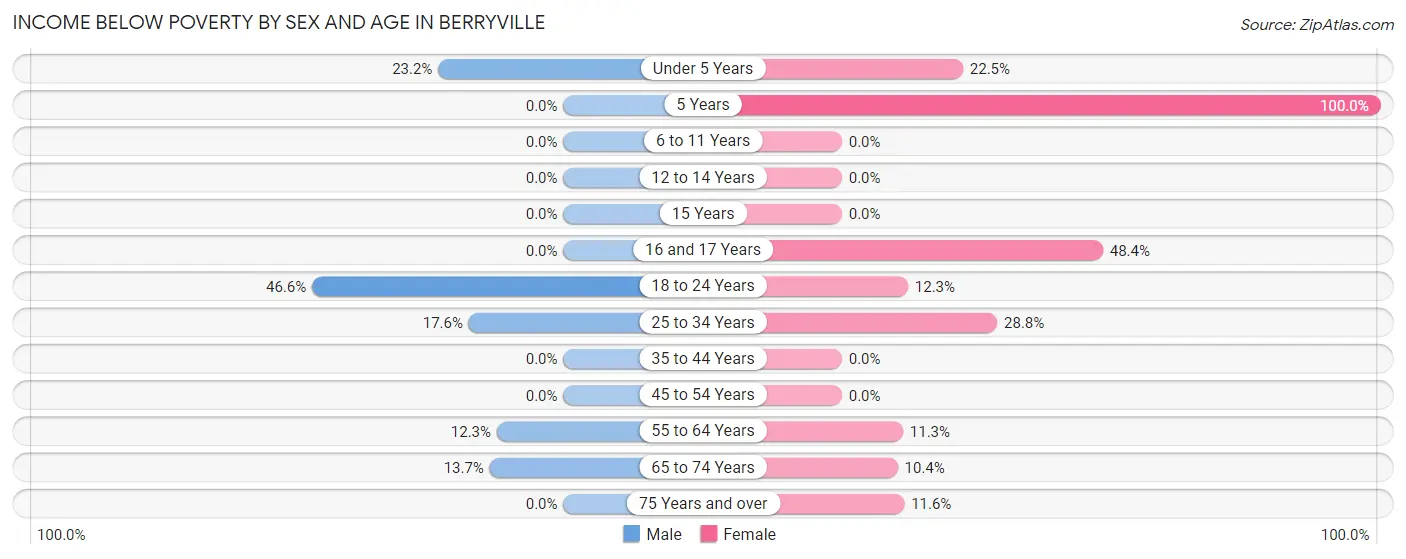
| Age Bracket | Male | Female |
| Under 5 Years | 23 (23.2%) | 20 (22.5%) |
| 5 Years | 0 (0.0%) | 29 (100.0%) |
| 6 to 11 Years | 0 (0.0%) | 0 (0.0%) |
| 12 to 14 Years | 0 (0.0%) | 0 (0.0%) |
| 15 Years | 0 (0.0%) | 0 (0.0%) |
| 16 and 17 Years | 0 (0.0%) | 31 (48.4%) |
| 18 to 24 Years | 90 (46.6%) | 13 (12.3%) |
| 25 to 34 Years | 43 (17.5%) | 79 (28.8%) |
| 35 to 44 Years | 0 (0.0%) | 0 (0.0%) |
| 45 to 54 Years | 0 (0.0%) | 0 (0.0%) |
| 55 to 64 Years | 48 (12.3%) | 34 (11.3%) |
| 65 to 74 Years | 35 (13.7%) | 35 (10.4%) |
| 75 Years and over | 0 (0.0%) | 36 (11.6%) |
| Total | 239 (11.1%) | 277 (12.1%) |
Income Above Poverty by Sex and Age in Berryville
According to the poverty statistics in Berryville, males aged 5 years and females aged 6 to 11 years are the age groups that are most secure financially, with 100.0% of males and 100.0% of females in these age groups living above the poverty line.
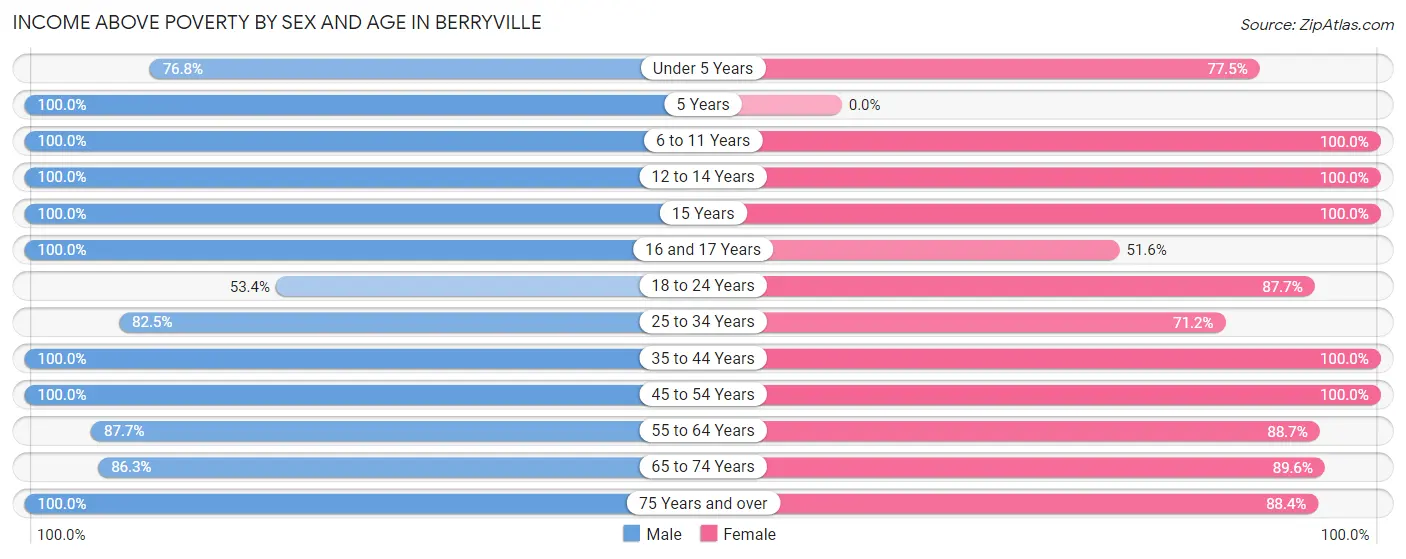
| Age Bracket | Male | Female |
| Under 5 Years | 76 (76.8%) | 69 (77.5%) |
| 5 Years | 18 (100.0%) | 0 (0.0%) |
| 6 to 11 Years | 77 (100.0%) | 157 (100.0%) |
| 12 to 14 Years | 78 (100.0%) | 160 (100.0%) |
| 15 Years | 19 (100.0%) | 13 (100.0%) |
| 16 and 17 Years | 96 (100.0%) | 33 (51.6%) |
| 18 to 24 Years | 103 (53.4%) | 93 (87.7%) |
| 25 to 34 Years | 202 (82.5%) | 195 (71.2%) |
| 35 to 44 Years | 221 (100.0%) | 180 (100.0%) |
| 45 to 54 Years | 310 (100.0%) | 269 (100.0%) |
| 55 to 64 Years | 341 (87.7%) | 266 (88.7%) |
| 65 to 74 Years | 221 (86.3%) | 303 (89.6%) |
| 75 Years and over | 149 (100.0%) | 275 (88.4%) |
| Total | 1,911 (88.9%) | 2,013 (87.9%) |
Income Below Poverty Among Married-Couple Families in Berryville
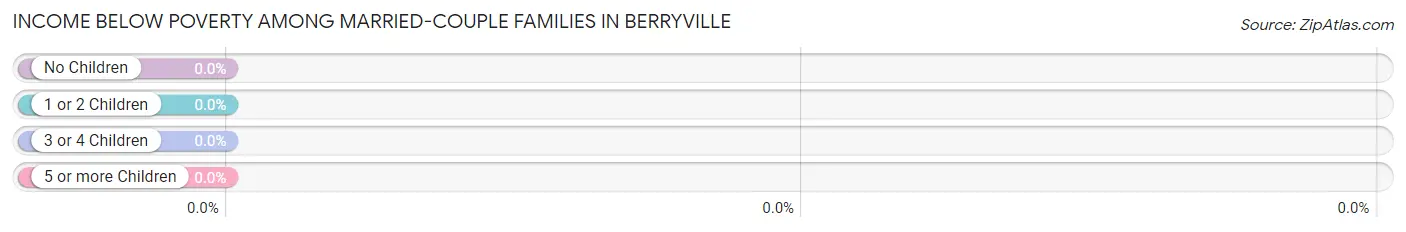
| Children | Above Poverty | Below Poverty |
| No Children | 498 (100.0%) | 0 (0.0%) |
| 1 or 2 Children | 184 (100.0%) | 0 (0.0%) |
| 3 or 4 Children | 91 (100.0%) | 0 (0.0%) |
| 5 or more Children | 0 (0.0%) | 0 (0.0%) |
| Total | 773 (100.0%) | 0 (0.0%) |
Income Below Poverty Among Single-Parent Households in Berryville
According to the poverty data in Berryville, 31.3% or 26 single-father households and 17.2% or 32 single-mother households are living below the poverty line. Among single-father households, those with 1 or 2 children have the highest poverty rate, with 26 households (70.3%) experiencing poverty. Likewise, among single-mother households, those with no children have the highest poverty rate, with 19 households (24.4%) falling below the poverty line.
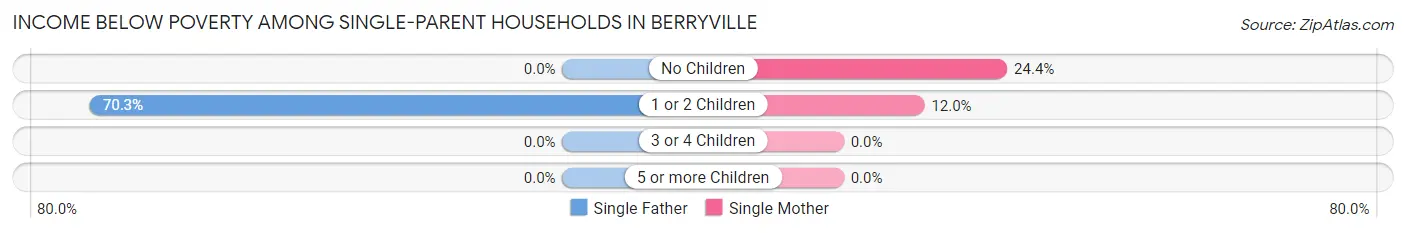
| Children | Single Father | Single Mother |
| No Children | 0 (0.0%) | 19 (24.4%) |
| 1 or 2 Children | 26 (70.3%) | 13 (12.0%) |
| 3 or 4 Children | 0 (0.0%) | 0 (0.0%) |
| 5 or more Children | 0 (0.0%) | 0 (0.0%) |
| Total | 26 (31.3%) | 32 (17.2%) |
Income Below Poverty Among Married-Couple vs Single-Parent Households in Berryville
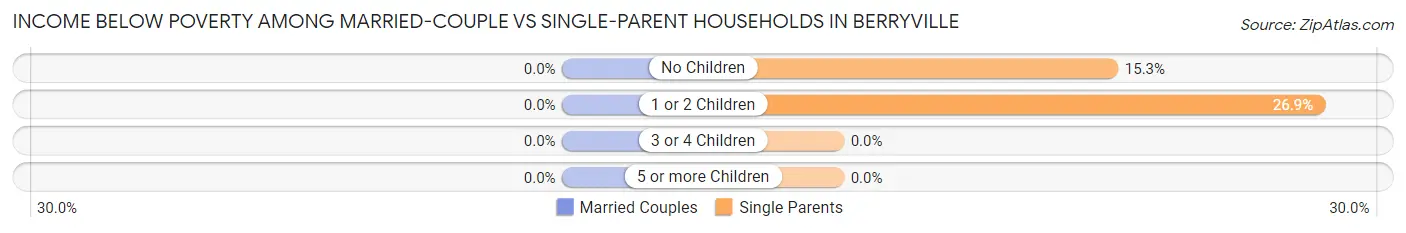
| Children | Married-Couple Families | Single-Parent Households |
| No Children | 0 (0.0%) | 19 (15.3%) |
| 1 or 2 Children | 0 (0.0%) | 39 (26.9%) |
| 3 or 4 Children | 0 (0.0%) | 0 (0.0%) |
| 5 or more Children | 0 (0.0%) | 0 (0.0%) |
| Total | 0 (0.0%) | 58 (21.6%) |
Race in Berryville
The most populous races in Berryville are White / Caucasian (3,966 | 86.3%), Hispanic or Latino (423 | 9.2%), and Black / African American (390 | 8.5%).
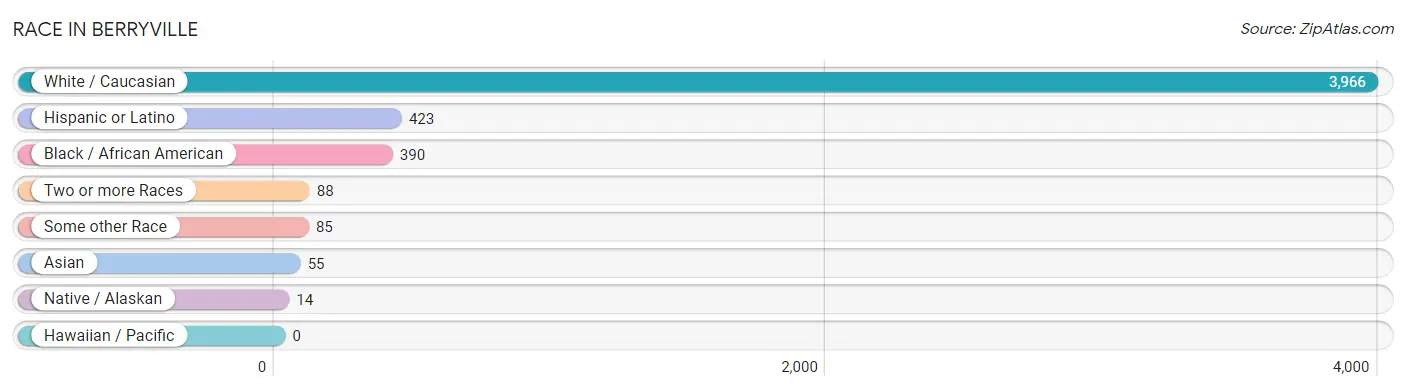
| Race | # Population | % Population |
| Asian | 55 | 1.2% |
| Black / African American | 390 | 8.5% |
| Hawaiian / Pacific | 0 | 0.0% |
| Hispanic or Latino | 423 | 9.2% |
| Native / Alaskan | 14 | 0.3% |
| White / Caucasian | 3,966 | 86.3% |
| Two or more Races | 88 | 1.9% |
| Some other Race | 85 | 1.8% |
| Total | 4,598 | 100.0% |
Ancestry in Berryville
The most populous ancestries reported in Berryville are German (634 | 13.8%), English (545 | 11.8%), Irish (507 | 11.0%), Italian (268 | 5.8%), and South American (229 | 5.0%), together accounting for 47.5% of all Berryville residents.
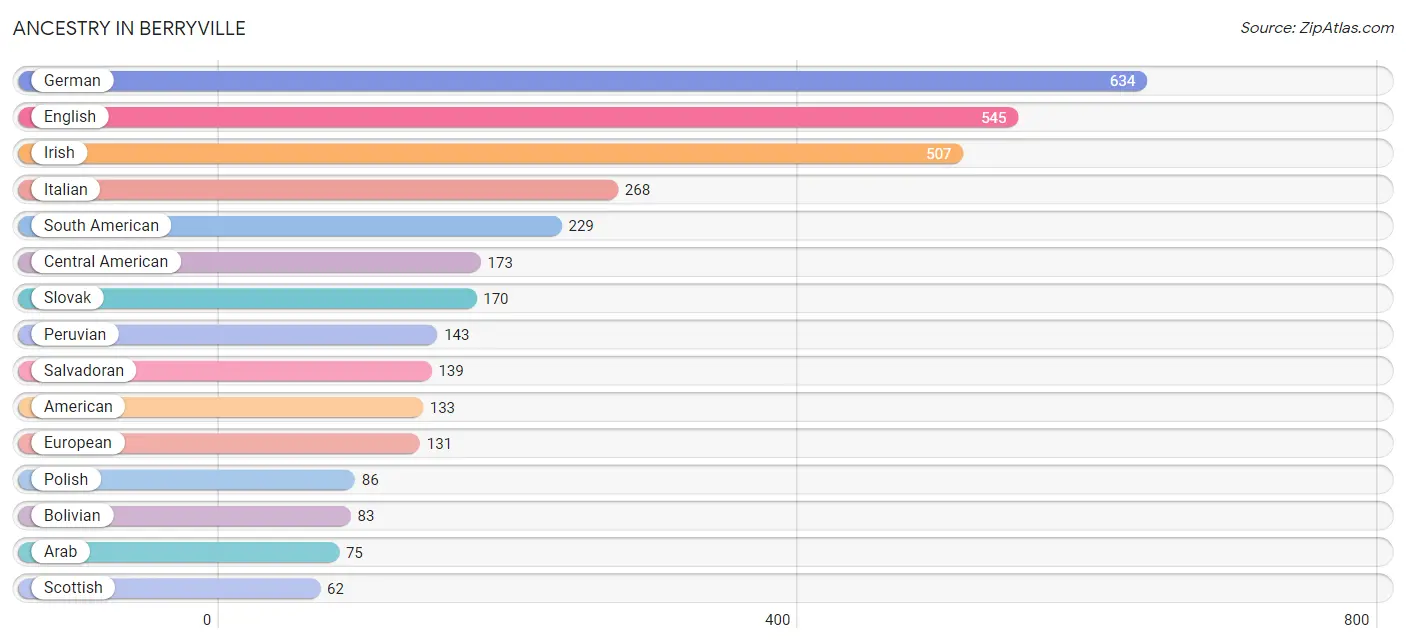
| Ancestry | # Population | % Population |
| African | 20 | 0.4% |
| American | 133 | 2.9% |
| Arab | 75 | 1.6% |
| Armenian | 28 | 0.6% |
| Austrian | 9 | 0.2% |
| Bhutanese | 12 | 0.3% |
| Bolivian | 83 | 1.8% |
| British | 40 | 0.9% |
| Burmese | 6 | 0.1% |
| Canadian | 11 | 0.2% |
| Central American | 173 | 3.8% |
| Chilean | 3 | 0.1% |
| Cree | 14 | 0.3% |
| Czech | 16 | 0.4% |
| Danish | 27 | 0.6% |
| Dutch | 31 | 0.7% |
| Eastern European | 28 | 0.6% |
| English | 545 | 11.8% |
| European | 131 | 2.9% |
| Finnish | 10 | 0.2% |
| French | 17 | 0.4% |
| French Canadian | 38 | 0.8% |
| German | 634 | 13.8% |
| Guatemalan | 34 | 0.7% |
| Hungarian | 7 | 0.2% |
| Irish | 507 | 11.0% |
| Italian | 268 | 5.8% |
| Northern European | 43 | 0.9% |
| Norwegian | 28 | 0.6% |
| Peruvian | 143 | 3.1% |
| Polish | 86 | 1.9% |
| Portuguese | 8 | 0.2% |
| Russian | 13 | 0.3% |
| Salvadoran | 139 | 3.0% |
| Scotch-Irish | 16 | 0.4% |
| Scottish | 62 | 1.3% |
| Slovak | 170 | 3.7% |
| South American | 229 | 5.0% |
| Spanish | 21 | 0.5% |
| Subsaharan African | 20 | 0.4% |
| Swedish | 26 | 0.6% |
| Thai | 49 | 1.1% |
| Turkish | 9 | 0.2% |
| Welsh | 46 | 1.0% | View All 44 Rows |
Immigrants in Berryville
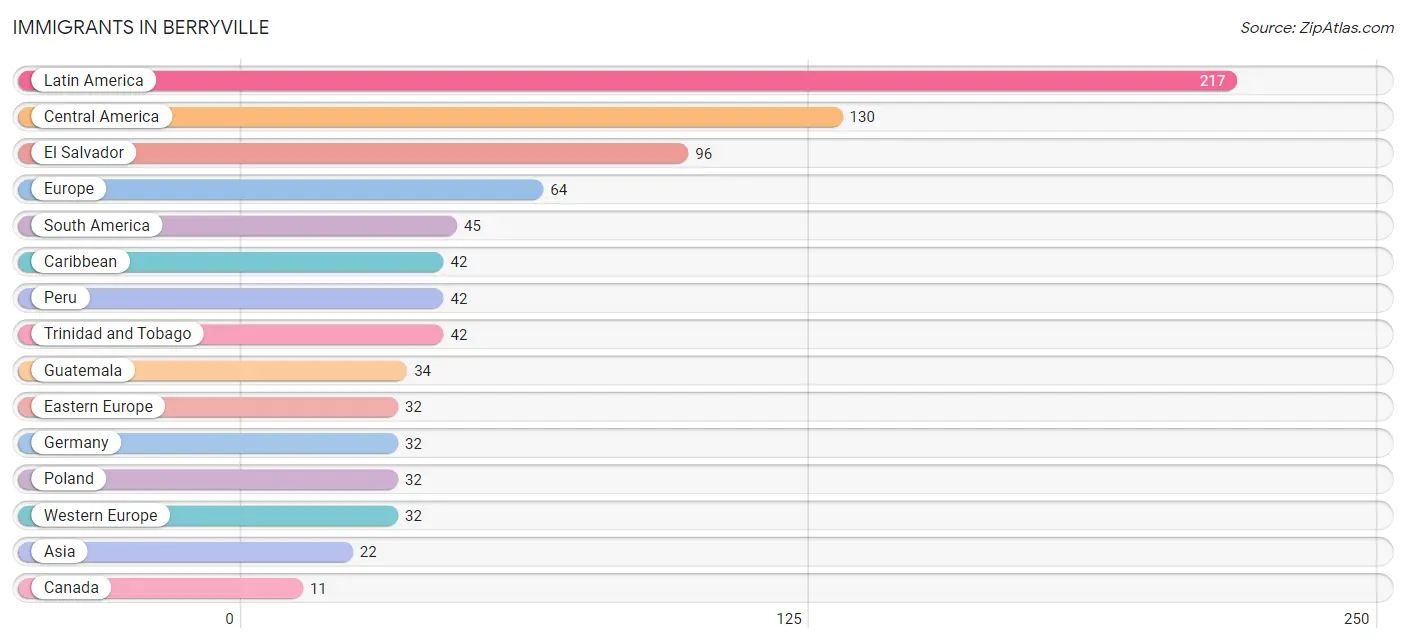
The most numerous immigrant groups reported in Berryville came from Latin America (217 | 4.7%), Central America (130 | 2.8%), El Salvador (96 | 2.1%), Europe (64 | 1.4%), and South America (45 | 1.0%), together accounting for 12.0% of all Berryville residents.
| Immigration Origin | # Population | % Population |
| Asia | 22 | 0.5% |
| Canada | 11 | 0.2% |
| Caribbean | 42 | 0.9% |
| Central America | 130 | 2.8% |
| Chile | 3 | 0.1% |
| Eastern Asia | 6 | 0.1% |
| Eastern Europe | 32 | 0.7% |
| El Salvador | 96 | 2.1% |
| Europe | 64 | 1.4% |
| Germany | 32 | 0.7% |
| Guatemala | 34 | 0.7% |
| India | 7 | 0.2% |
| Korea | 6 | 0.1% |
| Latin America | 217 | 4.7% |
| Peru | 42 | 0.9% |
| Poland | 32 | 0.7% |
| South America | 45 | 1.0% |
| South Central Asia | 7 | 0.2% |
| Trinidad and Tobago | 42 | 0.9% |
| Turkey | 9 | 0.2% |
| Western Asia | 9 | 0.2% |
| Western Europe | 32 | 0.7% | View All 22 Rows |
Sex and Age in Berryville
Sex and Age in Berryville
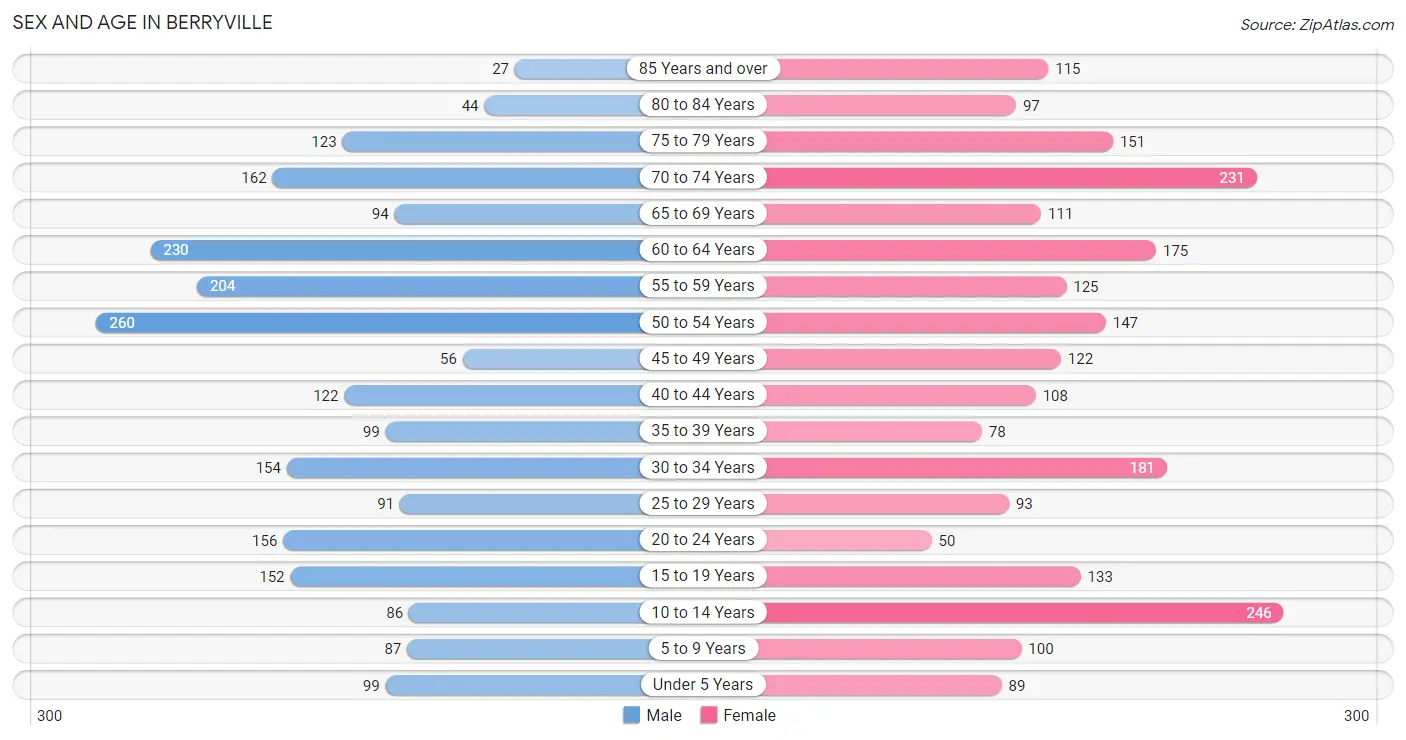
The most populous age groups in Berryville are 50 to 54 Years (260 | 11.6%) for men and 10 to 14 Years (246 | 10.5%) for women.
| Age Bracket | Male | Female |
| Under 5 Years | 99 (4.4%) | 89 (3.8%) |
| 5 to 9 Years | 87 (3.9%) | 100 (4.3%) |
| 10 to 14 Years | 86 (3.8%) | 246 (10.5%) |
| 15 to 19 Years | 152 (6.8%) | 133 (5.7%) |
| 20 to 24 Years | 156 (7.0%) | 50 (2.1%) |
| 25 to 29 Years | 91 (4.1%) | 93 (4.0%) |
| 30 to 34 Years | 154 (6.9%) | 181 (7.7%) |
| 35 to 39 Years | 99 (4.4%) | 78 (3.3%) |
| 40 to 44 Years | 122 (5.4%) | 108 (4.6%) |
| 45 to 49 Years | 56 (2.5%) | 122 (5.2%) |
| 50 to 54 Years | 260 (11.6%) | 147 (6.2%) |
| 55 to 59 Years | 204 (9.1%) | 125 (5.3%) |
| 60 to 64 Years | 230 (10.2%) | 175 (7.4%) |
| 65 to 69 Years | 94 (4.2%) | 111 (4.7%) |
| 70 to 74 Years | 162 (7.2%) | 231 (9.8%) |
| 75 to 79 Years | 123 (5.5%) | 151 (6.4%) |
| 80 to 84 Years | 44 (2.0%) | 97 (4.1%) |
| 85 Years and over | 27 (1.2%) | 115 (4.9%) |
| Total | 2,246 (100.0%) | 2,352 (100.0%) |
Families and Households in Berryville
Median Family Size in Berryville
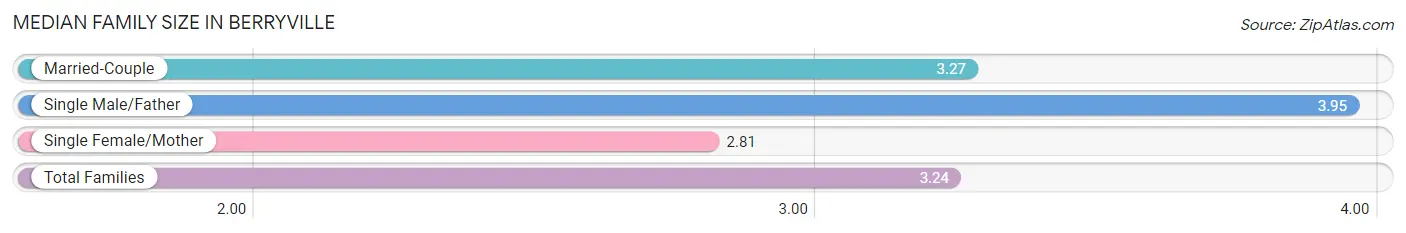
The median family size in Berryville is 3.24 persons per family, with single male/father families (83 | 8.0%) accounting for the largest median family size of 3.95 persons per family. On the other hand, single female/mother families (186 | 17.8%) represent the smallest median family size with 2.81 persons per family.
| Family Type | # Families | Family Size |
| Married-Couple | 773 (74.2%) | 3.27 |
| Single Male/Father | 83 (8.0%) | 3.95 |
| Single Female/Mother | 186 (17.8%) | 2.81 |
| Total Families | 1,042 (100.0%) | 3.24 |
Median Household Size in Berryville
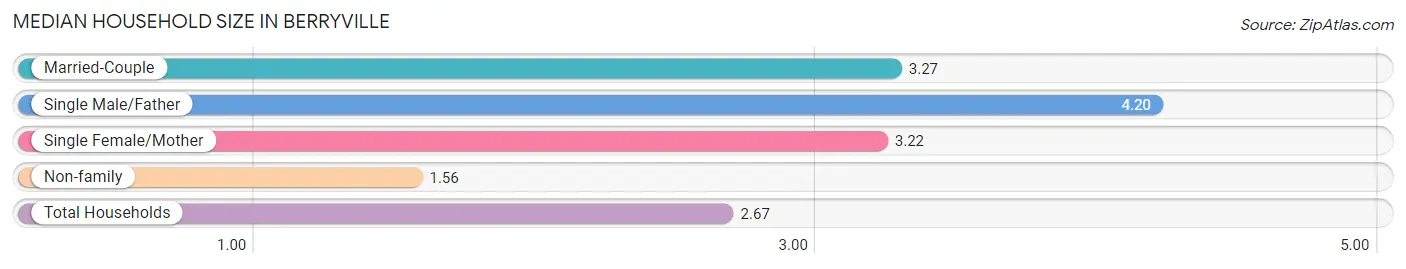
The median household size in Berryville is 2.67 persons per household, with single male/father households (83 | 5.0%) accounting for the largest median household size of 4.2 persons per household. non-family households (617 | 37.2%) represent the smallest median household size with 1.56 persons per household.
| Household Type | # Households | Household Size |
| Married-Couple | 773 (46.6%) | 3.27 |
| Single Male/Father | 83 (5.0%) | 4.20 |
| Single Female/Mother | 186 (11.2%) | 3.22 |
| Non-family | 617 (37.2%) | 1.56 |
| Total Households | 1,659 (100.0%) | 2.67 |
Household Size by Marriage Status in Berryville
Out of a total of 1,659 households in Berryville, 1,042 (62.8%) are family households, while 617 (37.2%) are nonfamily households. The most numerous type of family households are 2-person households, comprising 537, and the most common type of nonfamily households are 1-person households, comprising 487.
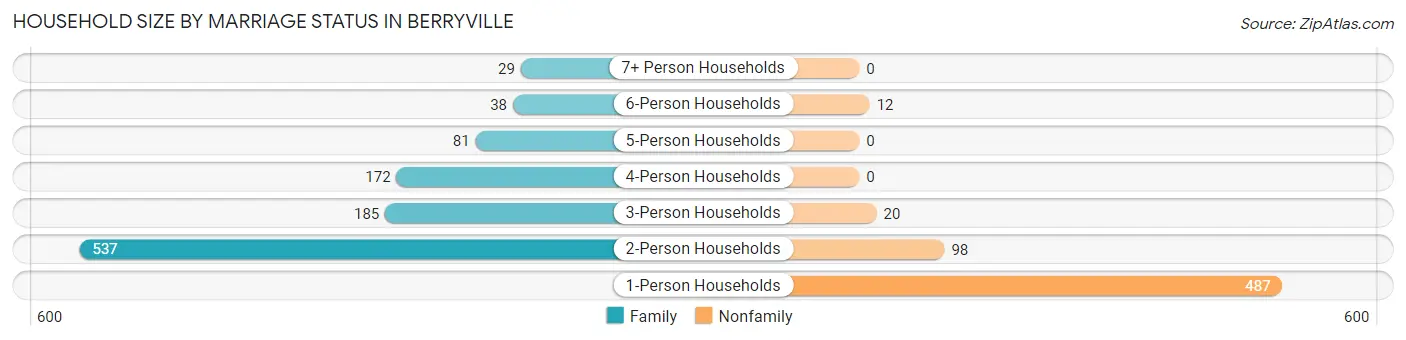
| Household Size | Family Households | Nonfamily Households |
| 1-Person Households | - | 487 (29.4%) |
| 2-Person Households | 537 (32.4%) | 98 (5.9%) |
| 3-Person Households | 185 (11.2%) | 20 (1.2%) |
| 4-Person Households | 172 (10.4%) | 0 (0.0%) |
| 5-Person Households | 81 (4.9%) | 0 (0.0%) |
| 6-Person Households | 38 (2.3%) | 12 (0.7%) |
| 7+ Person Households | 29 (1.8%) | 0 (0.0%) |
| Total | 1,042 (62.8%) | 617 (37.2%) |
Female Fertility in Berryville
Fertility by Age in Berryville
Average fertility rate in Berryville is 62.0 births per 1,000 women. Women in the age bracket of 20 to 34 years have the highest fertility rate with 151.0 births per 1,000 women. Women in the age bracket of 20 to 34 years acount for 100.0% of all women with births.
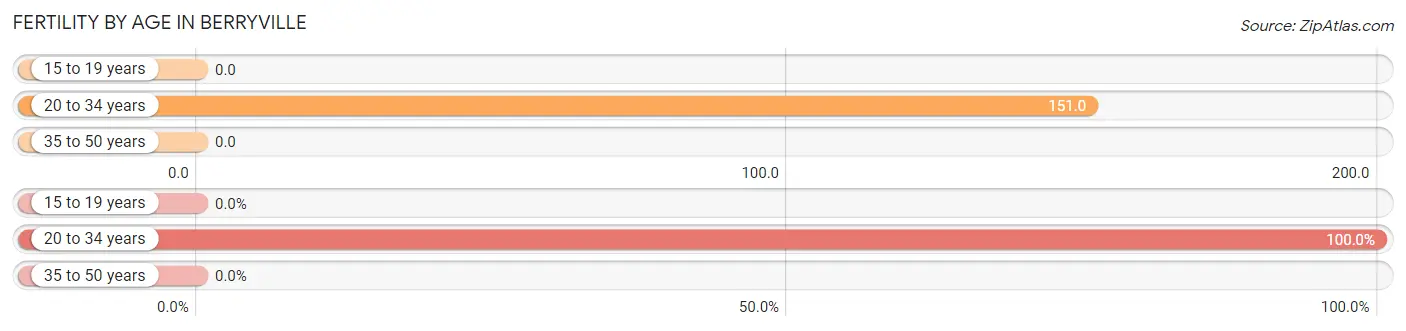
| Age Bracket | Women with Births | Births / 1,000 Women |
| 15 to 19 years | 0 (0.0%) | 0.0 |
| 20 to 34 years | 49 (100.0%) | 151.0 |
| 35 to 50 years | 0 (0.0%) | 0.0 |
| Total | 49 (100.0%) | 62.0 |
Fertility by Age by Marriage Status in Berryville
57.1% of women with births (49) in Berryville are married. The highest percentage of unmarried women with births falls into 20 to 34 years age bracket with 42.9% of them unmarried at the time of birth, while the lowest percentage of unmarried women with births belong to 20 to 34 years age bracket with 42.9% of them unmarried.
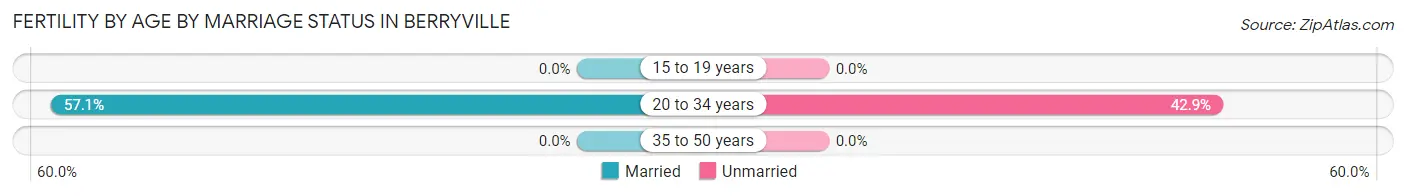
| Age Bracket | Married | Unmarried |
| 15 to 19 years | 0 (0.0%) | 0 (0.0%) |
| 20 to 34 years | 28 (57.1%) | 21 (42.9%) |
| 35 to 50 years | 0 (0.0%) | 0 (0.0%) |
| Total | 28 (57.1%) | 21 (42.9%) |
Fertility by Education in Berryville
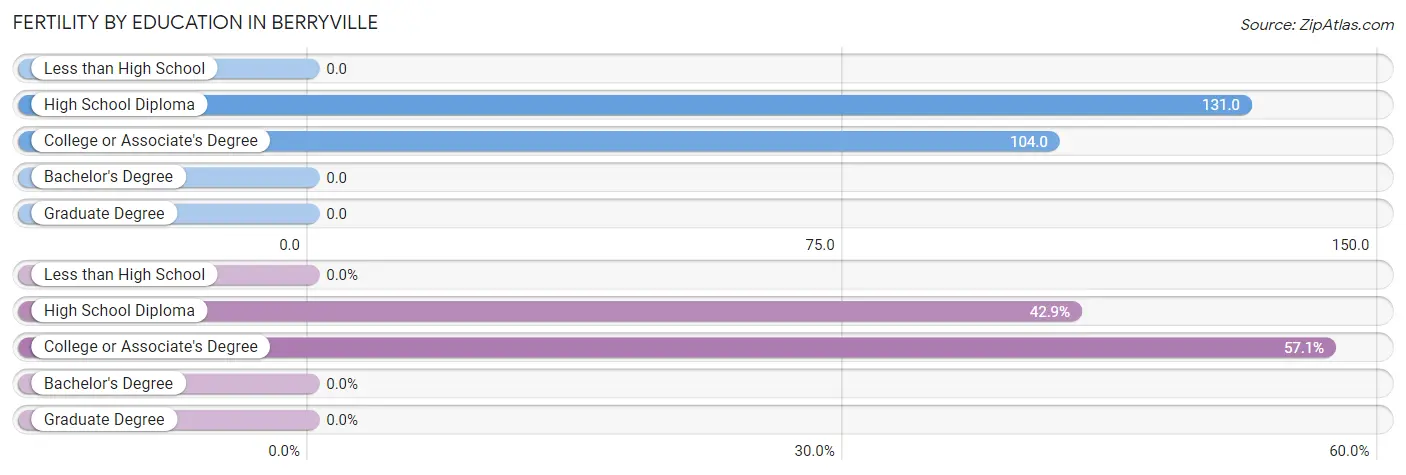
| Educational Attainment | Women with Births | Births / 1,000 Women |
| Less than High School | 0 (0.0%) | 0.0 |
| High School Diploma | 21 (42.9%) | 131.0 |
| College or Associate's Degree | 28 (57.1%) | 104.0 |
| Bachelor's Degree | 0 (0.0%) | 0.0 |
| Graduate Degree | 0 (0.0%) | 0.0 |
| Total | 49 (100.0%) | 62.0 |
Fertility by Education by Marriage Status in Berryville
42.9% of women with births in Berryville are unmarried. Women with the educational attainment of college or associate's degree are most likely to be married with 100.0% of them married at childbirth, while women with the educational attainment of high school diploma are least likely to be married with 100.0% of them unmarried at childbirth.
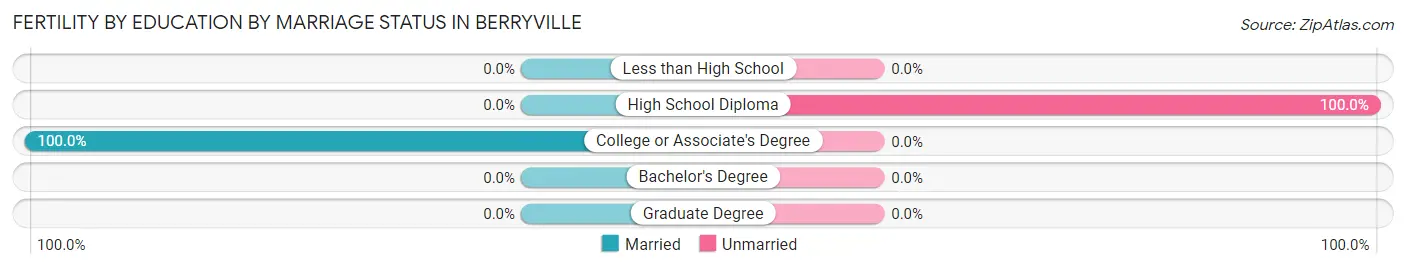
| Educational Attainment | Married | Unmarried |
| Less than High School | 0 (0.0%) | 0 (0.0%) |
| High School Diploma | 0 (0.0%) | 21 (100.0%) |
| College or Associate's Degree | 28 (100.0%) | 0 (0.0%) |
| Bachelor's Degree | 0 (0.0%) | 0 (0.0%) |
| Graduate Degree | 0 (0.0%) | 0 (0.0%) |
| Total | 28 (57.1%) | 21 (42.9%) |
Employment Characteristics in Berryville
Employment by Class of Employer in Berryville
Among the 1,797 employed individuals in Berryville, private company employees (1,162 | 64.7%), local government employees (225 | 12.5%), and self-employed (not incorporated) (160 | 8.9%) make up the most common classes of employment.
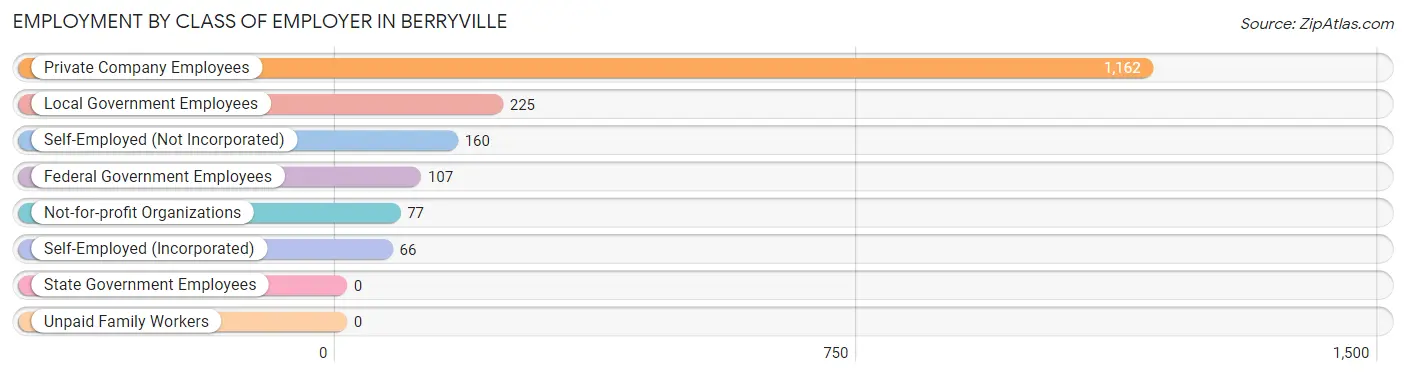
| Employer Class | # Employees | % Employees |
| Private Company Employees | 1,162 | 64.7% |
| Self-Employed (Incorporated) | 66 | 3.7% |
| Self-Employed (Not Incorporated) | 160 | 8.9% |
| Not-for-profit Organizations | 77 | 4.3% |
| Local Government Employees | 225 | 12.5% |
| State Government Employees | 0 | 0.0% |
| Federal Government Employees | 107 | 5.9% |
| Unpaid Family Workers | 0 | 0.0% |
| Total | 1,797 | 100.0% |
Employment Status by Age in Berryville
According to the labor force statistics for Berryville, out of the total population over 16 years of age (3,859), 49.3% or 1,902 individuals are in the labor force, with 4.9% or 93 of them unemployed. The age group with the highest labor force participation rate is 45 to 54 years, with 92.8% or 543 individuals in the labor force. Within the labor force, the 30 to 34 years age range has the highest percentage of unemployed individuals, with 25.1% or 58 of them being unemployed.
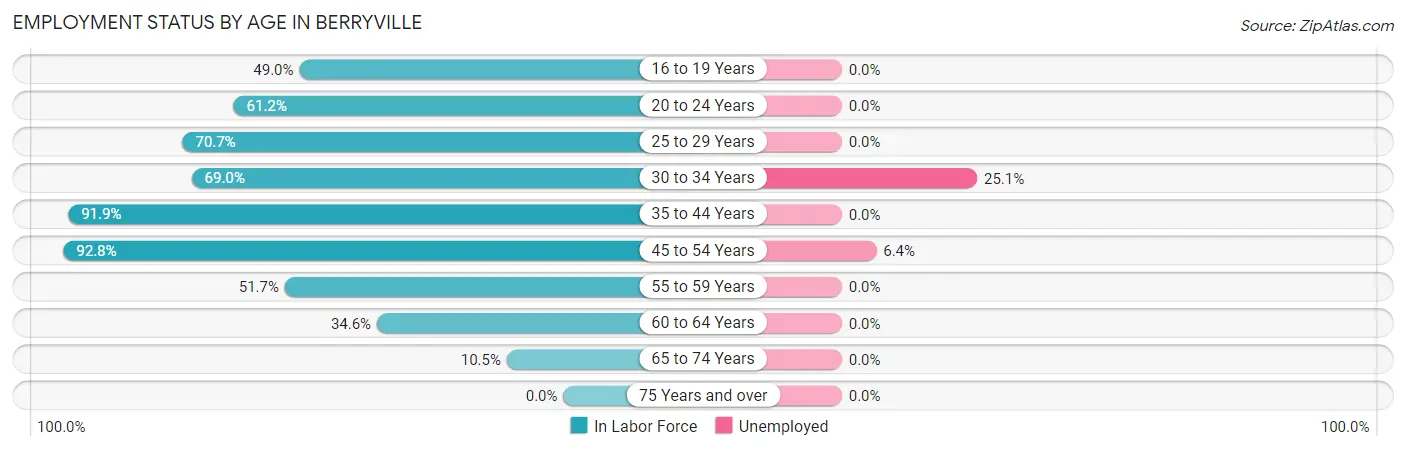
| Age Bracket | In Labor Force | Unemployed |
| 16 to 19 Years | 124 (49.0%) | 0 (0.0%) |
| 20 to 24 Years | 126 (61.2%) | 0 (0.0%) |
| 25 to 29 Years | 130 (70.7%) | 0 (0.0%) |
| 30 to 34 Years | 231 (69.0%) | 58 (25.1%) |
| 35 to 44 Years | 374 (91.9%) | 0 (0.0%) |
| 45 to 54 Years | 543 (92.8%) | 35 (6.4%) |
| 55 to 59 Years | 170 (51.7%) | 0 (0.0%) |
| 60 to 64 Years | 140 (34.6%) | 0 (0.0%) |
| 65 to 74 Years | 63 (10.5%) | 0 (0.0%) |
| 75 Years and over | 0 (0.0%) | 0 (0.0%) |
| Total | 1,902 (49.3%) | 93 (4.9%) |
Employment Status by Educational Attainment in Berryville
According to labor force statistics for Berryville, 70.7% of individuals (1,587) out of the total population between 25 and 64 years of age (2,245) are in the labor force, with 5.9% or 94 of them being unemployed. The group with the highest labor force participation rate are those with the educational attainment of college / associate degree, with 91.4% or 565 individuals in the labor force. Within the labor force, individuals with college / associate degree education have the highest percentage of unemployment, with 10.3% or 58 of them being unemployed.
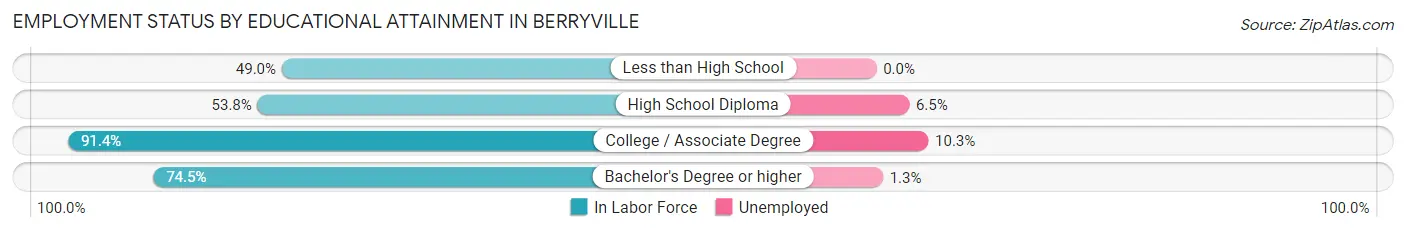
| Educational Attainment | In Labor Force | Unemployed |
| Less than High School | 48 (49.0%) | 0 (0.0%) |
| High School Diploma | 428 (53.8%) | 52 (6.5%) |
| College / Associate Degree | 565 (91.4%) | 64 (10.3%) |
| Bachelor's Degree or higher | 547 (74.5%) | 10 (1.3%) |
| Total | 1,587 (70.7%) | 132 (5.9%) |
Employment Occupations by Sex in Berryville
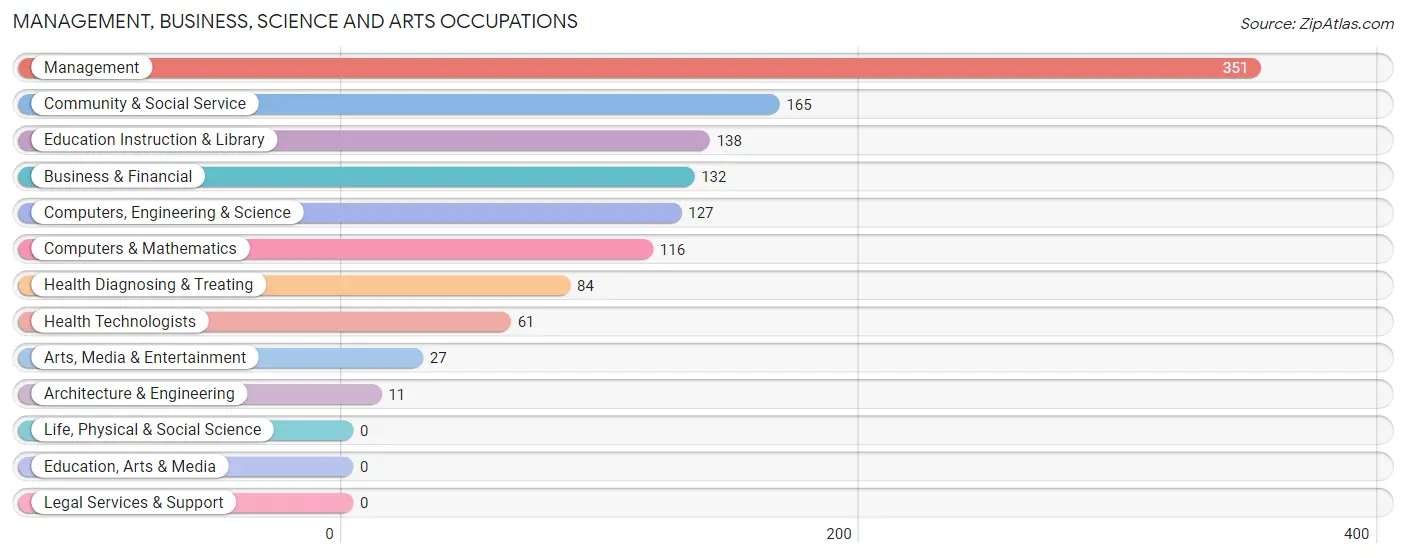
Management, Business, Science and Arts Occupations
The most common Management, Business, Science and Arts occupations in Berryville are Management (351 | 19.6%), Community & Social Service (165 | 9.2%), Education Instruction & Library (138 | 7.7%), Business & Financial (132 | 7.4%), and Computers, Engineering & Science (127 | 7.1%).
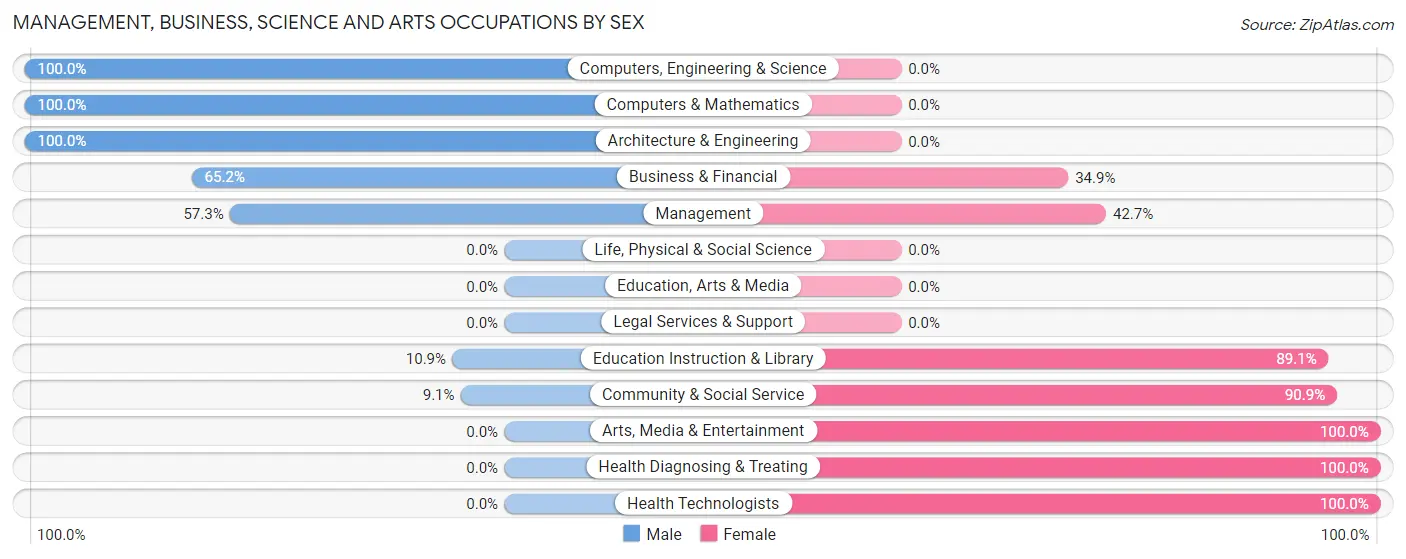
Management, Business, Science and Arts Occupations by Sex
Within the Management, Business, Science and Arts occupations in Berryville, the most male-oriented occupations are Computers, Engineering & Science (100.0%), Computers & Mathematics (100.0%), and Architecture & Engineering (100.0%), while the most female-oriented occupations are Arts, Media & Entertainment (100.0%), Health Diagnosing & Treating (100.0%), and Health Technologists (100.0%).
| Occupation | Male | Female |
| Management | 201 (57.3%) | 150 (42.7%) |
| Business & Financial | 86 (65.1%) | 46 (34.8%) |
| Computers, Engineering & Science | 127 (100.0%) | 0 (0.0%) |
| Computers & Mathematics | 116 (100.0%) | 0 (0.0%) |
| Architecture & Engineering | 11 (100.0%) | 0 (0.0%) |
| Life, Physical & Social Science | 0 (0.0%) | 0 (0.0%) |
| Community & Social Service | 15 (9.1%) | 150 (90.9%) |
| Education, Arts & Media | 0 (0.0%) | 0 (0.0%) |
| Legal Services & Support | 0 (0.0%) | 0 (0.0%) |
| Education Instruction & Library | 15 (10.9%) | 123 (89.1%) |
| Arts, Media & Entertainment | 0 (0.0%) | 27 (100.0%) |
| Health Diagnosing & Treating | 0 (0.0%) | 84 (100.0%) |
| Health Technologists | 0 (0.0%) | 61 (100.0%) |
| Total (Category) | 429 (49.9%) | 430 (50.1%) |
| Total (Overall) | 945 (52.7%) | 848 (47.3%) |
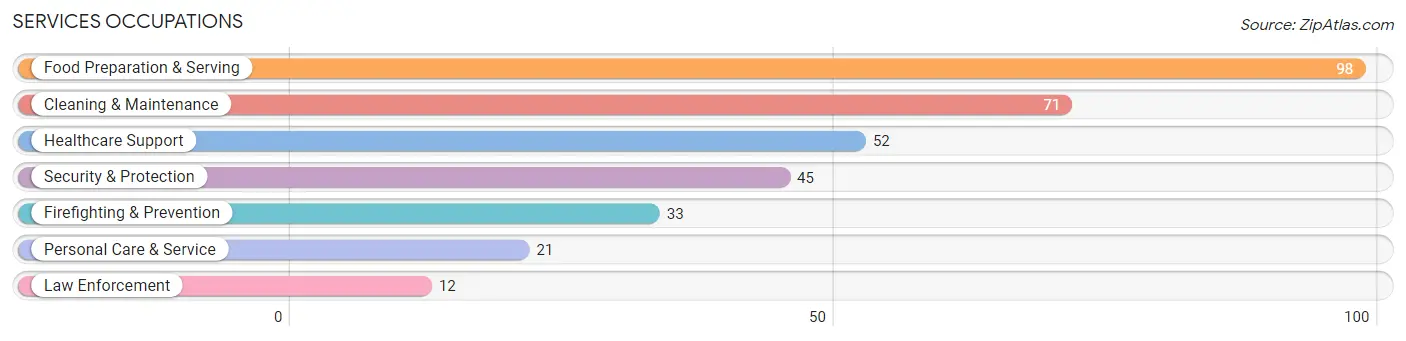
Services Occupations
The most common Services occupations in Berryville are Food Preparation & Serving (98 | 5.5%), Cleaning & Maintenance (71 | 4.0%), Healthcare Support (52 | 2.9%), Security & Protection (45 | 2.5%), and Firefighting & Prevention (33 | 1.8%).
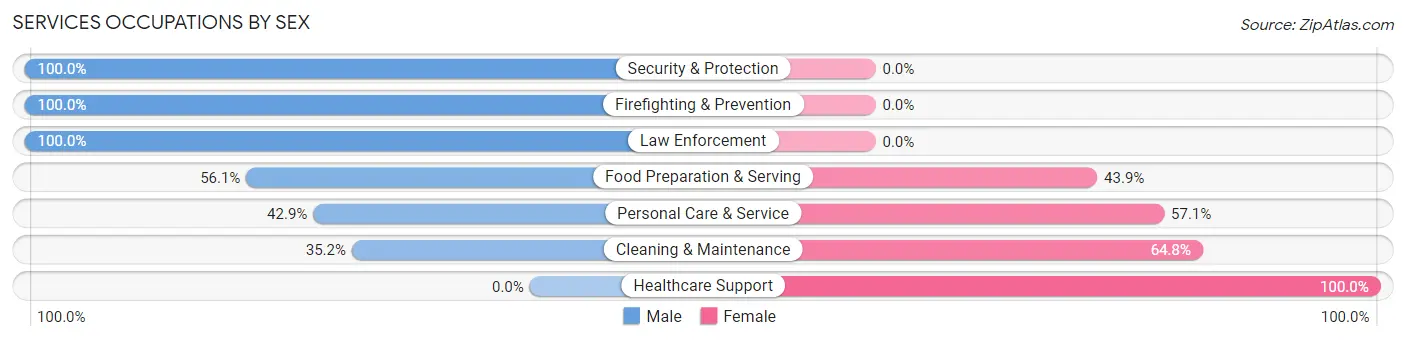
Services Occupations by Sex
Within the Services occupations in Berryville, the most male-oriented occupations are Security & Protection (100.0%), Firefighting & Prevention (100.0%), and Law Enforcement (100.0%), while the most female-oriented occupations are Healthcare Support (100.0%), Cleaning & Maintenance (64.8%), and Personal Care & Service (57.1%).
| Occupation | Male | Female |
| Healthcare Support | 0 (0.0%) | 52 (100.0%) |
| Security & Protection | 45 (100.0%) | 0 (0.0%) |
| Firefighting & Prevention | 33 (100.0%) | 0 (0.0%) |
| Law Enforcement | 12 (100.0%) | 0 (0.0%) |
| Food Preparation & Serving | 55 (56.1%) | 43 (43.9%) |
| Cleaning & Maintenance | 25 (35.2%) | 46 (64.8%) |
| Personal Care & Service | 9 (42.9%) | 12 (57.1%) |
| Total (Category) | 134 (46.7%) | 153 (53.3%) |
| Total (Overall) | 945 (52.7%) | 848 (47.3%) |
Sales and Office Occupations
The most common Sales and Office occupations in Berryville are Sales & Related (233 | 13.0%), and Office & Administration (171 | 9.5%).

Sales and Office Occupations by Sex
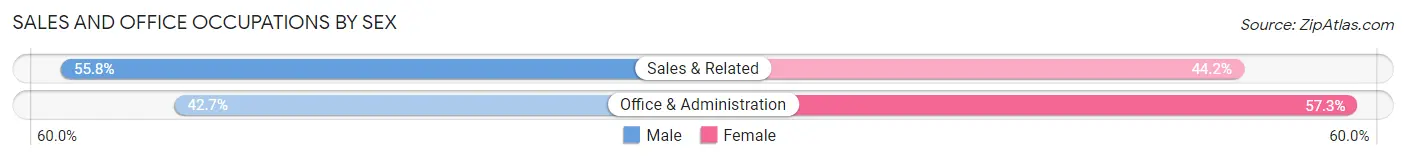
| Occupation | Male | Female |
| Sales & Related | 130 (55.8%) | 103 (44.2%) |
| Office & Administration | 73 (42.7%) | 98 (57.3%) |
| Total (Category) | 203 (50.2%) | 201 (49.7%) |
| Total (Overall) | 945 (52.7%) | 848 (47.3%) |
Natural Resources, Construction and Maintenance Occupations
The most common Natural Resources, Construction and Maintenance occupations in Berryville are Installation, Maintenance & Repair (67 | 3.7%), and Construction & Extraction (66 | 3.7%).

Natural Resources, Construction and Maintenance Occupations by Sex

| Occupation | Male | Female |
| Farming, Fishing & Forestry | 0 (0.0%) | 0 (0.0%) |
| Construction & Extraction | 66 (100.0%) | 0 (0.0%) |
| Installation, Maintenance & Repair | 67 (100.0%) | 0 (0.0%) |
| Total (Category) | 133 (100.0%) | 0 (0.0%) |
| Total (Overall) | 945 (52.7%) | 848 (47.3%) |
Production, Transportation and Moving Occupations
The most common Production, Transportation and Moving occupations in Berryville are Production (67 | 3.7%), and Material Moving (43 | 2.4%).
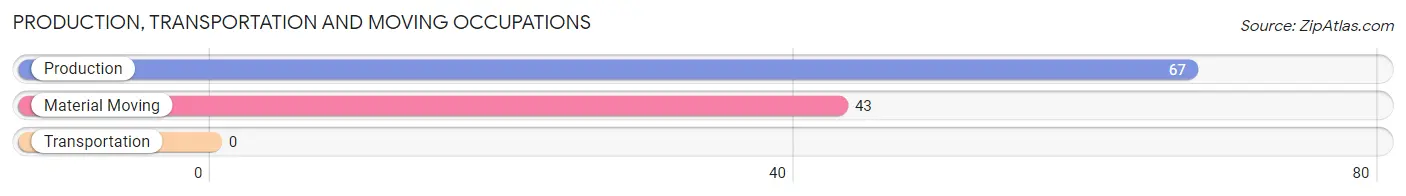
Production, Transportation and Moving Occupations by Sex
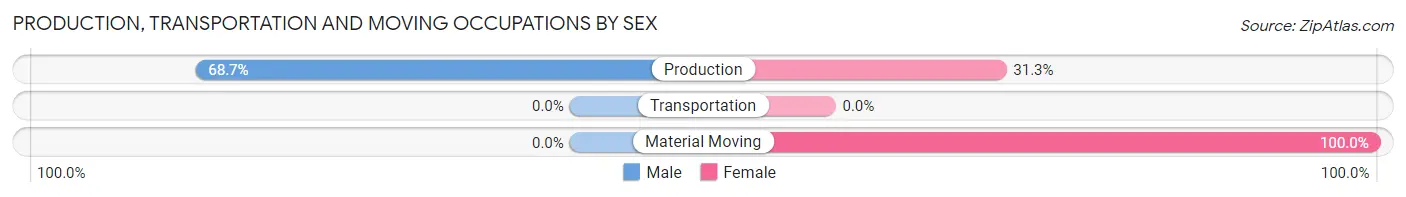
| Occupation | Male | Female |
| Production | 46 (68.7%) | 21 (31.3%) |
| Transportation | 0 (0.0%) | 0 (0.0%) |
| Material Moving | 0 (0.0%) | 43 (100.0%) |
| Total (Category) | 46 (41.8%) | 64 (58.2%) |
| Total (Overall) | 945 (52.7%) | 848 (47.3%) |
Employment Industries by Sex in Berryville
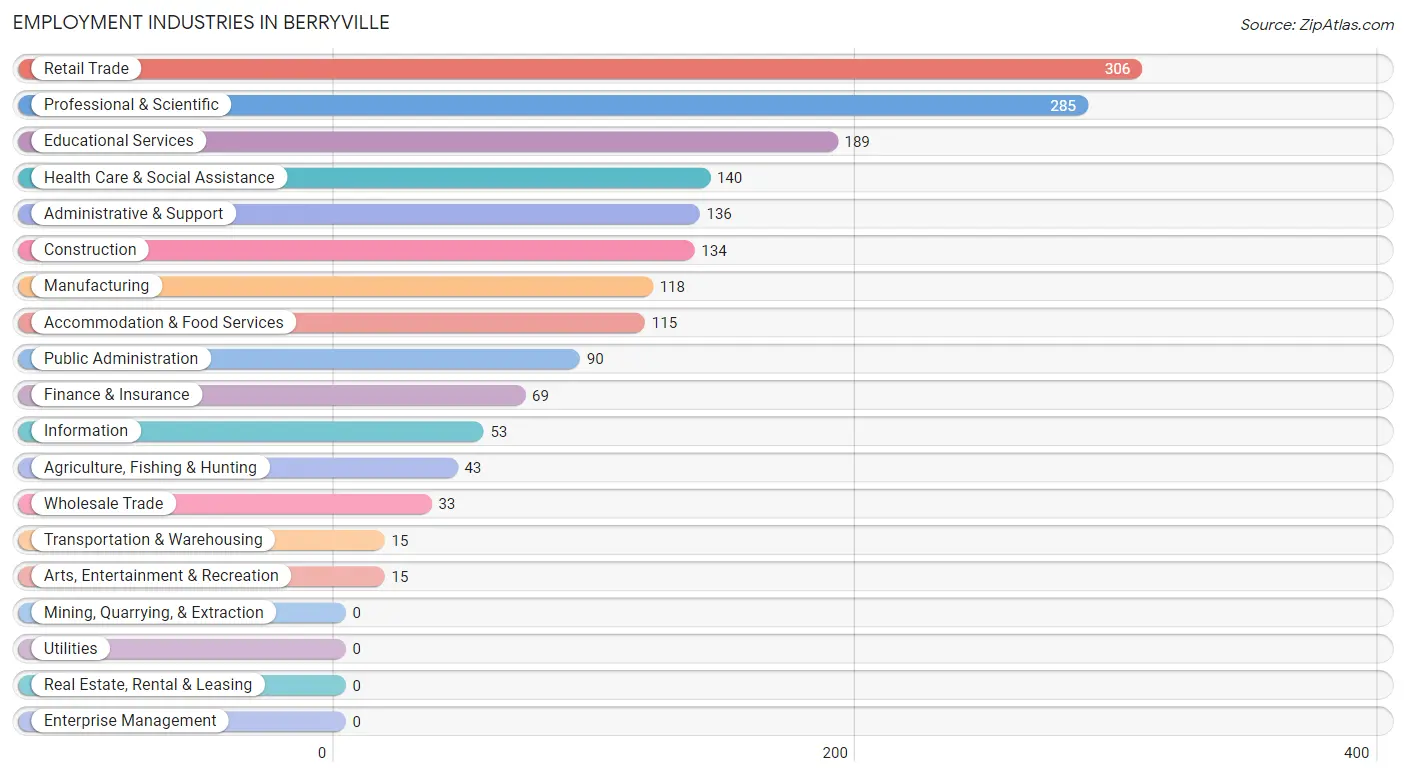
Employment Industries in Berryville
The major employment industries in Berryville include Retail Trade (306 | 17.1%), Professional & Scientific (285 | 15.9%), Educational Services (189 | 10.5%), Health Care & Social Assistance (140 | 7.8%), and Administrative & Support (136 | 7.6%).
Employment Industries by Sex in Berryville
The Berryville industries that see more men than women are Wholesale Trade (100.0%), Transportation & Warehousing (100.0%), and Arts, Entertainment & Recreation (100.0%), whereas the industries that tend to have a higher number of women are Agriculture, Fishing & Hunting (100.0%), Health Care & Social Assistance (100.0%), and Educational Services (92.1%).
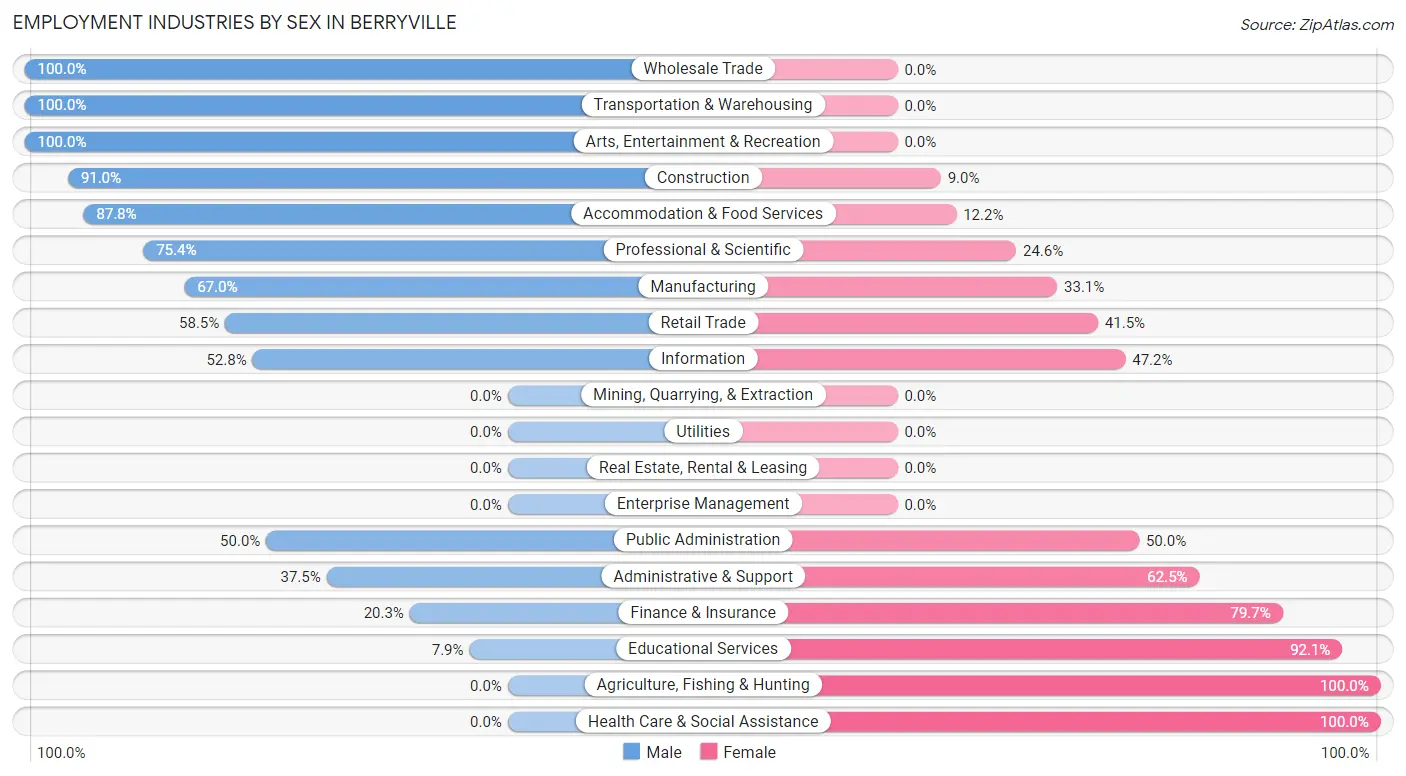
| Industry | Male | Female |
| Agriculture, Fishing & Hunting | 0 (0.0%) | 43 (100.0%) |
| Mining, Quarrying, & Extraction | 0 (0.0%) | 0 (0.0%) |
| Construction | 122 (91.0%) | 12 (9.0%) |
| Manufacturing | 79 (66.9%) | 39 (33.1%) |
| Wholesale Trade | 33 (100.0%) | 0 (0.0%) |
| Retail Trade | 179 (58.5%) | 127 (41.5%) |
| Transportation & Warehousing | 15 (100.0%) | 0 (0.0%) |
| Utilities | 0 (0.0%) | 0 (0.0%) |
| Information | 28 (52.8%) | 25 (47.2%) |
| Finance & Insurance | 14 (20.3%) | 55 (79.7%) |
| Real Estate, Rental & Leasing | 0 (0.0%) | 0 (0.0%) |
| Professional & Scientific | 215 (75.4%) | 70 (24.6%) |
| Enterprise Management | 0 (0.0%) | 0 (0.0%) |
| Administrative & Support | 51 (37.5%) | 85 (62.5%) |
| Educational Services | 15 (7.9%) | 174 (92.1%) |
| Health Care & Social Assistance | 0 (0.0%) | 140 (100.0%) |
| Arts, Entertainment & Recreation | 15 (100.0%) | 0 (0.0%) |
| Accommodation & Food Services | 101 (87.8%) | 14 (12.2%) |
| Public Administration | 45 (50.0%) | 45 (50.0%) |
| Total | 945 (52.7%) | 848 (47.3%) |
Education in Berryville
School Enrollment in Berryville
The most common levels of schooling among the 855 students in Berryville are high school (255 | 29.8%), middle school (235 | 27.5%), and elementary school (182 | 21.3%).
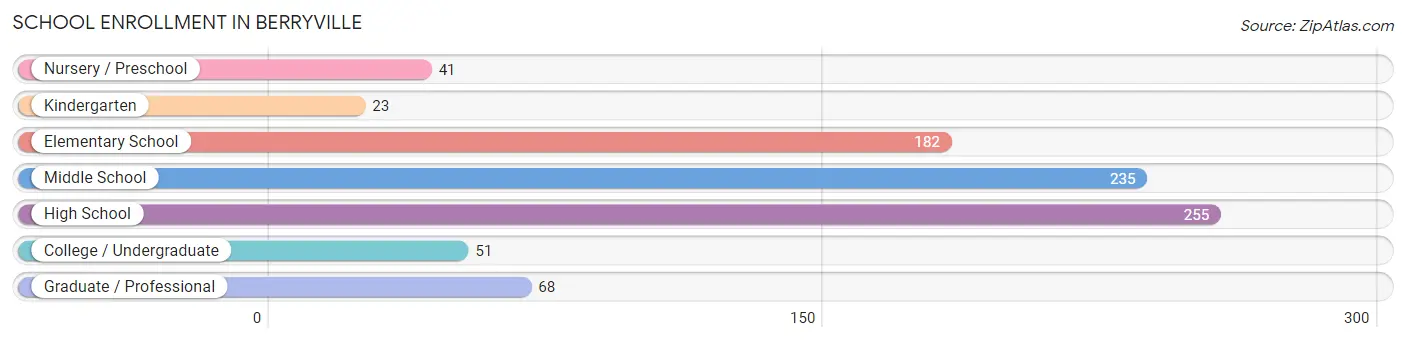
| School Level | # Students | % Students |
| Nursery / Preschool | 41 | 4.8% |
| Kindergarten | 23 | 2.7% |
| Elementary School | 182 | 21.3% |
| Middle School | 235 | 27.5% |
| High School | 255 | 29.8% |
| College / Undergraduate | 51 | 6.0% |
| Graduate / Professional | 68 | 8.0% |
| Total | 855 | 100.0% |
School Enrollment by Age by Funding Source in Berryville
Out of a total of 855 students who are enrolled in schools in Berryville, 92 (10.8%) attend a private institution, while the remaining 763 (89.2%) are enrolled in public schools. The age group of 35 years and over has the highest likelihood of being enrolled in private schools, with 63 (90.0% in the age bracket) enrolled. Conversely, the age group of 3 to 4 year olds has the lowest likelihood of being enrolled in a private school, with 41 (100.0% in the age bracket) attending a public institution.
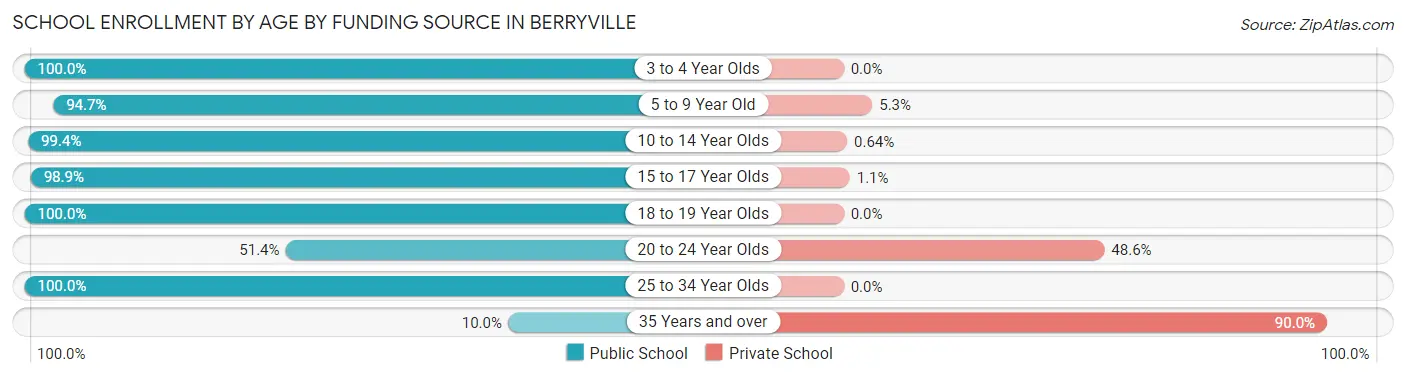
| Age Bracket | Public School | Private School |
| 3 to 4 Year Olds | 41 (100.0%) | 0 (0.0%) |
| 5 to 9 Year Old | 142 (94.7%) | 8 (5.3%) |
| 10 to 14 Year Olds | 311 (99.4%) | 2 (0.6%) |
| 15 to 17 Year Olds | 174 (98.9%) | 2 (1.1%) |
| 18 to 19 Year Olds | 58 (100.0%) | 0 (0.0%) |
| 20 to 24 Year Olds | 18 (51.4%) | 17 (48.6%) |
| 25 to 34 Year Olds | 12 (100.0%) | 0 (0.0%) |
| 35 Years and over | 7 (10.0%) | 63 (90.0%) |
| Total | 763 (89.2%) | 92 (10.8%) |
Educational Attainment by Field of Study in Berryville
Business (175 | 18.5%), education (163 | 17.2%), engineering (146 | 15.4%), social sciences (103 | 10.9%), and communications (70 | 7.4%) are the most common fields of study among 945 individuals in Berryville who have obtained a bachelor's degree or higher.
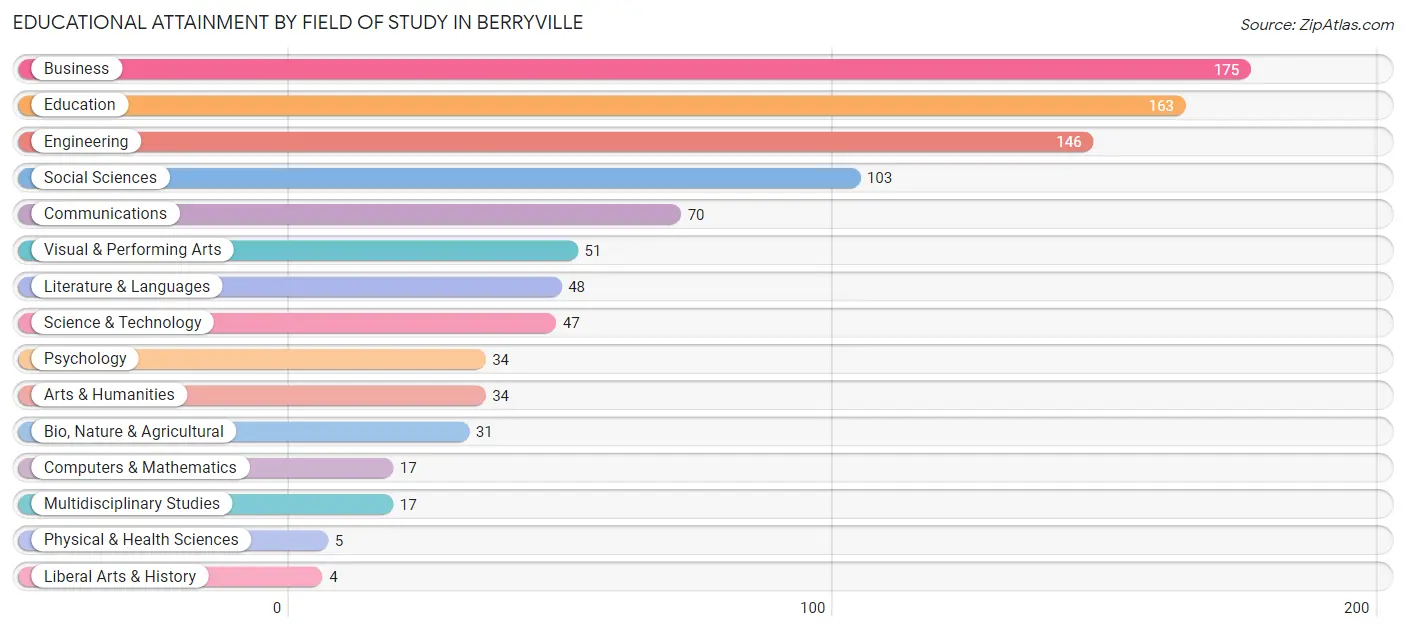
| Field of Study | # Graduates | % Graduates |
| Computers & Mathematics | 17 | 1.8% |
| Bio, Nature & Agricultural | 31 | 3.3% |
| Physical & Health Sciences | 5 | 0.5% |
| Psychology | 34 | 3.6% |
| Social Sciences | 103 | 10.9% |
| Engineering | 146 | 15.4% |
| Multidisciplinary Studies | 17 | 1.8% |
| Science & Technology | 47 | 5.0% |
| Business | 175 | 18.5% |
| Education | 163 | 17.2% |
| Literature & Languages | 48 | 5.1% |
| Liberal Arts & History | 4 | 0.4% |
| Visual & Performing Arts | 51 | 5.4% |
| Communications | 70 | 7.4% |
| Arts & Humanities | 34 | 3.6% |
| Total | 945 | 100.0% |
Transportation & Commute in Berryville
Vehicle Availability by Sex in Berryville
The most prevalent vehicle ownership categories in Berryville are males with 2 vehicles (434, accounting for 45.2%) and females with 2 vehicles (322, making up 51.8%).
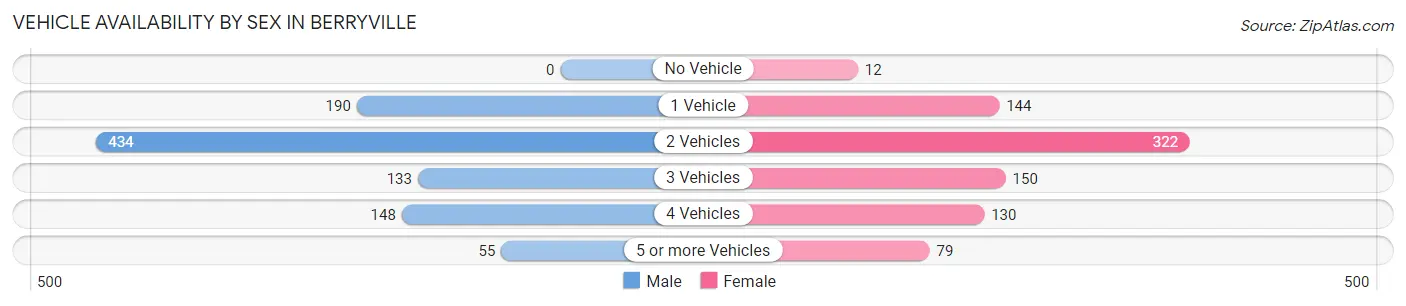
| Vehicles Available | Male | Female |
| No Vehicle | 0 (0.0%) | 12 (1.4%) |
| 1 Vehicle | 190 (19.8%) | 144 (17.2%) |
| 2 Vehicles | 434 (45.2%) | 322 (38.5%) |
| 3 Vehicles | 133 (13.9%) | 150 (17.9%) |
| 4 Vehicles | 148 (15.4%) | 130 (15.5%) |
| 5 or more Vehicles | 55 (5.7%) | 79 (9.4%) |
| Total | 960 (100.0%) | 837 (100.0%) |
Commute Time in Berryville
The most frequently occuring commute durations in Berryville are 60 to 89 minutes (357 commuters, 22.2%), 30 to 34 minutes (214 commuters, 13.3%), and 45 to 59 minutes (178 commuters, 11.1%).
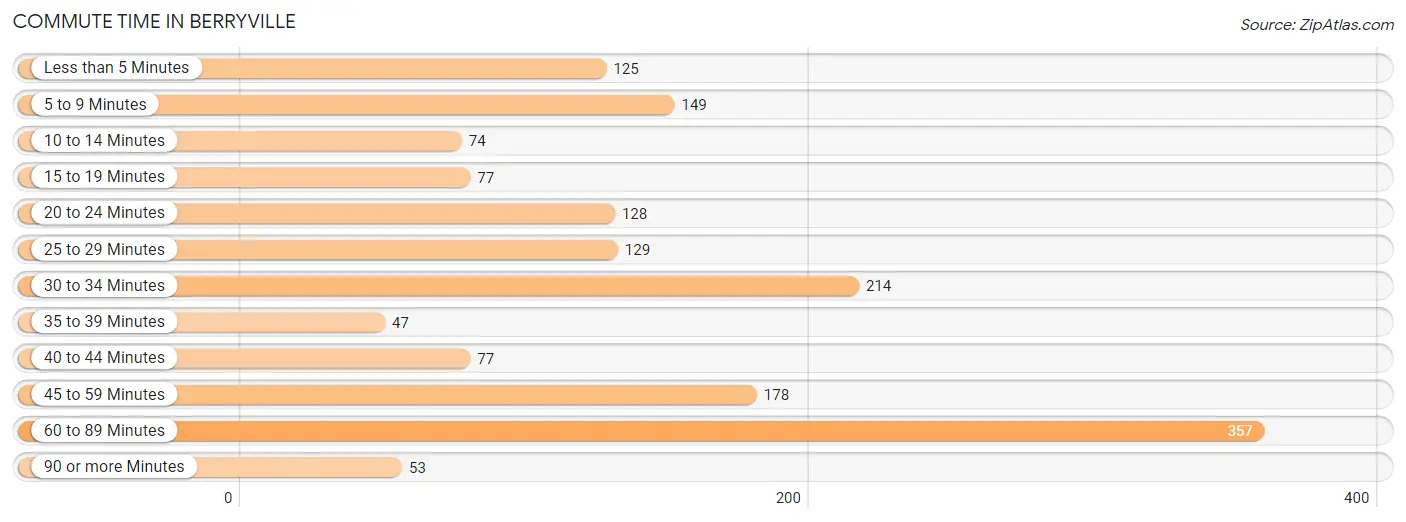
| Commute Time | # Commuters | % Commuters |
| Less than 5 Minutes | 125 | 7.8% |
| 5 to 9 Minutes | 149 | 9.3% |
| 10 to 14 Minutes | 74 | 4.6% |
| 15 to 19 Minutes | 77 | 4.8% |
| 20 to 24 Minutes | 128 | 8.0% |
| 25 to 29 Minutes | 129 | 8.0% |
| 30 to 34 Minutes | 214 | 13.3% |
| 35 to 39 Minutes | 47 | 2.9% |
| 40 to 44 Minutes | 77 | 4.8% |
| 45 to 59 Minutes | 178 | 11.1% |
| 60 to 89 Minutes | 357 | 22.2% |
| 90 or more Minutes | 53 | 3.3% |
Commute Time by Sex in Berryville
The most common commute times in Berryville are 60 to 89 minutes (206 commuters, 24.0%) for males and 60 to 89 minutes (151 commuters, 20.1%) for females.
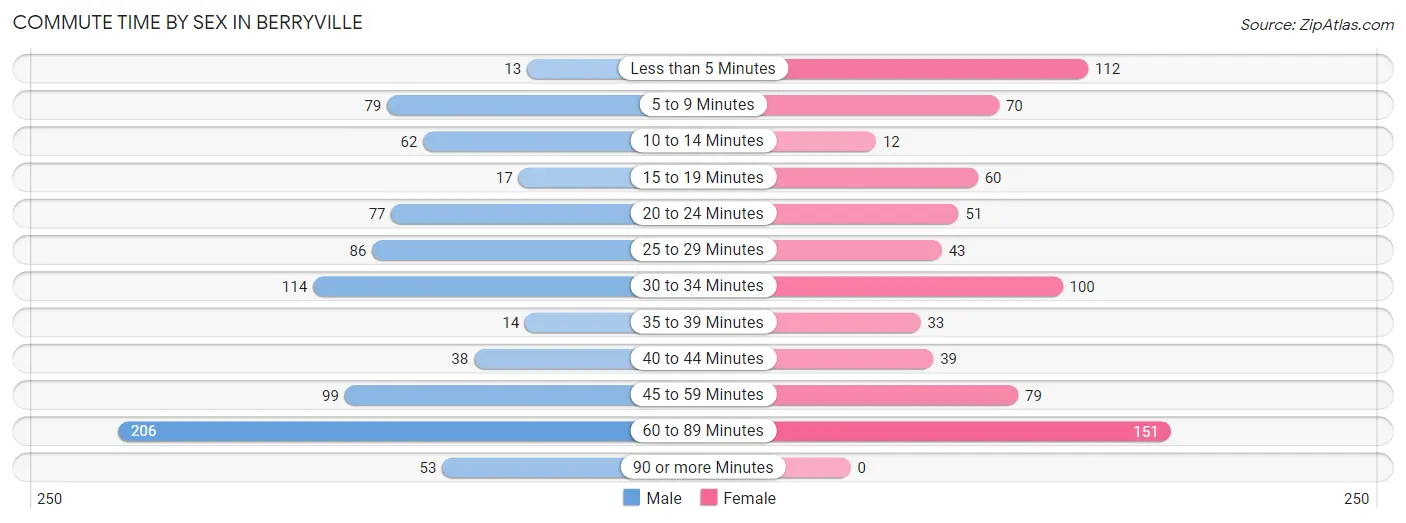
| Commute Time | Male | Female |
| Less than 5 Minutes | 13 (1.5%) | 112 (14.9%) |
| 5 to 9 Minutes | 79 (9.2%) | 70 (9.3%) |
| 10 to 14 Minutes | 62 (7.2%) | 12 (1.6%) |
| 15 to 19 Minutes | 17 (2.0%) | 60 (8.0%) |
| 20 to 24 Minutes | 77 (9.0%) | 51 (6.8%) |
| 25 to 29 Minutes | 86 (10.0%) | 43 (5.7%) |
| 30 to 34 Minutes | 114 (13.3%) | 100 (13.3%) |
| 35 to 39 Minutes | 14 (1.6%) | 33 (4.4%) |
| 40 to 44 Minutes | 38 (4.4%) | 39 (5.2%) |
| 45 to 59 Minutes | 99 (11.5%) | 79 (10.5%) |
| 60 to 89 Minutes | 206 (24.0%) | 151 (20.1%) |
| 90 or more Minutes | 53 (6.2%) | 0 (0.0%) |
Time of Departure to Work by Sex in Berryville
The most frequent times of departure to work in Berryville are 7:00 AM to 7:29 AM (133, 15.5%) for males and 7:30 AM to 7:59 AM (130, 17.3%) for females.
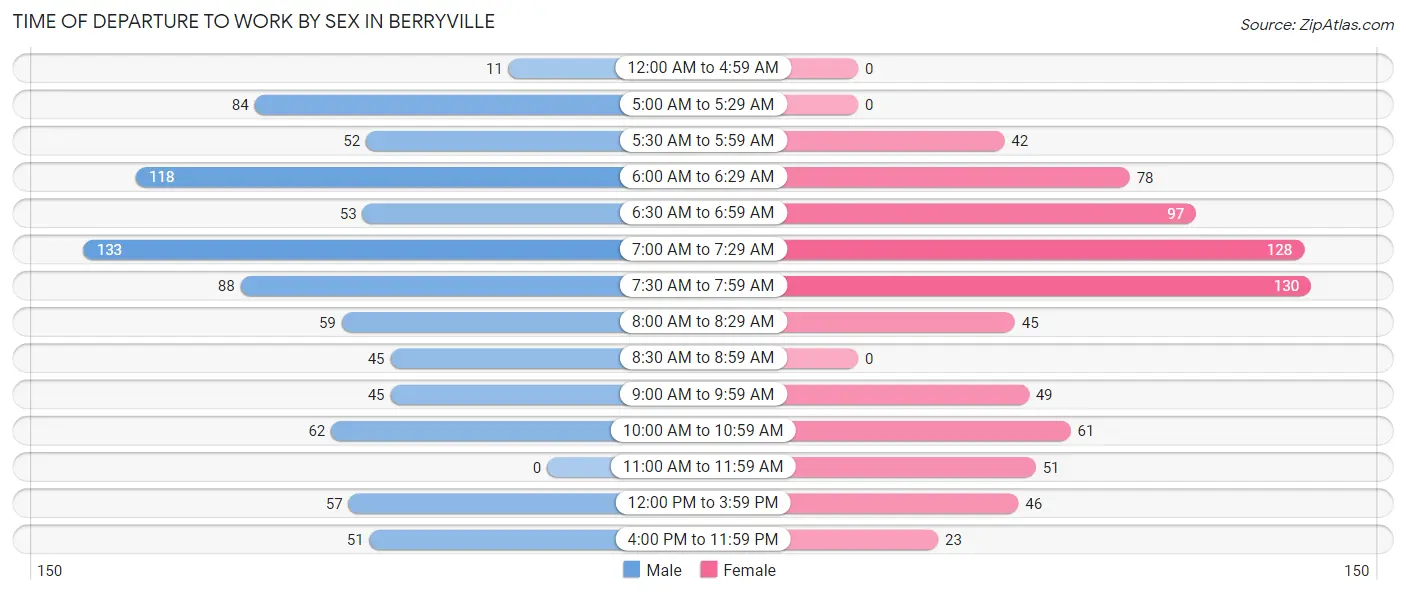
| Time of Departure | Male | Female |
| 12:00 AM to 4:59 AM | 11 (1.3%) | 0 (0.0%) |
| 5:00 AM to 5:29 AM | 84 (9.8%) | 0 (0.0%) |
| 5:30 AM to 5:59 AM | 52 (6.1%) | 42 (5.6%) |
| 6:00 AM to 6:29 AM | 118 (13.8%) | 78 (10.4%) |
| 6:30 AM to 6:59 AM | 53 (6.2%) | 97 (12.9%) |
| 7:00 AM to 7:29 AM | 133 (15.5%) | 128 (17.1%) |
| 7:30 AM to 7:59 AM | 88 (10.3%) | 130 (17.3%) |
| 8:00 AM to 8:29 AM | 59 (6.9%) | 45 (6.0%) |
| 8:30 AM to 8:59 AM | 45 (5.2%) | 0 (0.0%) |
| 9:00 AM to 9:59 AM | 45 (5.2%) | 49 (6.5%) |
| 10:00 AM to 10:59 AM | 62 (7.2%) | 61 (8.1%) |
| 11:00 AM to 11:59 AM | 0 (0.0%) | 51 (6.8%) |
| 12:00 PM to 3:59 PM | 57 (6.6%) | 46 (6.1%) |
| 4:00 PM to 11:59 PM | 51 (5.9%) | 23 (3.1%) |
| Total | 858 (100.0%) | 750 (100.0%) |
Housing Occupancy in Berryville
Occupancy by Ownership in Berryville
Of the total 1,659 dwellings in Berryville, owner-occupied units account for 1,034 (62.3%), while renter-occupied units make up 625 (37.7%).
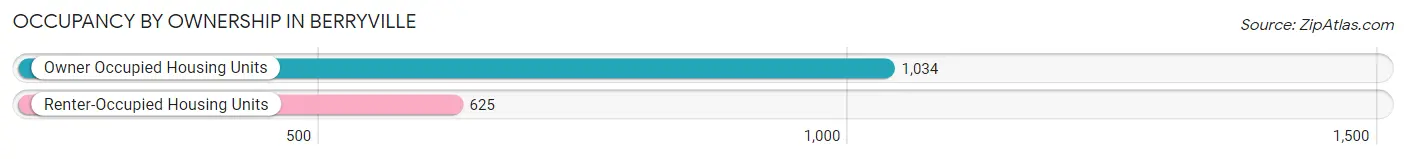
| Occupancy | # Housing Units | % Housing Units |
| Owner Occupied Housing Units | 1,034 | 62.3% |
| Renter-Occupied Housing Units | 625 | 37.7% |
| Total Occupied Housing Units | 1,659 | 100.0% |
Occupancy by Household Size in Berryville
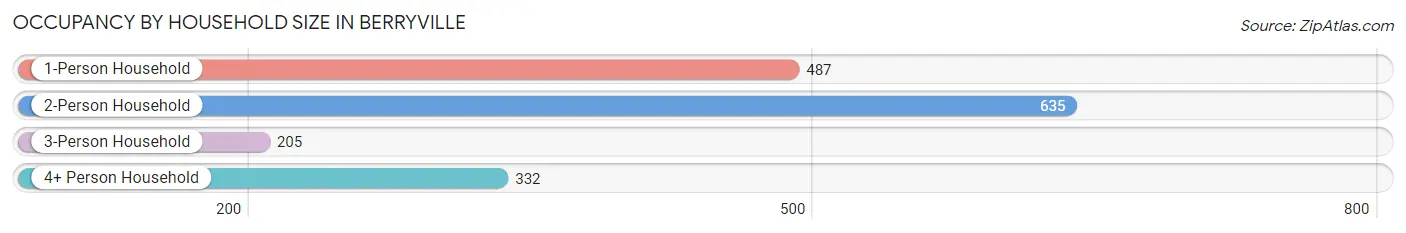
| Household Size | # Housing Units | % Housing Units |
| 1-Person Household | 487 | 29.4% |
| 2-Person Household | 635 | 38.3% |
| 3-Person Household | 205 | 12.4% |
| 4+ Person Household | 332 | 20.0% |
| Total Housing Units | 1,659 | 100.0% |
Occupancy by Ownership by Household Size in Berryville
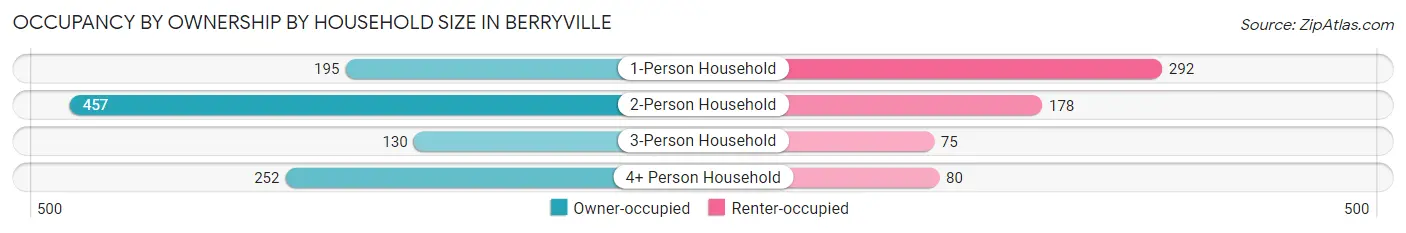
| Household Size | Owner-occupied | Renter-occupied |
| 1-Person Household | 195 (40.0%) | 292 (60.0%) |
| 2-Person Household | 457 (72.0%) | 178 (28.0%) |
| 3-Person Household | 130 (63.4%) | 75 (36.6%) |
| 4+ Person Household | 252 (75.9%) | 80 (24.1%) |
| Total Housing Units | 1,034 (62.3%) | 625 (37.7%) |
Occupancy by Educational Attainment in Berryville
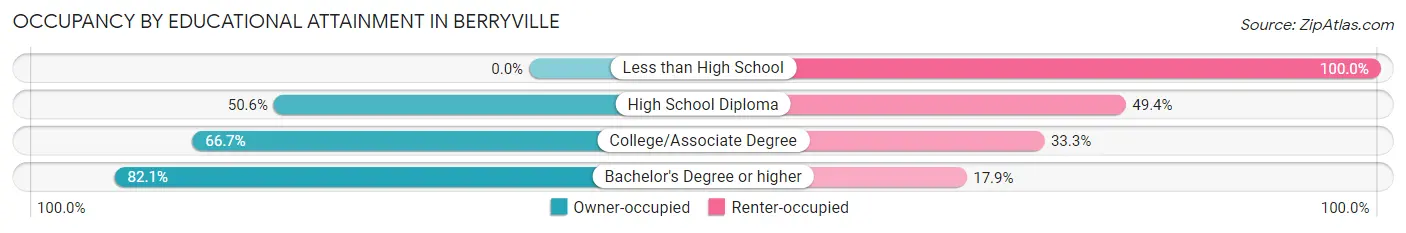
| Household Size | Owner-occupied | Renter-occupied |
| Less than High School | 0 (0.0%) | 112 (100.0%) |
| High School Diploma | 252 (50.6%) | 246 (49.4%) |
| College/Associate Degree | 345 (66.7%) | 172 (33.3%) |
| Bachelor's Degree or higher | 437 (82.1%) | 95 (17.9%) |
Occupancy by Age of Householder in Berryville
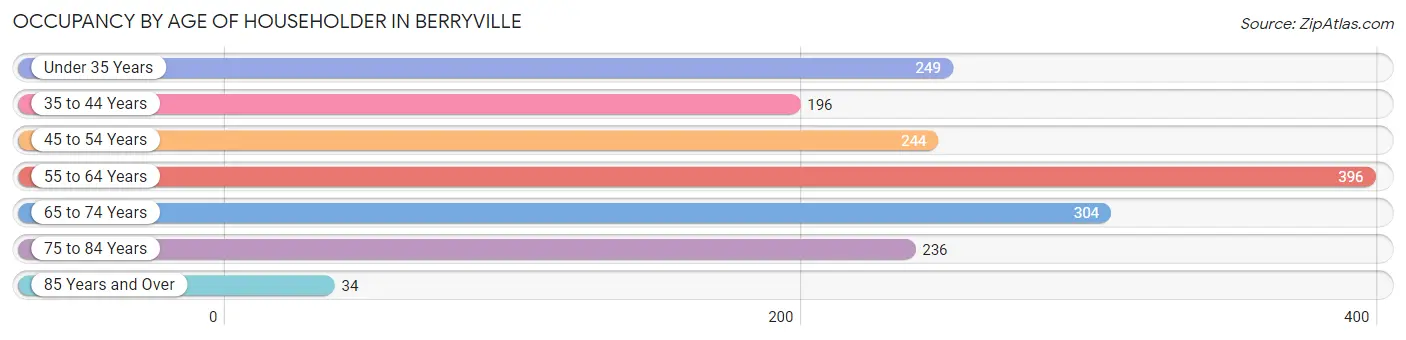
| Age Bracket | # Households | % Households |
| Under 35 Years | 249 | 15.0% |
| 35 to 44 Years | 196 | 11.8% |
| 45 to 54 Years | 244 | 14.7% |
| 55 to 64 Years | 396 | 23.9% |
| 65 to 74 Years | 304 | 18.3% |
| 75 to 84 Years | 236 | 14.2% |
| 85 Years and Over | 34 | 2.1% |
| Total | 1,659 | 100.0% |
Housing Finances in Berryville
Median Income by Occupancy in Berryville
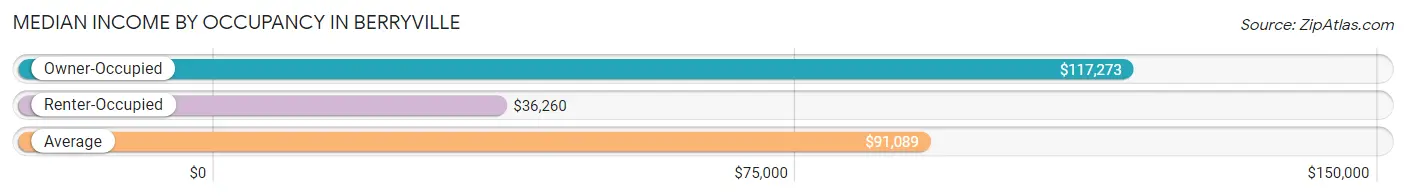
| Occupancy Type | # Households | Median Income |
| Owner-Occupied | 1,034 (62.3%) | $117,273 |
| Renter-Occupied | 625 (37.7%) | $36,260 |
| Average | 1,659 (100.0%) | $91,089 |
Occupancy by Householder Income Bracket in Berryville
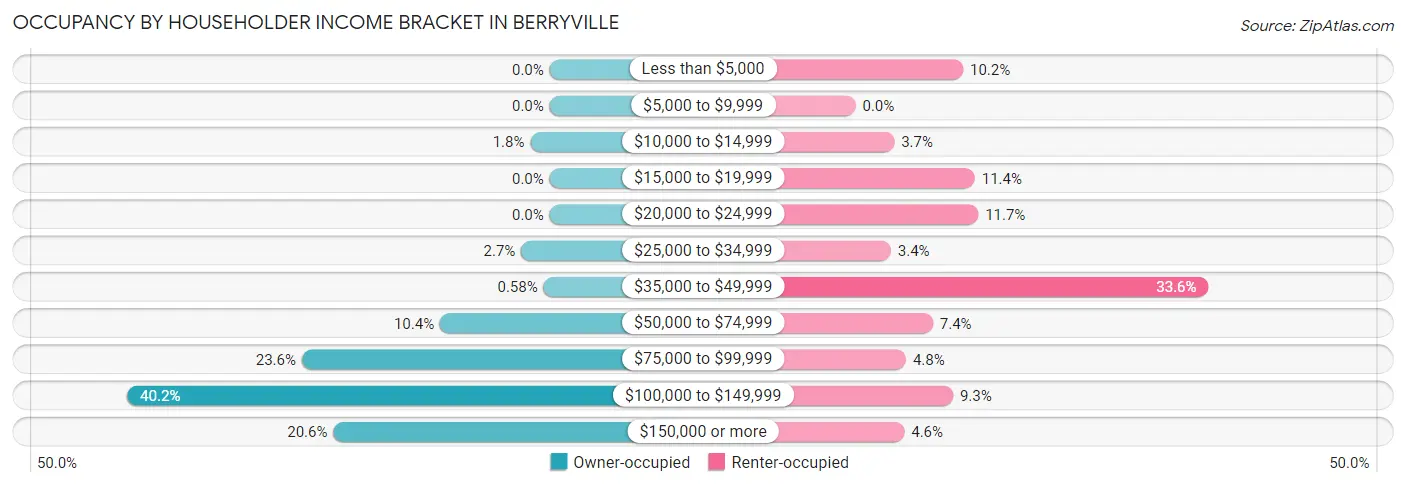
| Income Bracket | Owner-occupied | Renter-occupied |
| Less than $5,000 | 0 (0.0%) | 64 (10.2%) |
| $5,000 to $9,999 | 0 (0.0%) | 0 (0.0%) |
| $10,000 to $14,999 | 19 (1.8%) | 23 (3.7%) |
| $15,000 to $19,999 | 0 (0.0%) | 71 (11.4%) |
| $20,000 to $24,999 | 0 (0.0%) | 73 (11.7%) |
| $25,000 to $34,999 | 28 (2.7%) | 21 (3.4%) |
| $35,000 to $49,999 | 6 (0.6%) | 210 (33.6%) |
| $50,000 to $74,999 | 108 (10.4%) | 46 (7.4%) |
| $75,000 to $99,999 | 244 (23.6%) | 30 (4.8%) |
| $100,000 to $149,999 | 416 (40.2%) | 58 (9.3%) |
| $150,000 or more | 213 (20.6%) | 29 (4.6%) |
| Total | 1,034 (100.0%) | 625 (100.0%) |
Monthly Housing Cost Tiers in Berryville
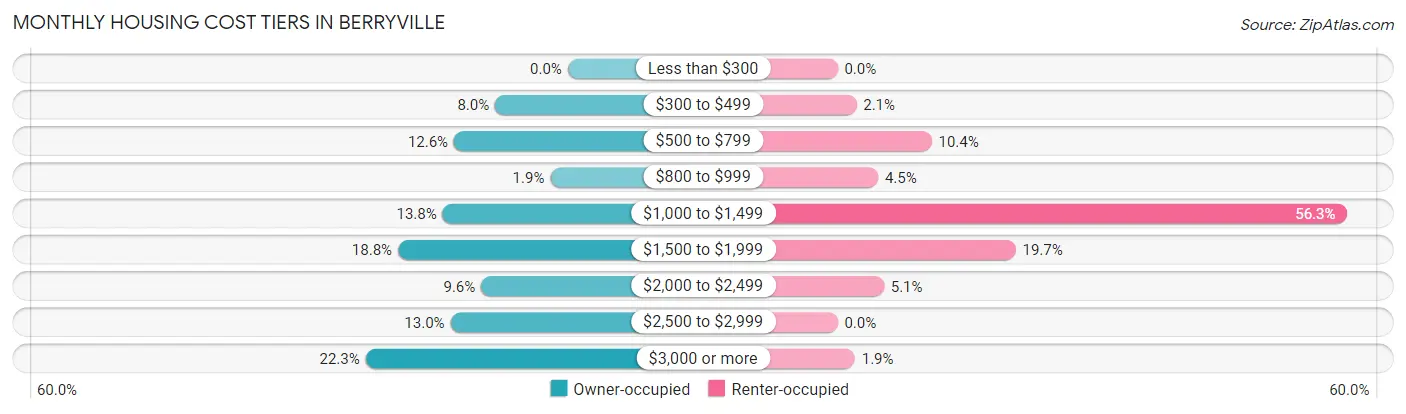
| Monthly Cost | Owner-occupied | Renter-occupied |
| Less than $300 | 0 (0.0%) | 0 (0.0%) |
| $300 to $499 | 83 (8.0%) | 13 (2.1%) |
| $500 to $799 | 130 (12.6%) | 65 (10.4%) |
| $800 to $999 | 20 (1.9%) | 28 (4.5%) |
| $1,000 to $1,499 | 143 (13.8%) | 352 (56.3%) |
| $1,500 to $1,999 | 194 (18.8%) | 123 (19.7%) |
| $2,000 to $2,499 | 99 (9.6%) | 32 (5.1%) |
| $2,500 to $2,999 | 134 (13.0%) | 0 (0.0%) |
| $3,000 or more | 231 (22.3%) | 12 (1.9%) |
| Total | 1,034 (100.0%) | 625 (100.0%) |
Physical Housing Characteristics in Berryville
Housing Structures in Berryville
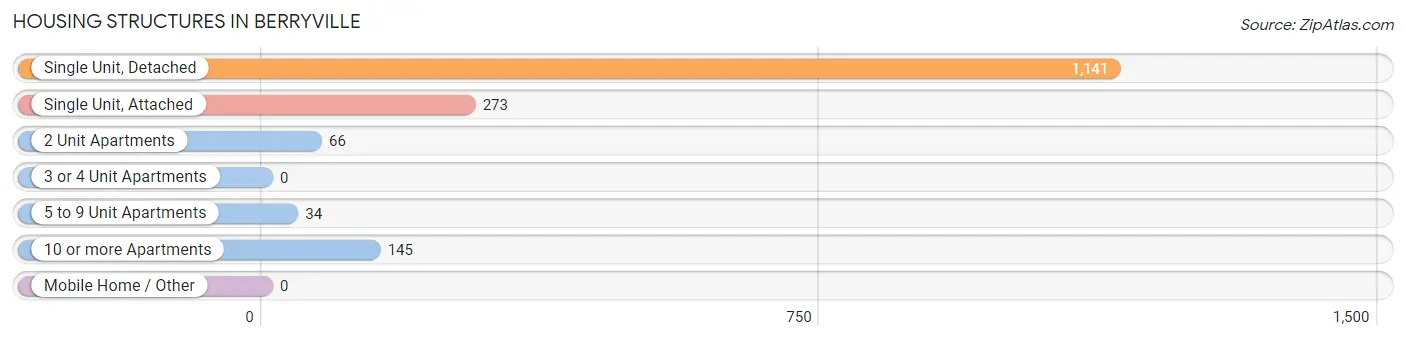
| Structure Type | # Housing Units | % Housing Units |
| Single Unit, Detached | 1,141 | 68.8% |
| Single Unit, Attached | 273 | 16.5% |
| 2 Unit Apartments | 66 | 4.0% |
| 3 or 4 Unit Apartments | 0 | 0.0% |
| 5 to 9 Unit Apartments | 34 | 2.1% |
| 10 or more Apartments | 145 | 8.7% |
| Mobile Home / Other | 0 | 0.0% |
| Total | 1,659 | 100.0% |
Housing Structures by Occupancy in Berryville
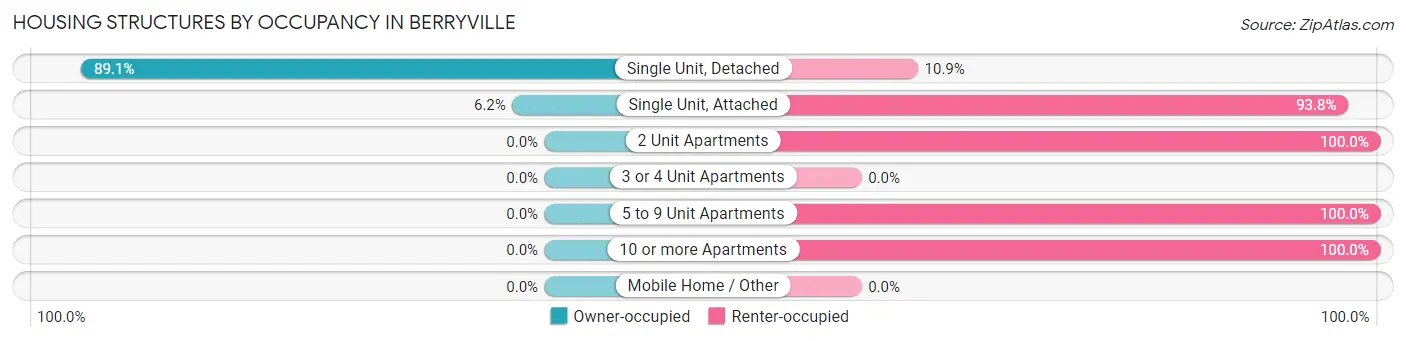
| Structure Type | Owner-occupied | Renter-occupied |
| Single Unit, Detached | 1,017 (89.1%) | 124 (10.9%) |
| Single Unit, Attached | 17 (6.2%) | 256 (93.8%) |
| 2 Unit Apartments | 0 (0.0%) | 66 (100.0%) |
| 3 or 4 Unit Apartments | 0 (0.0%) | 0 (0.0%) |
| 5 to 9 Unit Apartments | 0 (0.0%) | 34 (100.0%) |
| 10 or more Apartments | 0 (0.0%) | 145 (100.0%) |
| Mobile Home / Other | 0 (0.0%) | 0 (0.0%) |
| Total | 1,034 (62.3%) | 625 (37.7%) |
Housing Structures by Number of Rooms in Berryville
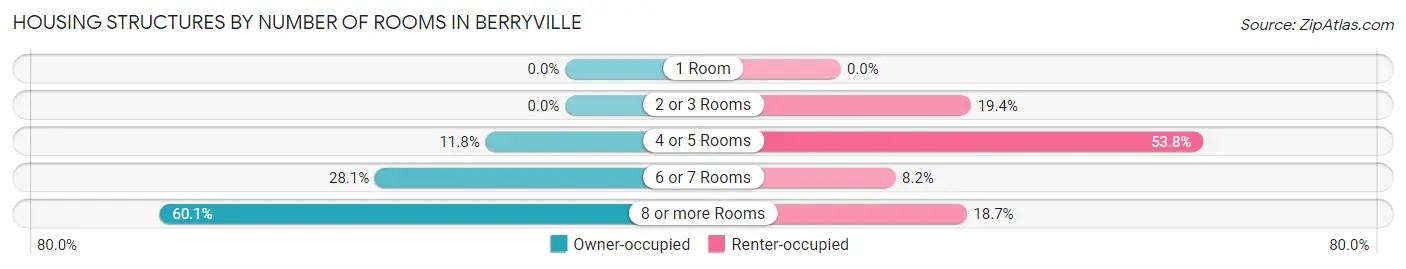
| Number of Rooms | Owner-occupied | Renter-occupied |
| 1 Room | 0 (0.0%) | 0 (0.0%) |
| 2 or 3 Rooms | 0 (0.0%) | 121 (19.4%) |
| 4 or 5 Rooms | 122 (11.8%) | 336 (53.8%) |
| 6 or 7 Rooms | 291 (28.1%) | 51 (8.2%) |
| 8 or more Rooms | 621 (60.1%) | 117 (18.7%) |
| Total | 1,034 (100.0%) | 625 (100.0%) |
Housing Structure by Heating Type in Berryville
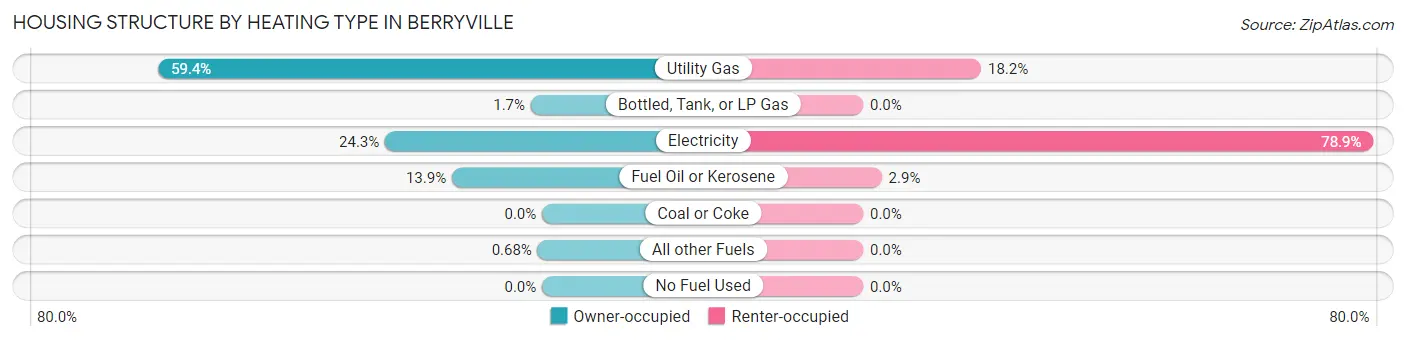
| Heating Type | Owner-occupied | Renter-occupied |
| Utility Gas | 614 (59.4%) | 114 (18.2%) |
| Bottled, Tank, or LP Gas | 18 (1.7%) | 0 (0.0%) |
| Electricity | 251 (24.3%) | 493 (78.9%) |
| Fuel Oil or Kerosene | 144 (13.9%) | 18 (2.9%) |
| Coal or Coke | 0 (0.0%) | 0 (0.0%) |
| All other Fuels | 7 (0.7%) | 0 (0.0%) |
| No Fuel Used | 0 (0.0%) | 0 (0.0%) |
| Total | 1,034 (100.0%) | 625 (100.0%) |
Household Vehicle Usage in Berryville
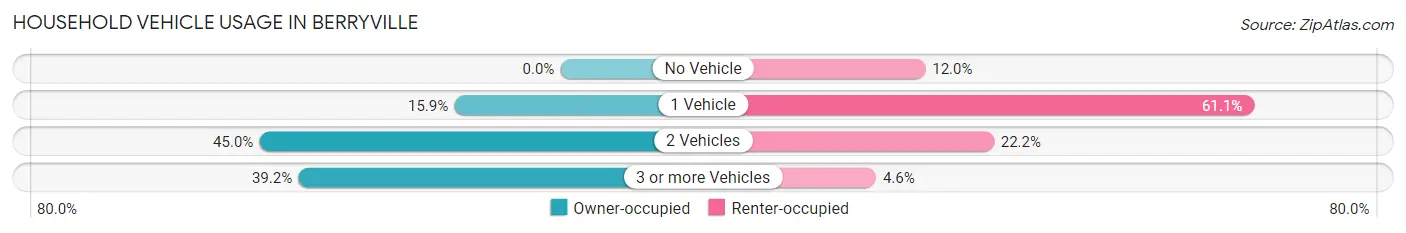
| Vehicles per Household | Owner-occupied | Renter-occupied |
| No Vehicle | 0 (0.0%) | 75 (12.0%) |
| 1 Vehicle | 164 (15.9%) | 382 (61.1%) |
| 2 Vehicles | 465 (45.0%) | 139 (22.2%) |
| 3 or more Vehicles | 405 (39.2%) | 29 (4.6%) |
| Total | 1,034 (100.0%) | 625 (100.0%) |
Real Estate & Mortgages in Berryville
Real Estate and Mortgage Overview in Berryville
| Characteristic | Without Mortgage | With Mortgage |
| Housing Units | 200 | 834 |
| Median Property Value | $405,700 | $510,200 |
| Median Household Income | $91,389 | $160 |
| Monthly Housing Costs | $524 | $231 |
| Real Estate Taxes | $1,929 | $0 |
Property Value by Mortgage Status in Berryville
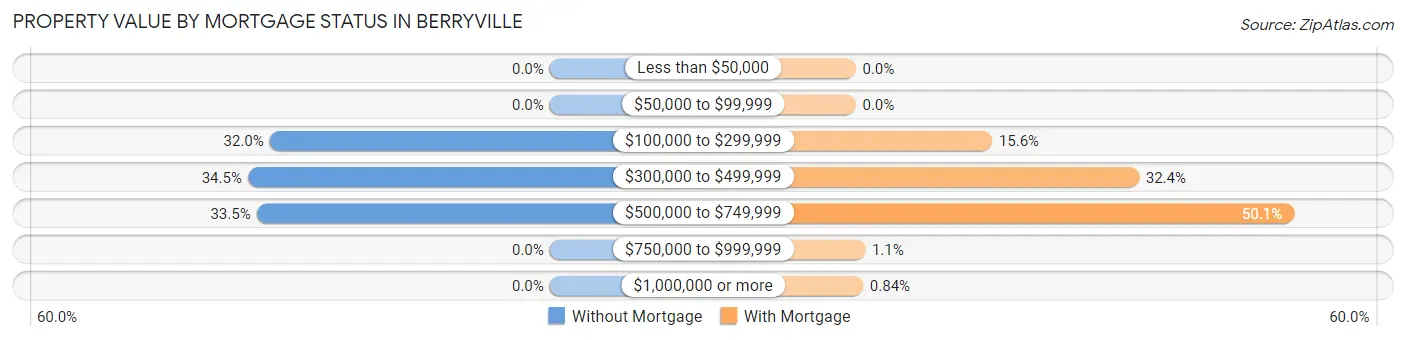
| Property Value | Without Mortgage | With Mortgage |
| Less than $50,000 | 0 (0.0%) | 0 (0.0%) |
| $50,000 to $99,999 | 0 (0.0%) | 0 (0.0%) |
| $100,000 to $299,999 | 64 (32.0%) | 130 (15.6%) |
| $300,000 to $499,999 | 69 (34.5%) | 270 (32.4%) |
| $500,000 to $749,999 | 67 (33.5%) | 418 (50.1%) |
| $750,000 to $999,999 | 0 (0.0%) | 9 (1.1%) |
| $1,000,000 or more | 0 (0.0%) | 7 (0.8%) |
| Total | 200 (100.0%) | 834 (100.0%) |
Household Income by Mortgage Status in Berryville
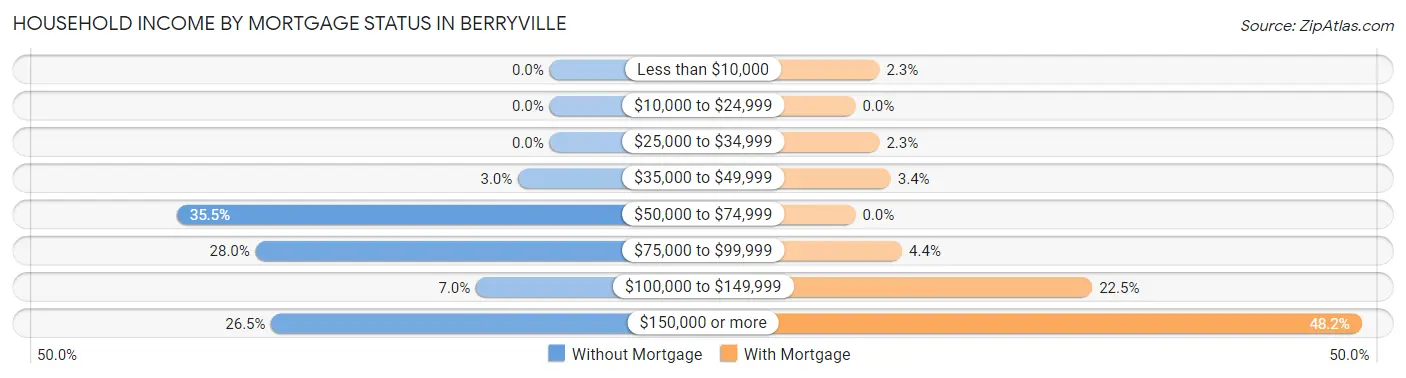
| Household Income | Without Mortgage | With Mortgage |
| Less than $10,000 | 0 (0.0%) | 19 (2.3%) |
| $10,000 to $24,999 | 0 (0.0%) | 0 (0.0%) |
| $25,000 to $34,999 | 0 (0.0%) | 19 (2.3%) |
| $35,000 to $49,999 | 6 (3.0%) | 28 (3.4%) |
| $50,000 to $74,999 | 71 (35.5%) | 0 (0.0%) |
| $75,000 to $99,999 | 56 (28.0%) | 37 (4.4%) |
| $100,000 to $149,999 | 14 (7.0%) | 188 (22.5%) |
| $150,000 or more | 53 (26.5%) | 402 (48.2%) |
| Total | 200 (100.0%) | 834 (100.0%) |
Property Value to Household Income Ratio in Berryville
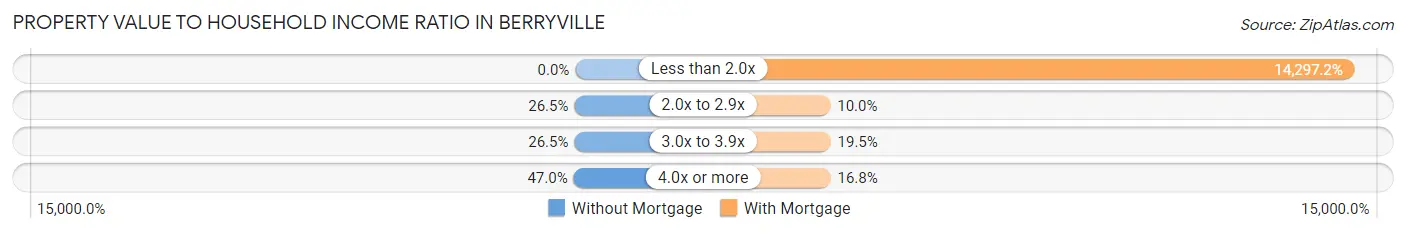
| Value-to-Income Ratio | Without Mortgage | With Mortgage |
| Less than 2.0x | 0 (0.0%) | 119,239 (14,297.2%) |
| 2.0x to 2.9x | 53 (26.5%) | 83 (10.0%) |
| 3.0x to 3.9x | 53 (26.5%) | 163 (19.5%) |
| 4.0x or more | 94 (47.0%) | 140 (16.8%) |
| Total | 200 (100.0%) | 834 (100.0%) |
Real Estate Taxes by Mortgage Status in Berryville
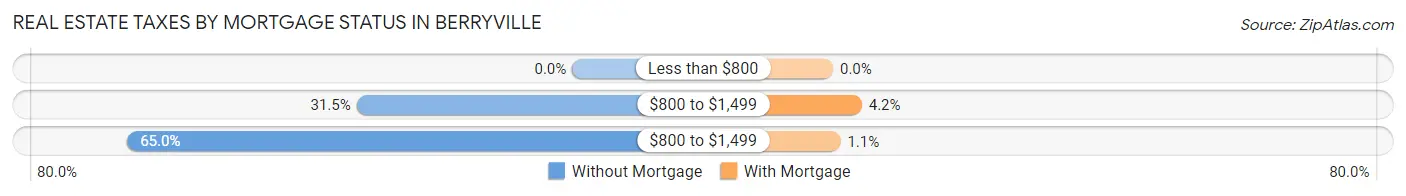
| Property Taxes | Without Mortgage | With Mortgage |
| Less than $800 | 0 (0.0%) | 0 (0.0%) |
| $800 to $1,499 | 63 (31.5%) | 35 (4.2%) |
| $800 to $1,499 | 130 (65.0%) | 9 (1.1%) |
| Total | 200 (100.0%) | 834 (100.0%) |
Health & Disability in Berryville
Health Insurance Coverage by Age in Berryville
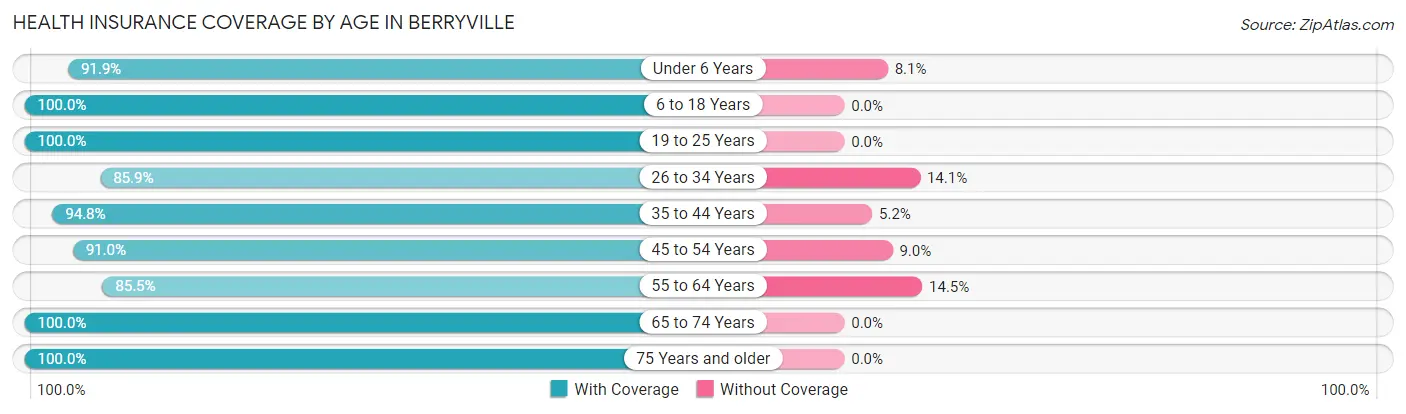
| Age Bracket | With Coverage | Without Coverage |
| Under 6 Years | 216 (91.9%) | 19 (8.1%) |
| 6 to 18 Years | 720 (100.0%) | 0 (0.0%) |
| 19 to 25 Years | 280 (100.0%) | 0 (0.0%) |
| 26 to 34 Years | 414 (85.9%) | 68 (14.1%) |
| 35 to 44 Years | 366 (94.8%) | 20 (5.2%) |
| 45 to 54 Years | 527 (91.0%) | 52 (9.0%) |
| 55 to 64 Years | 589 (85.5%) | 100 (14.5%) |
| 65 to 74 Years | 594 (100.0%) | 0 (0.0%) |
| 75 Years and older | 460 (100.0%) | 0 (0.0%) |
| Total | 4,166 (94.2%) | 259 (5.9%) |
Health Insurance Coverage by Citizenship Status in Berryville
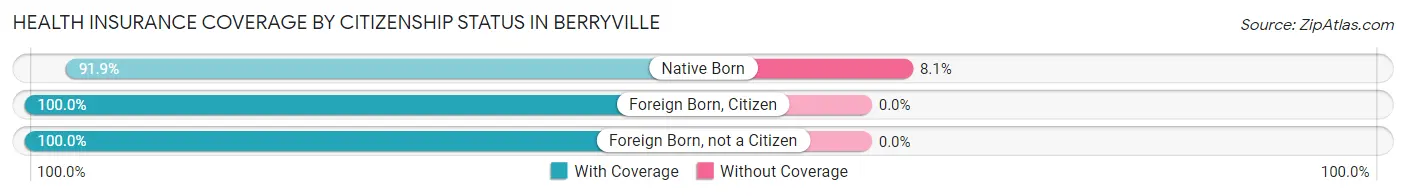
| Citizenship Status | With Coverage | Without Coverage |
| Native Born | 216 (91.9%) | 19 (8.1%) |
| Foreign Born, Citizen | 720 (100.0%) | 0 (0.0%) |
| Foreign Born, not a Citizen | 280 (100.0%) | 0 (0.0%) |
Health Insurance Coverage by Household Income in Berryville
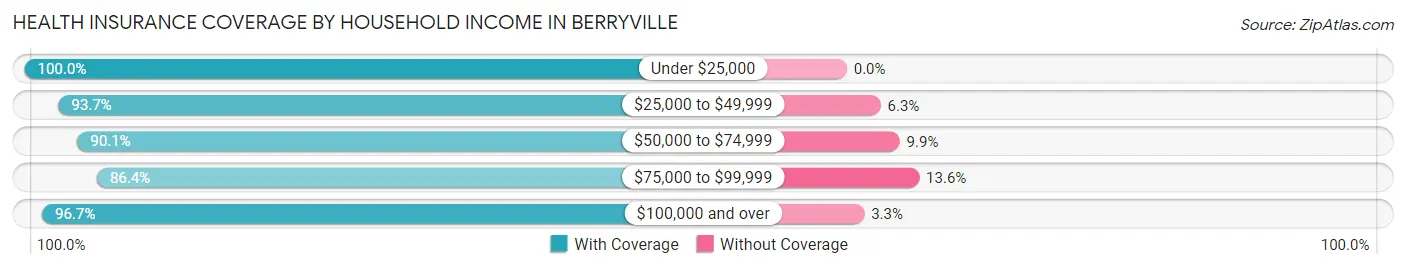
| Household Income | With Coverage | Without Coverage |
| Under $25,000 | 412 (100.0%) | 0 (0.0%) |
| $25,000 to $49,999 | 399 (93.7%) | 27 (6.3%) |
| $50,000 to $74,999 | 355 (90.1%) | 39 (9.9%) |
| $75,000 to $99,999 | 746 (86.4%) | 117 (13.6%) |
| $100,000 and over | 2,250 (96.7%) | 76 (3.3%) |
Public vs Private Health Insurance Coverage by Age in Berryville
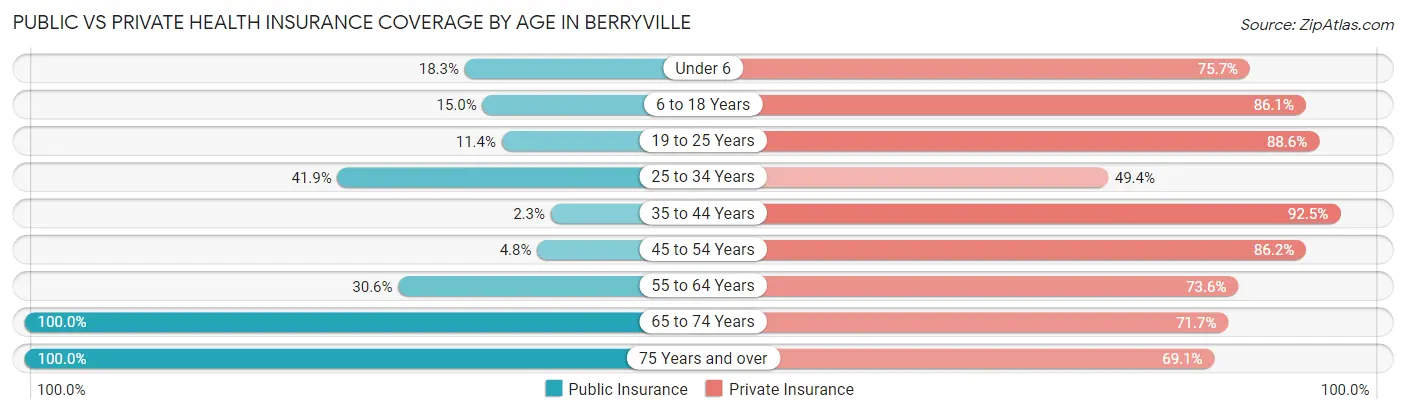
| Age Bracket | Public Insurance | Private Insurance |
| Under 6 | 43 (18.3%) | 178 (75.7%) |
| 6 to 18 Years | 108 (15.0%) | 620 (86.1%) |
| 19 to 25 Years | 32 (11.4%) | 248 (88.6%) |
| 25 to 34 Years | 202 (41.9%) | 238 (49.4%) |
| 35 to 44 Years | 9 (2.3%) | 357 (92.5%) |
| 45 to 54 Years | 28 (4.8%) | 499 (86.2%) |
| 55 to 64 Years | 211 (30.6%) | 507 (73.6%) |
| 65 to 74 Years | 594 (100.0%) | 426 (71.7%) |
| 75 Years and over | 460 (100.0%) | 318 (69.1%) |
| Total | 1,687 (38.1%) | 3,391 (76.6%) |
Disability Status by Sex by Age in Berryville
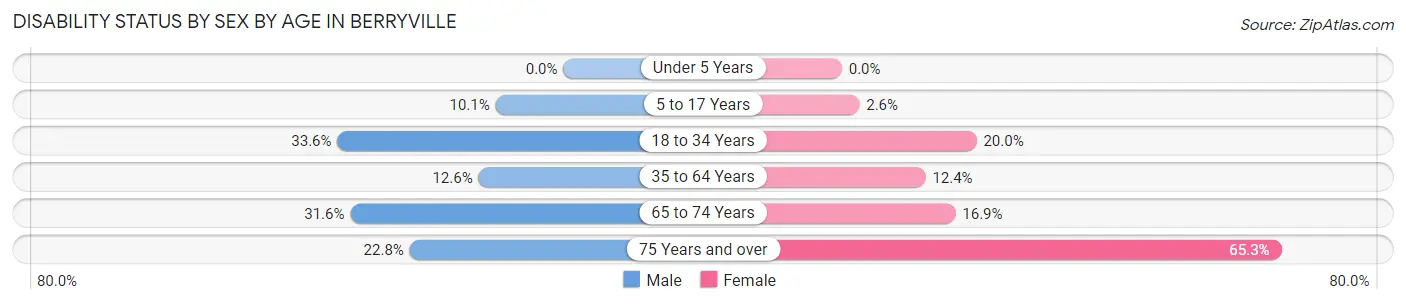
| Age Bracket | Male | Female |
| Under 5 Years | 0 (0.0%) | 0 (0.0%) |
| 5 to 17 Years | 29 (10.1%) | 11 (2.6%) |
| 18 to 34 Years | 147 (33.6%) | 76 (20.0%) |
| 35 to 64 Years | 114 (12.6%) | 93 (12.4%) |
| 65 to 74 Years | 81 (31.6%) | 57 (16.9%) |
| 75 Years and over | 34 (22.8%) | 203 (65.3%) |
Disability Class by Sex by Age in Berryville
Disability Class: Hearing Difficulty
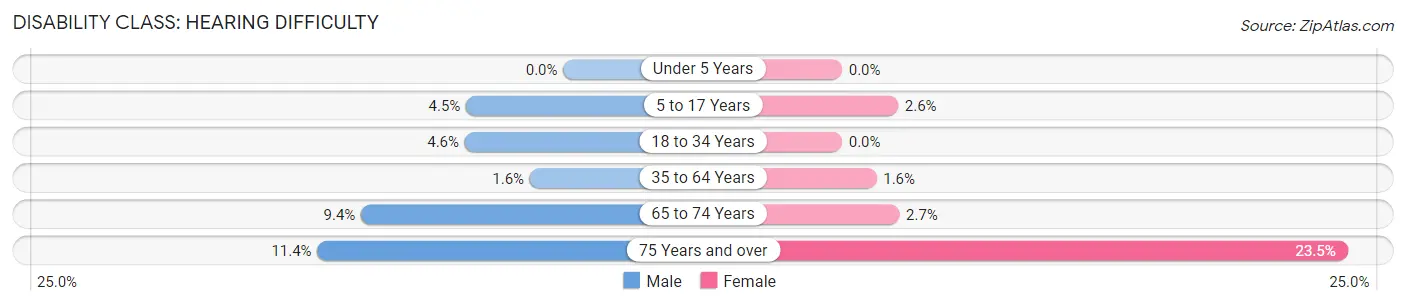
| Age Bracket | Male | Female |
| Under 5 Years | 0 (0.0%) | 0 (0.0%) |
| 5 to 17 Years | 13 (4.5%) | 11 (2.6%) |
| 18 to 34 Years | 20 (4.6%) | 0 (0.0%) |
| 35 to 64 Years | 14 (1.5%) | 12 (1.6%) |
| 65 to 74 Years | 24 (9.4%) | 9 (2.7%) |
| 75 Years and over | 17 (11.4%) | 73 (23.5%) |
Disability Class: Vision Difficulty
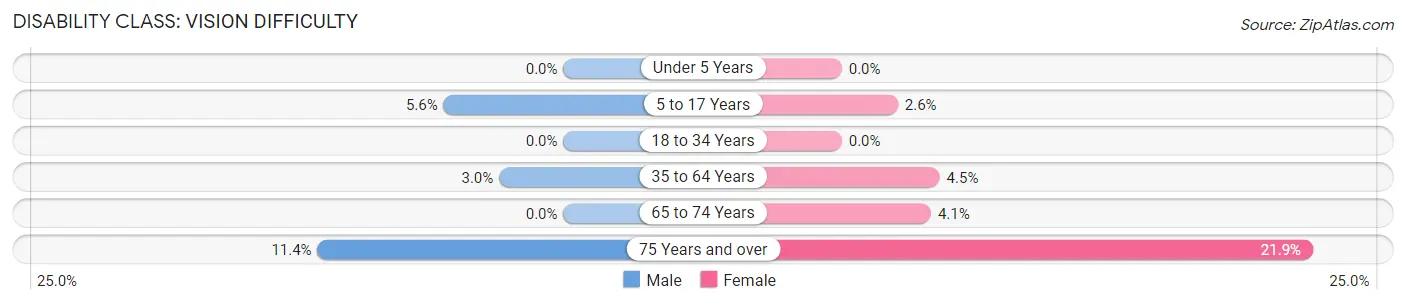
| Age Bracket | Male | Female |
| Under 5 Years | 0 (0.0%) | 0 (0.0%) |
| 5 to 17 Years | 16 (5.6%) | 11 (2.6%) |
| 18 to 34 Years | 0 (0.0%) | 0 (0.0%) |
| 35 to 64 Years | 27 (3.0%) | 34 (4.5%) |
| 65 to 74 Years | 0 (0.0%) | 14 (4.1%) |
| 75 Years and over | 17 (11.4%) | 68 (21.9%) |
Disability Class: Cognitive Difficulty
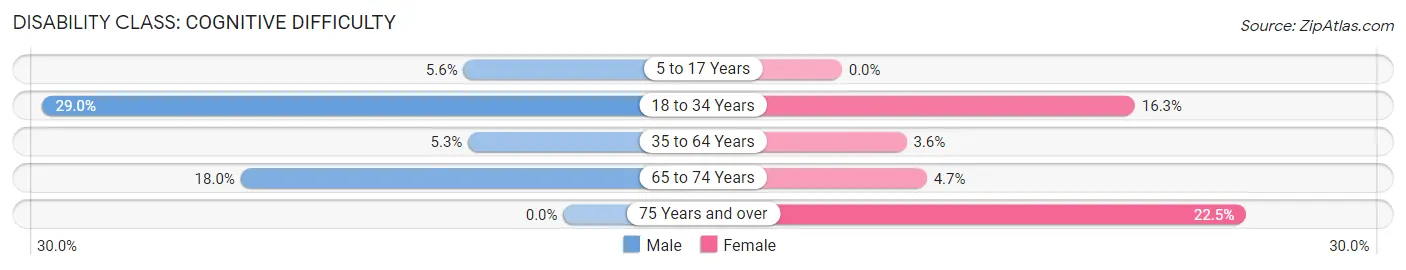
| Age Bracket | Male | Female |
| 5 to 17 Years | 16 (5.6%) | 0 (0.0%) |
| 18 to 34 Years | 127 (29.0%) | 62 (16.3%) |
| 35 to 64 Years | 48 (5.3%) | 27 (3.6%) |
| 65 to 74 Years | 46 (18.0%) | 16 (4.7%) |
| 75 Years and over | 0 (0.0%) | 70 (22.5%) |
Disability Class: Ambulatory Difficulty
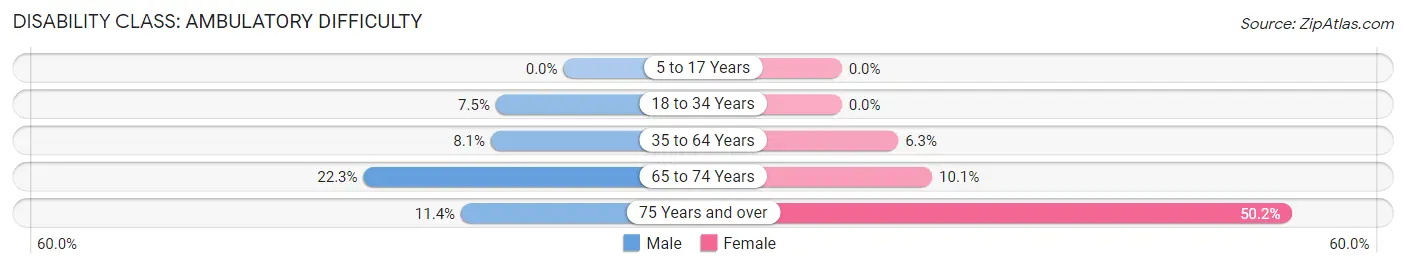
| Age Bracket | Male | Female |
| 5 to 17 Years | 0 (0.0%) | 0 (0.0%) |
| 18 to 34 Years | 33 (7.5%) | 0 (0.0%) |
| 35 to 64 Years | 73 (8.1%) | 47 (6.3%) |
| 65 to 74 Years | 57 (22.3%) | 34 (10.1%) |
| 75 Years and over | 17 (11.4%) | 156 (50.2%) |
Disability Class: Self-Care Difficulty
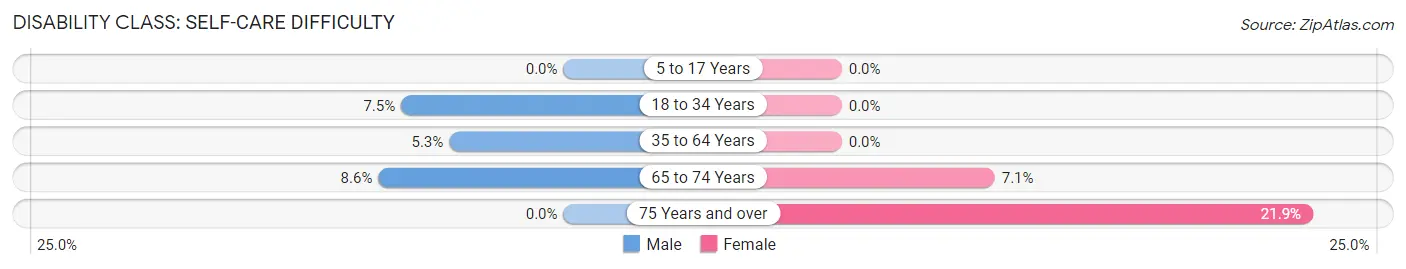
| Age Bracket | Male | Female |
| 5 to 17 Years | 0 (0.0%) | 0 (0.0%) |
| 18 to 34 Years | 33 (7.5%) | 0 (0.0%) |
| 35 to 64 Years | 48 (5.3%) | 0 (0.0%) |
| 65 to 74 Years | 22 (8.6%) | 24 (7.1%) |
| 75 Years and over | 0 (0.0%) | 68 (21.9%) |
Technology Access in Berryville
Computing Device Access in Berryville
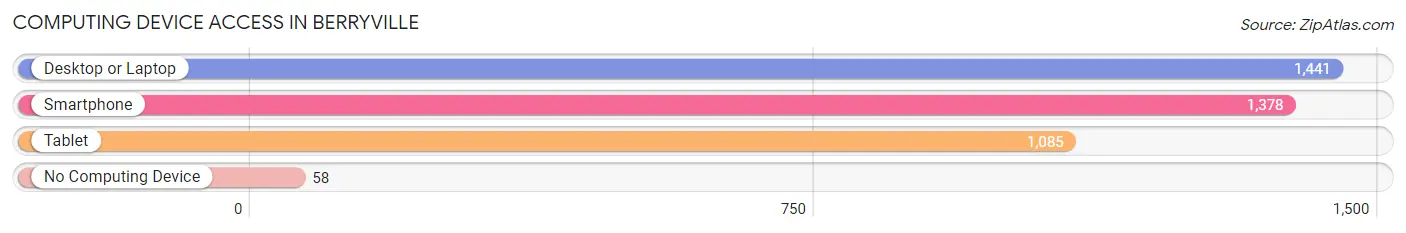
| Device Type | # Households | % Households |
| Desktop or Laptop | 1,441 | 86.9% |
| Smartphone | 1,378 | 83.1% |
| Tablet | 1,085 | 65.4% |
| No Computing Device | 58 | 3.5% |
| Total | 1,659 | 100.0% |
Internet Access in Berryville
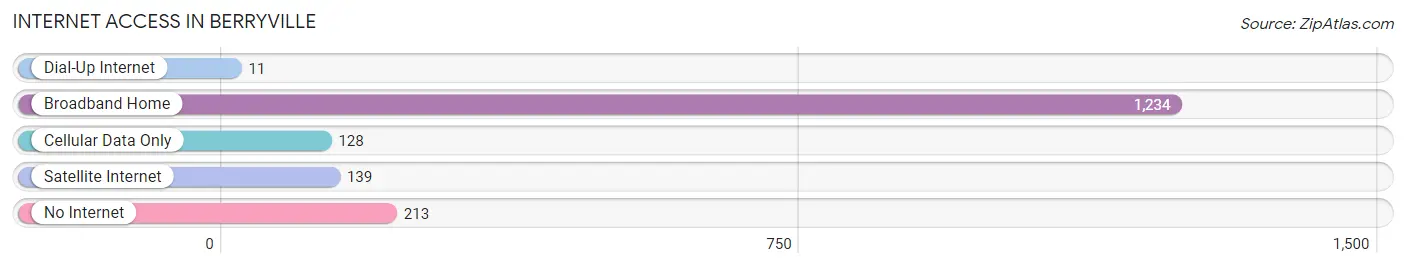
| Internet Type | # Households | % Households |
| Dial-Up Internet | 11 | 0.7% |
| Broadband Home | 1,234 | 74.4% |
| Cellular Data Only | 128 | 7.7% |
| Satellite Internet | 139 | 8.4% |
| No Internet | 213 | 12.8% |
| Total | 1,659 | 100.0% |
Berryville Summary
History
The town of Berryville, Virginia is located in the northern part of Clarke County, Virginia, and is the county seat. The town was established in 1798 and was named after the prominent Berry family who had settled in the area in the late 1700s. The town was originally known as Battle Town, but the name was changed to Berryville in 1835.
The town of Berryville has a rich history that dates back to the early days of the American Revolution. During the war, the town was the site of several battles, including the Battle of Cool Spring in 1781. The town was also the site of the Battle of Berryville in 1864, which was a major victory for the Union forces.
The town of Berryville has also been home to several prominent figures in American history. President James Madison was born in the town in 1751, and President George Washington visited the town several times during his presidency. The town was also the home of Confederate General Jubal Early, who was born in the town in 1816.
Geography
The town of Berryville is located in the northern part of Clarke County, Virginia, and is situated at the intersection of US Route 340 and US Route 7. The town is located in the Shenandoah Valley, and is surrounded by the Blue Ridge Mountains to the east and the Allegheny Mountains to the west. The town is located approximately 70 miles west of Washington, D.C.
The town of Berryville has a total area of 2.2 square miles, all of which is land. The town is located at an elevation of 845 feet above sea level. The town is located in a humid subtropical climate zone, and the average annual temperature is around 54 degrees Fahrenheit.
Economy
The economy of Berryville is largely based on agriculture and tourism. The town is home to several farms, including the historic Berryville Farm, which has been in operation since the late 1700s. The town is also home to several wineries, including the Bluemont Vineyard and the Bluemont Winery.
The town is also home to several businesses, including several restaurants, retail stores, and a variety of other services. The town is also home to several manufacturing companies, including the Berryville Manufacturing Company, which produces a variety of products, including furniture and wood products.
Demographics
As of the 2010 census, the town of Berryville had a population of 4,185. The racial makeup of the town was 90.3% White, 5.2% African American, 0.4% Native American, 0.7% Asian, 0.1% Pacific Islander, and 2.3% from other races. The median household income in the town was $50,945, and the median family income was $60,945.
The town of Berryville is served by the Clarke County Public Schools system, which includes four elementary schools, one middle school, and one high school. The town is also home to several private schools, including the Clarke County Christian Academy and the Shenandoah Valley Academy. The town is also home to the Shenandoah University, which is a private liberal arts college.
Common Questions
What is Per Capita Income in Berryville?
Per Capita income in Berryville is $42,131.
What is the Median Family Income in Berryville?
Median Family Income in Berryville is $113,704.
What is the Median Household income in Berryville?
Median Household Income in Berryville is $91,089.
What is Income or Wage Gap in Berryville?
Income or Wage Gap in Berryville is 33.9%.
Women in Berryville earn 66.1 cents for every dollar earned by a man.
What is Inequality or Gini Index in Berryville?
Inequality or Gini Index in Berryville is 0.39.
What is the Total Population of Berryville?
Total Population of Berryville is 4,598.
What is the Total Male Population of Berryville?
Total Male Population of Berryville is 2,246.
What is the Total Female Population of Berryville?
Total Female Population of Berryville is 2,352.
What is the Ratio of Males per 100 Females in Berryville?
There are 95.49 Males per 100 Females in Berryville.
What is the Ratio of Females per 100 Males in Berryville?
There are 104.72 Females per 100 Males in Berryville.
What is the Median Population Age in Berryville?
Median Population Age in Berryville is 48.9 Years.
What is the Average Family Size in Berryville
Average Family Size in Berryville is 3.2 People.
What is the Average Household Size in Berryville
Average Household Size in Berryville is 2.7 People.
How Large is the Labor Force in Berryville?
There are 1,902 People in the Labor Forcein in Berryville.
What is the Percentage of People in the Labor Force in Berryville?
49.3% of People are in the Labor Force in Berryville.
What is the Unemployment Rate in Berryville?
Unemployment Rate in Berryville is 4.9%.