Christiansburg, VA Map & Demographics
Christiansburg Map
Christiansburg Overview
$37,268
PER CAPITA INCOME
$93,539
AVG FAMILY INCOME
$71,468
AVG HOUSEHOLD INCOME
41.8%
WAGE / INCOME GAP [ % ]
58.2¢/ $1
WAGE / INCOME GAP [ $ ]
0.42
INEQUALITY / GINI INDEX
22,947
TOTAL POPULATION
11,296
MALE POPULATION
11,651
FEMALE POPULATION
96.95
MALES / 100 FEMALES
103.14
FEMALES / 100 MALES
39.1
MEDIAN AGE
3.0
AVG FAMILY SIZE
2.3
AVG HOUSEHOLD SIZE
12,182
LABOR FORCE [ PEOPLE ]
64.8%
PERCENT IN LABOR FORCE
2.4%
UNEMPLOYMENT RATE
Christiansburg Zip Codes
Christiansburg Area Codes
Income in Christiansburg
Income Overview in Christiansburg
Per Capita Income in Christiansburg is $37,268, while median incomes of families and households are $93,539 and $71,468 respectively.
| Characteristic | Number | Measure |
| Per Capita Income | 22,947 | $37,268 |
| Median Family Income | 5,801 | $93,539 |
| Mean Family Income | 5,801 | $108,356 |
| Median Household Income | 9,686 | $71,468 |
| Mean Household Income | 9,686 | $85,355 |
| Income Deficit | 5,801 | $0 |
| Wage / Income Gap (%) | 22,947 | 41.80% |
| Wage / Income Gap ($) | 22,947 | 58.20¢ per $1 |
| Gini / Inequality Index | 22,947 | 0.42 |
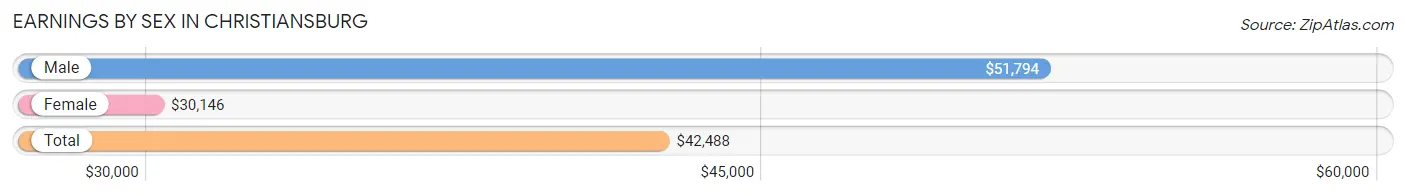
Earnings by Sex in Christiansburg
Average Earnings in Christiansburg are $42,488, $51,794 for men and $30,146 for women, a difference of 41.8%.
| Sex | Number | Average Earnings |
| Male | 6,483 (50.9%) | $51,794 |
| Female | 6,249 (49.1%) | $30,146 |
| Total | 12,732 (100.0%) | $42,488 |
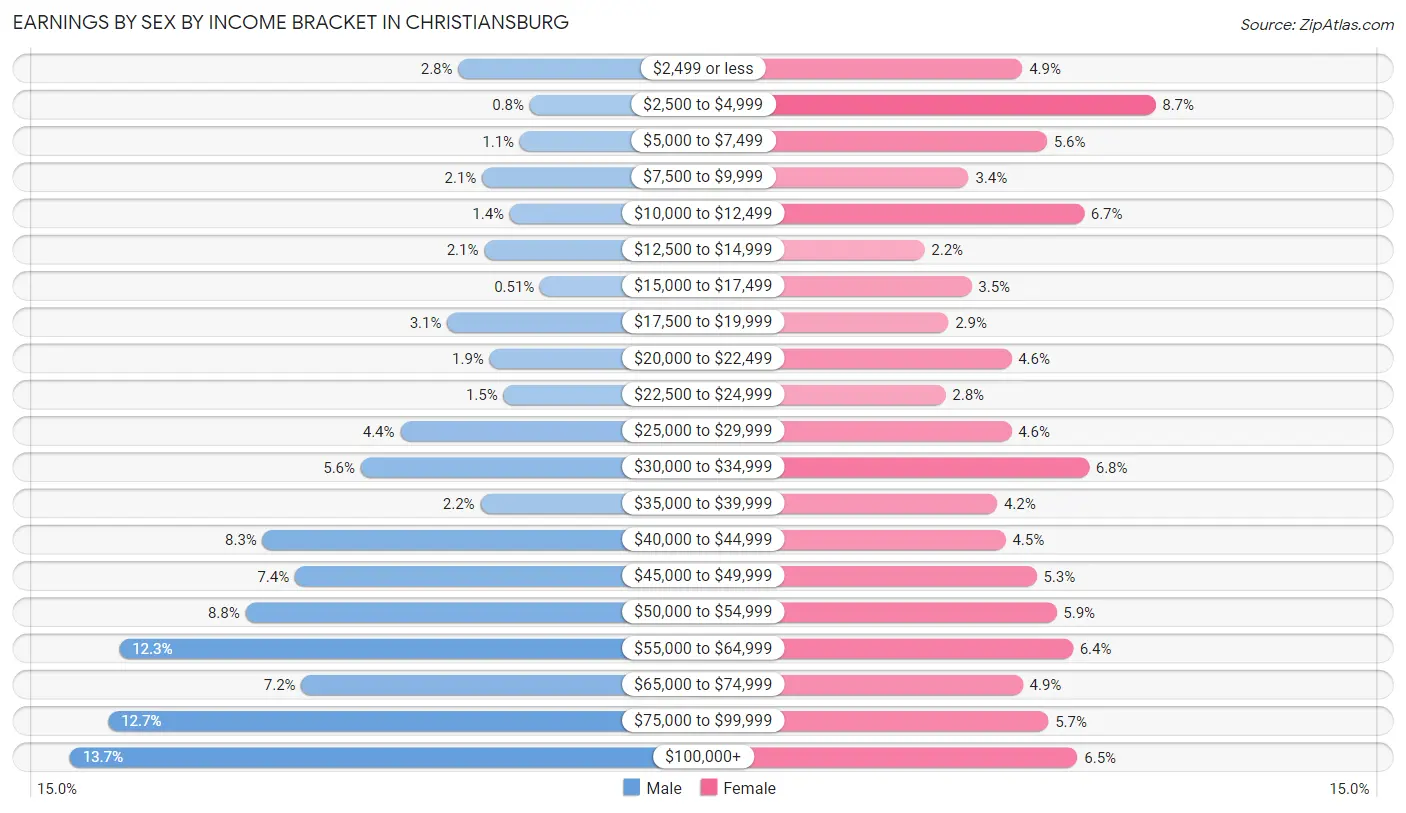
Earnings by Sex by Income Bracket in Christiansburg
The most common earnings brackets in Christiansburg are $100,000+ for men (890 | 13.7%) and $2,500 to $4,999 for women (542 | 8.7%).
| Income | Male | Female |
| $2,499 or less | 182 (2.8%) | 308 (4.9%) |
| $2,500 to $4,999 | 52 (0.8%) | 542 (8.7%) |
| $5,000 to $7,499 | 70 (1.1%) | 351 (5.6%) |
| $7,500 to $9,999 | 139 (2.1%) | 214 (3.4%) |
| $10,000 to $12,499 | 88 (1.4%) | 416 (6.7%) |
| $12,500 to $14,999 | 135 (2.1%) | 136 (2.2%) |
| $15,000 to $17,499 | 33 (0.5%) | 219 (3.5%) |
| $17,500 to $19,999 | 202 (3.1%) | 178 (2.9%) |
| $20,000 to $22,499 | 125 (1.9%) | 289 (4.6%) |
| $22,500 to $24,999 | 100 (1.5%) | 173 (2.8%) |
| $25,000 to $29,999 | 288 (4.4%) | 289 (4.6%) |
| $30,000 to $34,999 | 360 (5.6%) | 425 (6.8%) |
| $35,000 to $39,999 | 142 (2.2%) | 264 (4.2%) |
| $40,000 to $44,999 | 539 (8.3%) | 279 (4.5%) |
| $45,000 to $49,999 | 480 (7.4%) | 333 (5.3%) |
| $50,000 to $54,999 | 570 (8.8%) | 368 (5.9%) |
| $55,000 to $64,999 | 800 (12.3%) | 397 (6.4%) |
| $65,000 to $74,999 | 468 (7.2%) | 309 (4.9%) |
| $75,000 to $99,999 | 820 (12.7%) | 354 (5.7%) |
| $100,000+ | 890 (13.7%) | 405 (6.5%) |
| Total | 6,483 (100.0%) | 6,249 (100.0%) |
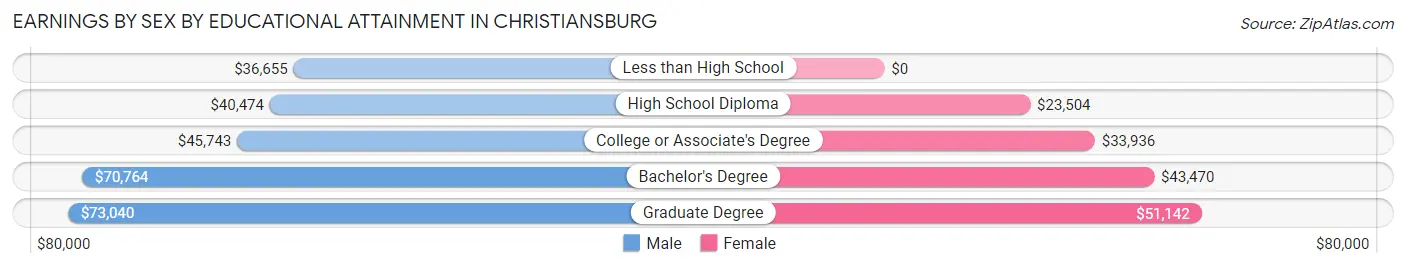
Earnings by Sex by Educational Attainment in Christiansburg
Average earnings in Christiansburg are $53,488 for men and $35,356 for women, a difference of 33.9%. Men with an educational attainment of graduate degree enjoy the highest average annual earnings of $73,040, while those with less than high school education earn the least with $36,655. Women with an educational attainment of graduate degree earn the most with the average annual earnings of $51,142, while those with high school diploma education have the smallest earnings of $23,504.
| Educational Attainment | Male Income | Female Income |
| Less than High School | $36,655 | $0 |
| High School Diploma | $40,474 | $23,504 |
| College or Associate's Degree | $45,743 | $33,936 |
| Bachelor's Degree | $70,764 | $43,470 |
| Graduate Degree | $73,040 | $51,142 |
| Total | $53,488 | $35,356 |
Family Income in Christiansburg
Family Income Brackets in Christiansburg
According to the Christiansburg family income data, there are 1,555 families falling into the $100,000 to $149,999 income range, which is the most common income bracket and makes up 26.8% of all families. Conversely, the $15,000 to $24,999 income bracket is the least frequent group with only 87 families (1.5%) belonging to this category.
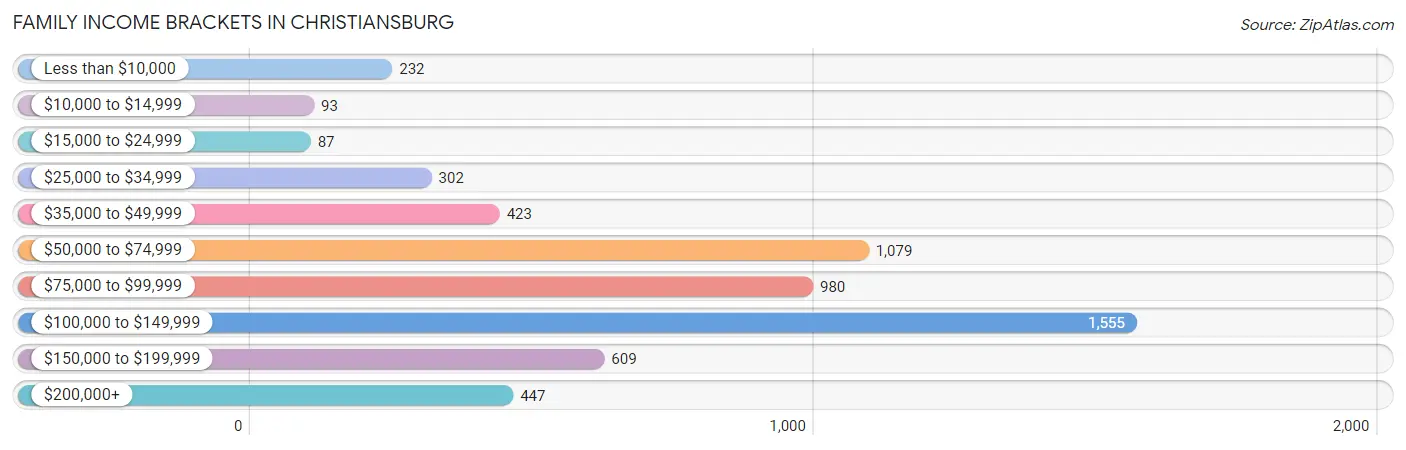
| Income Bracket | # Families | % Families |
| Less than $10,000 | 232 | 4.0% |
| $10,000 to $14,999 | 93 | 1.6% |
| $15,000 to $24,999 | 87 | 1.5% |
| $25,000 to $34,999 | 302 | 5.2% |
| $35,000 to $49,999 | 423 | 7.3% |
| $50,000 to $74,999 | 1,079 | 18.6% |
| $75,000 to $99,999 | 980 | 16.9% |
| $100,000 to $149,999 | 1,555 | 26.8% |
| $150,000 to $199,999 | 609 | 10.5% |
| $200,000+ | 447 | 7.7% |
Family Income by Famaliy Size in Christiansburg
4-person families (1,186 | 20.4%) account for the highest median family income in Christiansburg with $107,778 per family, while 2-person families (2,889 | 49.8%) have the highest median income of $43,470 per family member.
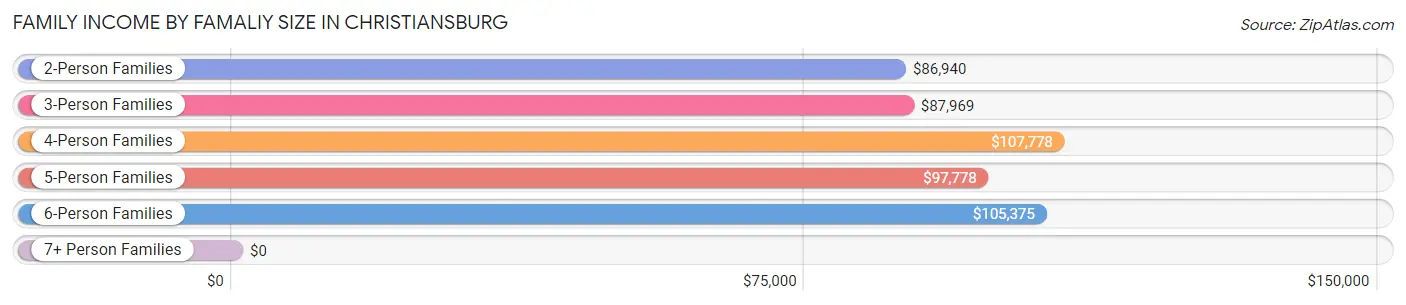
| Income Bracket | # Families | Median Income |
| 2-Person Families | 2,889 (49.8%) | $86,940 |
| 3-Person Families | 1,116 (19.2%) | $87,969 |
| 4-Person Families | 1,186 (20.4%) | $107,778 |
| 5-Person Families | 336 (5.8%) | $97,778 |
| 6-Person Families | 203 (3.5%) | $105,375 |
| 7+ Person Families | 71 (1.2%) | $0 |
| Total | 5,801 (100.0%) | $93,539 |
Family Income by Number of Earners in Christiansburg
The median family income in Christiansburg is $93,539, with families comprising 3+ earners (529) having the highest median family income of $118,850, while families with no earners (701) have the lowest median family income of $62,102, accounting for 9.1% and 12.1% of families, respectively.
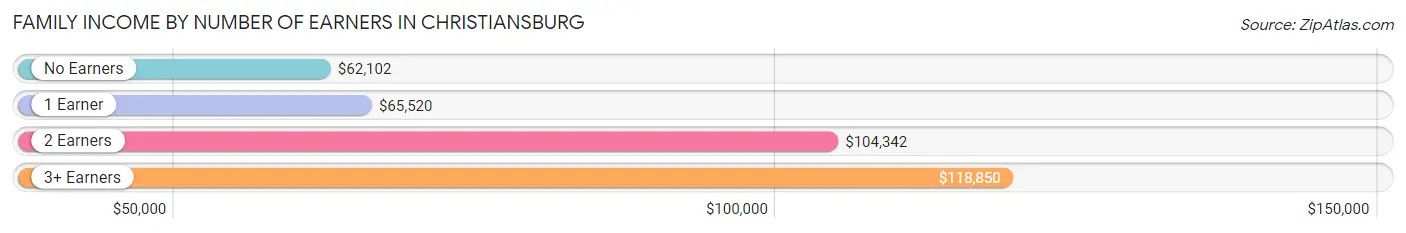
| Number of Earners | # Families | Median Income |
| No Earners | 701 (12.1%) | $62,102 |
| 1 Earner | 1,960 (33.8%) | $65,520 |
| 2 Earners | 2,611 (45.0%) | $104,342 |
| 3+ Earners | 529 (9.1%) | $118,850 |
| Total | 5,801 (100.0%) | $93,539 |
Household Income in Christiansburg
Household Income Brackets in Christiansburg
With 2,131 households falling in the category, the $50,000 to $74,999 income range is the most frequent in Christiansburg, accounting for 22.0% of all households. In contrast, only 271 households (2.8%) fall into the $10,000 to $14,999 income bracket, making it the least populous group.
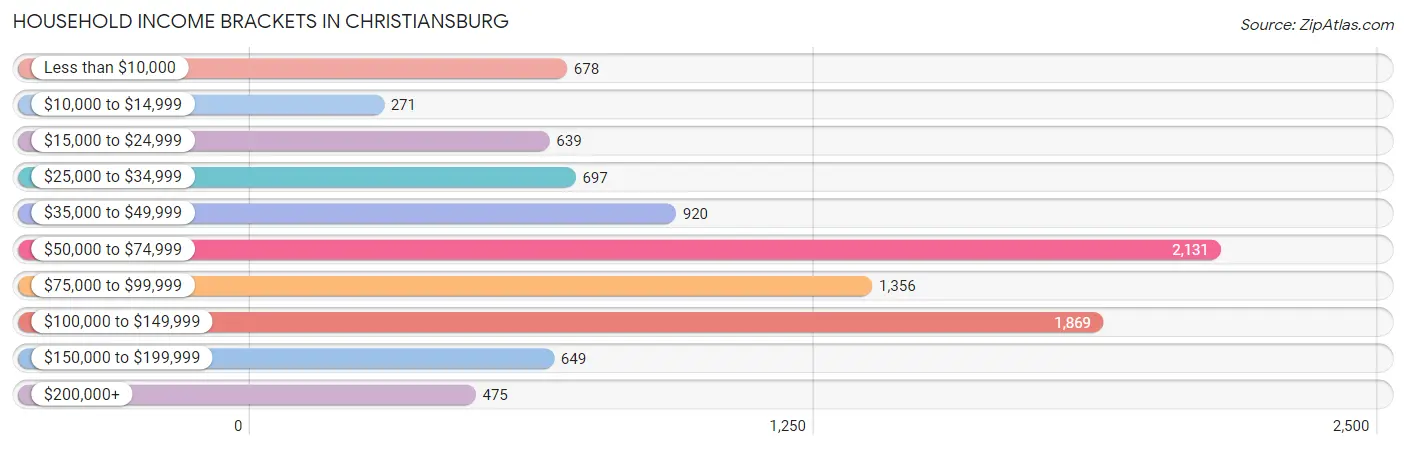
| Income Bracket | # Households | % Households |
| Less than $10,000 | 678 | 7.0% |
| $10,000 to $14,999 | 271 | 2.8% |
| $15,000 to $24,999 | 639 | 6.6% |
| $25,000 to $34,999 | 697 | 7.2% |
| $35,000 to $49,999 | 920 | 9.5% |
| $50,000 to $74,999 | 2,131 | 22.0% |
| $75,000 to $99,999 | 1,356 | 14.0% |
| $100,000 to $149,999 | 1,869 | 19.3% |
| $150,000 to $199,999 | 649 | 6.7% |
| $200,000+ | 475 | 4.9% |
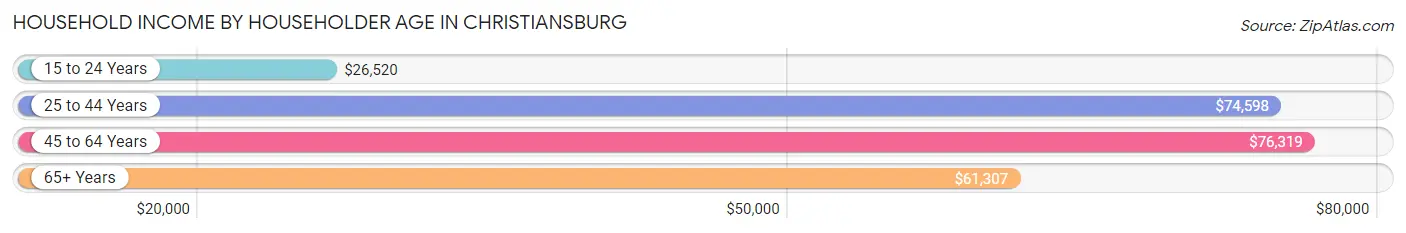
Household Income by Householder Age in Christiansburg
The median household income in Christiansburg is $71,468, with the highest median household income of $76,319 found in the 45 to 64 years age bracket for the primary householder. A total of 3,175 households (32.8%) fall into this category. Meanwhile, the 15 to 24 years age bracket for the primary householder has the lowest median household income of $26,520, with 434 households (4.5%) in this group.
| Income Bracket | # Households | Median Income |
| 15 to 24 Years | 434 (4.5%) | $26,520 |
| 25 to 44 Years | 3,474 (35.9%) | $74,598 |
| 45 to 64 Years | 3,175 (32.8%) | $76,319 |
| 65+ Years | 2,603 (26.9%) | $61,307 |
| Total | 9,686 (100.0%) | $71,468 |
Poverty in Christiansburg
Income Below Poverty by Sex and Age in Christiansburg
With 9.1% poverty level for males and 15.2% for females among the residents of Christiansburg, under 5 year old males and 5 year old females are the most vulnerable to poverty, with 169 males (31.8%) and 54 females (48.2%) in their respective age groups living below the poverty level.
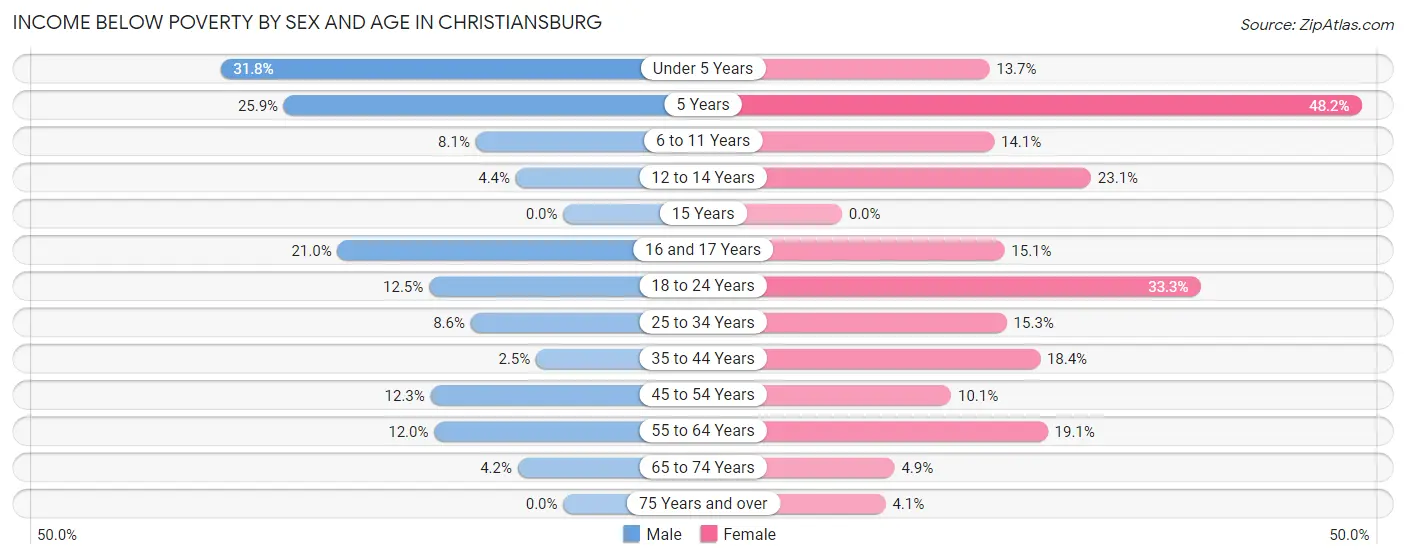
| Age Bracket | Male | Female |
| Under 5 Years | 169 (31.8%) | 76 (13.7%) |
| 5 Years | 14 (25.9%) | 54 (48.2%) |
| 6 to 11 Years | 63 (8.1%) | 145 (14.1%) |
| 12 to 14 Years | 19 (4.4%) | 80 (23.1%) |
| 15 Years | 0 (0.0%) | 0 (0.0%) |
| 16 and 17 Years | 57 (21.0%) | 35 (15.1%) |
| 18 to 24 Years | 75 (12.5%) | 348 (33.3%) |
| 25 to 34 Years | 171 (8.6%) | 254 (15.3%) |
| 35 to 44 Years | 39 (2.5%) | 301 (18.4%) |
| 45 to 54 Years | 201 (12.3%) | 163 (10.1%) |
| 55 to 64 Years | 163 (12.0%) | 204 (19.1%) |
| 65 to 74 Years | 43 (4.2%) | 69 (4.9%) |
| 75 Years and over | 0 (0.0%) | 31 (4.1%) |
| Total | 1,014 (9.1%) | 1,760 (15.2%) |
Income Above Poverty by Sex and Age in Christiansburg
According to the poverty statistics in Christiansburg, males aged 15 years and females aged 15 years are the age groups that are most secure financially, with 100.0% of males and 100.0% of females in these age groups living above the poverty line.
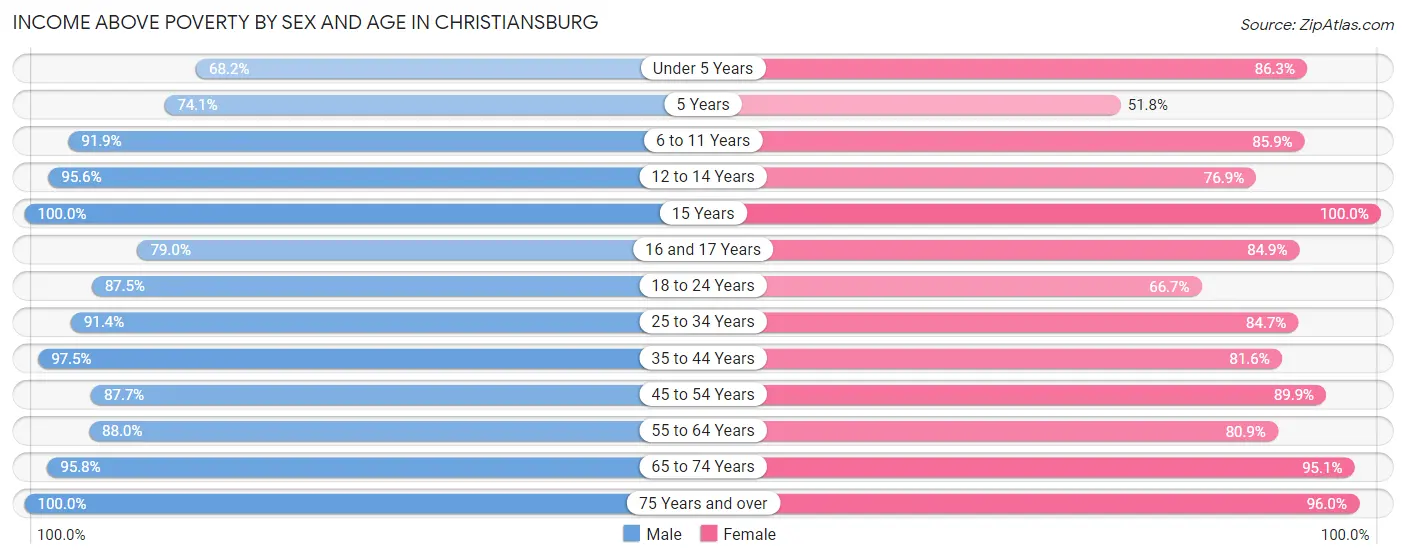
| Age Bracket | Male | Female |
| Under 5 Years | 362 (68.2%) | 479 (86.3%) |
| 5 Years | 40 (74.1%) | 58 (51.8%) |
| 6 to 11 Years | 712 (91.9%) | 881 (85.9%) |
| 12 to 14 Years | 412 (95.6%) | 266 (76.9%) |
| 15 Years | 205 (100.0%) | 89 (100.0%) |
| 16 and 17 Years | 215 (79.0%) | 197 (84.9%) |
| 18 to 24 Years | 527 (87.5%) | 698 (66.7%) |
| 25 to 34 Years | 1,819 (91.4%) | 1,406 (84.7%) |
| 35 to 44 Years | 1,500 (97.5%) | 1,336 (81.6%) |
| 45 to 54 Years | 1,430 (87.7%) | 1,445 (89.9%) |
| 55 to 64 Years | 1,198 (88.0%) | 864 (80.9%) |
| 65 to 74 Years | 974 (95.8%) | 1,342 (95.1%) |
| 75 Years and over | 721 (100.0%) | 735 (96.0%) |
| Total | 10,115 (90.9%) | 9,796 (84.8%) |
Income Below Poverty Among Married-Couple Families in Christiansburg
The poverty statistics for married-couple families in Christiansburg show that 3.4% or 162 of the total 4,810 families live below the poverty line. Families with 5 or more children have the highest poverty rate of 100.0%, comprising of 13 families. On the other hand, families with 1 or 2 children have the lowest poverty rate of 0.0%, which includes 0 families.
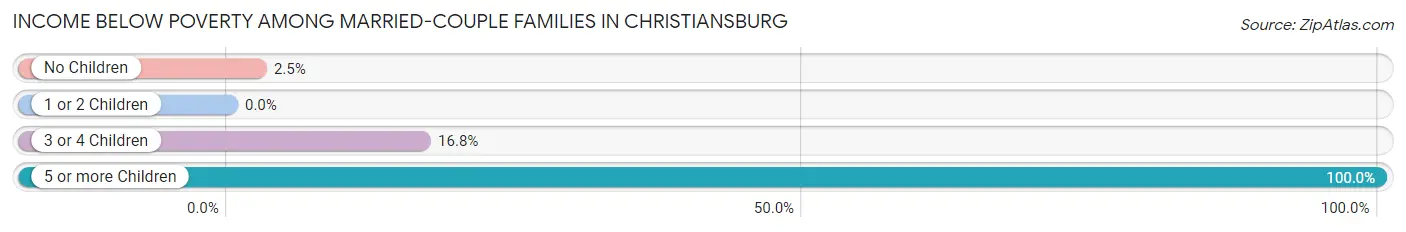
| Children | Above Poverty | Below Poverty |
| No Children | 2,748 (97.5%) | 71 (2.5%) |
| 1 or 2 Children | 1,514 (100.0%) | 0 (0.0%) |
| 3 or 4 Children | 386 (83.2%) | 78 (16.8%) |
| 5 or more Children | 0 (0.0%) | 13 (100.0%) |
| Total | 4,648 (96.6%) | 162 (3.4%) |
Income Below Poverty Among Single-Parent Households in Christiansburg
According to the poverty data in Christiansburg, 6.5% or 17 single-father households and 31.4% or 229 single-mother households are living below the poverty line. Among single-father households, those with no children have the highest poverty rate, with 17 households (19.1%) experiencing poverty. Likewise, among single-mother households, those with 3 or 4 children have the highest poverty rate, with 50 households (78.1%) falling below the poverty line.
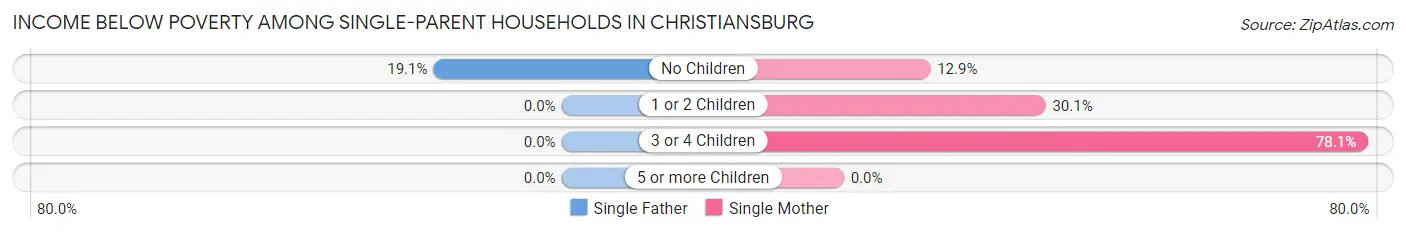
| Children | Single Father | Single Mother |
| No Children | 17 (19.1%) | 16 (12.9%) |
| 1 or 2 Children | 0 (0.0%) | 163 (30.1%) |
| 3 or 4 Children | 0 (0.0%) | 50 (78.1%) |
| 5 or more Children | 0 (0.0%) | 0 (0.0%) |
| Total | 17 (6.5%) | 229 (31.4%) |
Income Below Poverty Among Married-Couple vs Single-Parent Households in Christiansburg
The poverty data for Christiansburg shows that 162 of the married-couple family households (3.4%) and 246 of the single-parent households (24.8%) are living below the poverty level. Within the married-couple family households, those with 5 or more children have the highest poverty rate, with 13 households (100.0%) falling below the poverty line. Among the single-parent households, those with 3 or 4 children have the highest poverty rate, with 50 household (78.1%) living below poverty.
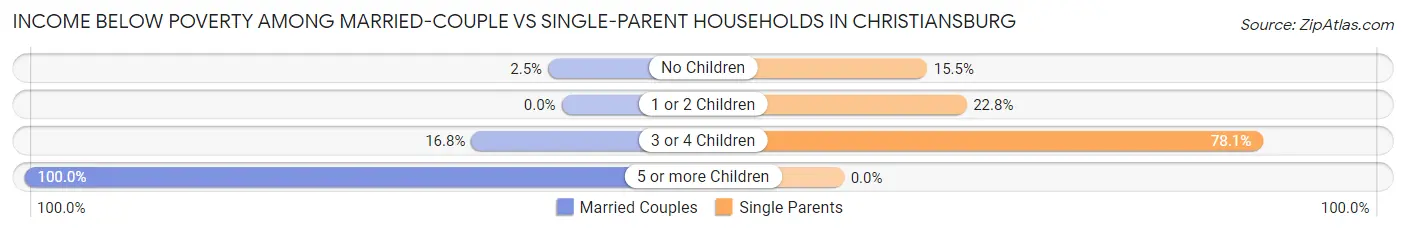
| Children | Married-Couple Families | Single-Parent Households |
| No Children | 71 (2.5%) | 33 (15.5%) |
| 1 or 2 Children | 0 (0.0%) | 163 (22.8%) |
| 3 or 4 Children | 78 (16.8%) | 50 (78.1%) |
| 5 or more Children | 13 (100.0%) | 0 (0.0%) |
| Total | 162 (3.4%) | 246 (24.8%) |
Race in Christiansburg
The most populous races in Christiansburg are White / Caucasian (19,635 | 85.6%), Black / African American (1,238 | 5.4%), and Asian (914 | 4.0%).
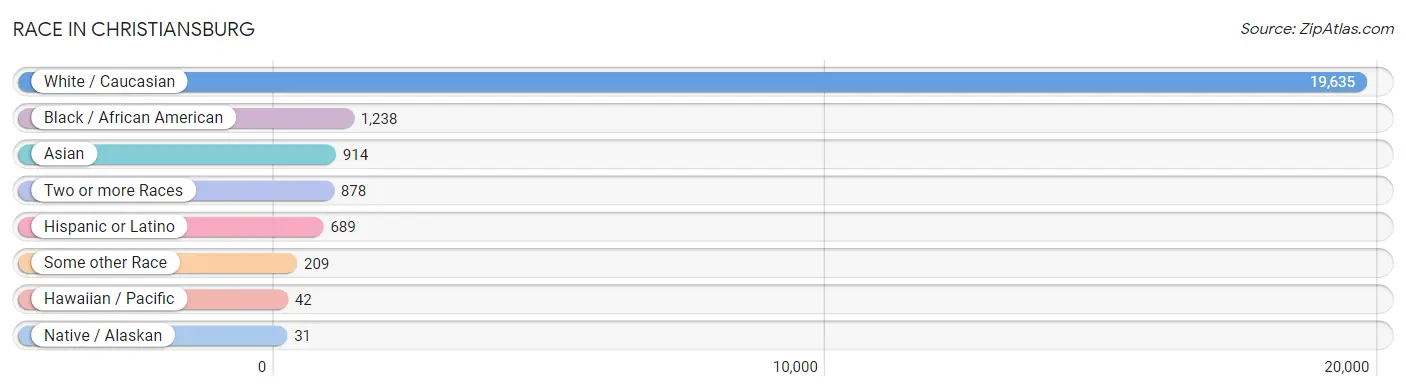
| Race | # Population | % Population |
| Asian | 914 | 4.0% |
| Black / African American | 1,238 | 5.4% |
| Hawaiian / Pacific | 42 | 0.2% |
| Hispanic or Latino | 689 | 3.0% |
| Native / Alaskan | 31 | 0.1% |
| White / Caucasian | 19,635 | 85.6% |
| Two or more Races | 878 | 3.8% |
| Some other Race | 209 | 0.9% |
| Total | 22,947 | 100.0% |
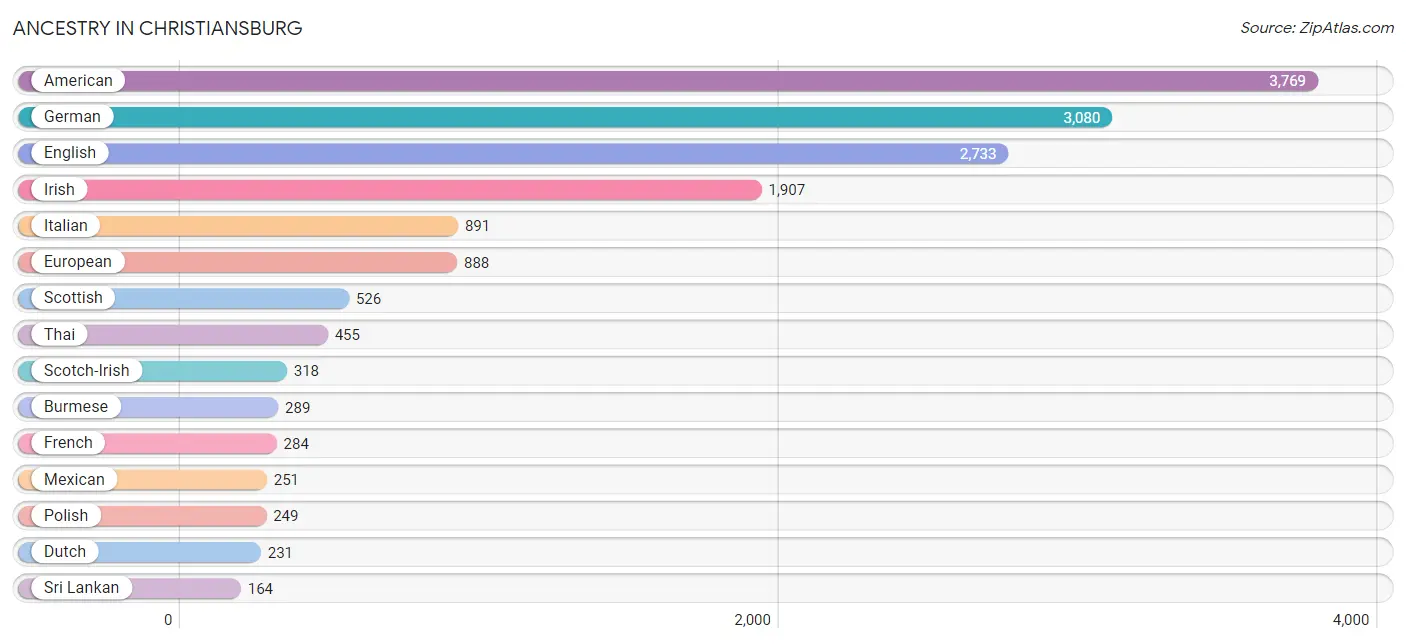
Ancestry in Christiansburg
The most populous ancestries reported in Christiansburg are American (3,769 | 16.4%), German (3,080 | 13.4%), English (2,733 | 11.9%), Irish (1,907 | 8.3%), and Italian (891 | 3.9%), together accounting for 53.9% of all Christiansburg residents.
| Ancestry | # Population | % Population |
| Afghan | 1 | 0.0% |
| African | 108 | 0.5% |
| American | 3,769 | 16.4% |
| Arab | 145 | 0.6% |
| Austrian | 110 | 0.5% |
| Bhutanese | 12 | 0.1% |
| Bolivian | 16 | 0.1% |
| Brazilian | 20 | 0.1% |
| British | 147 | 0.6% |
| Burmese | 289 | 1.3% |
| Canadian | 67 | 0.3% |
| Central American | 35 | 0.2% |
| Central American Indian | 45 | 0.2% |
| Cherokee | 4 | 0.0% |
| Colombian | 81 | 0.4% |
| Costa Rican | 16 | 0.1% |
| Creek | 3 | 0.0% |
| Cuban | 8 | 0.0% |
| Czech | 11 | 0.1% |
| Danish | 46 | 0.2% |
| Dutch | 231 | 1.0% |
| Egyptian | 113 | 0.5% |
| English | 2,733 | 11.9% |
| Ethiopian | 2 | 0.0% |
| European | 888 | 3.9% |
| Finnish | 63 | 0.3% |
| French | 284 | 1.2% |
| French Canadian | 101 | 0.4% |
| German | 3,080 | 13.4% |
| Greek | 26 | 0.1% |
| Hungarian | 35 | 0.2% |
| Indian (Asian) | 74 | 0.3% |
| Inupiat | 3 | 0.0% |
| Iranian | 4 | 0.0% |
| Irish | 1,907 | 8.3% |
| Italian | 891 | 3.9% |
| Korean | 47 | 0.2% |
| Lebanese | 25 | 0.1% |
| Lithuanian | 46 | 0.2% |
| Malaysian | 17 | 0.1% |
| Mexican | 251 | 1.1% |
| Nigerian | 11 | 0.1% |
| Northern European | 48 | 0.2% |
| Norwegian | 63 | 0.3% |
| Peruvian | 15 | 0.1% |
| Polish | 249 | 1.1% |
| Portuguese | 39 | 0.2% |
| Puerto Rican | 110 | 0.5% |
| Romanian | 5 | 0.0% |
| Russian | 114 | 0.5% |
| Salvadoran | 19 | 0.1% |
| Samoan | 2 | 0.0% |
| Scandinavian | 28 | 0.1% |
| Scotch-Irish | 318 | 1.4% |
| Scottish | 526 | 2.3% |
| Slavic | 76 | 0.3% |
| South American | 145 | 0.6% |
| South American Indian | 18 | 0.1% |
| Spaniard | 8 | 0.0% |
| Spanish | 1 | 0.0% |
| Sri Lankan | 164 | 0.7% |
| Subsaharan African | 121 | 0.5% |
| Swedish | 110 | 0.5% |
| Thai | 455 | 2.0% |
| Ukrainian | 75 | 0.3% |
| Venezuelan | 33 | 0.1% |
| Welsh | 85 | 0.4% |
| West Indian | 3 | 0.0% | View All 68 Rows |
Immigrants in Christiansburg
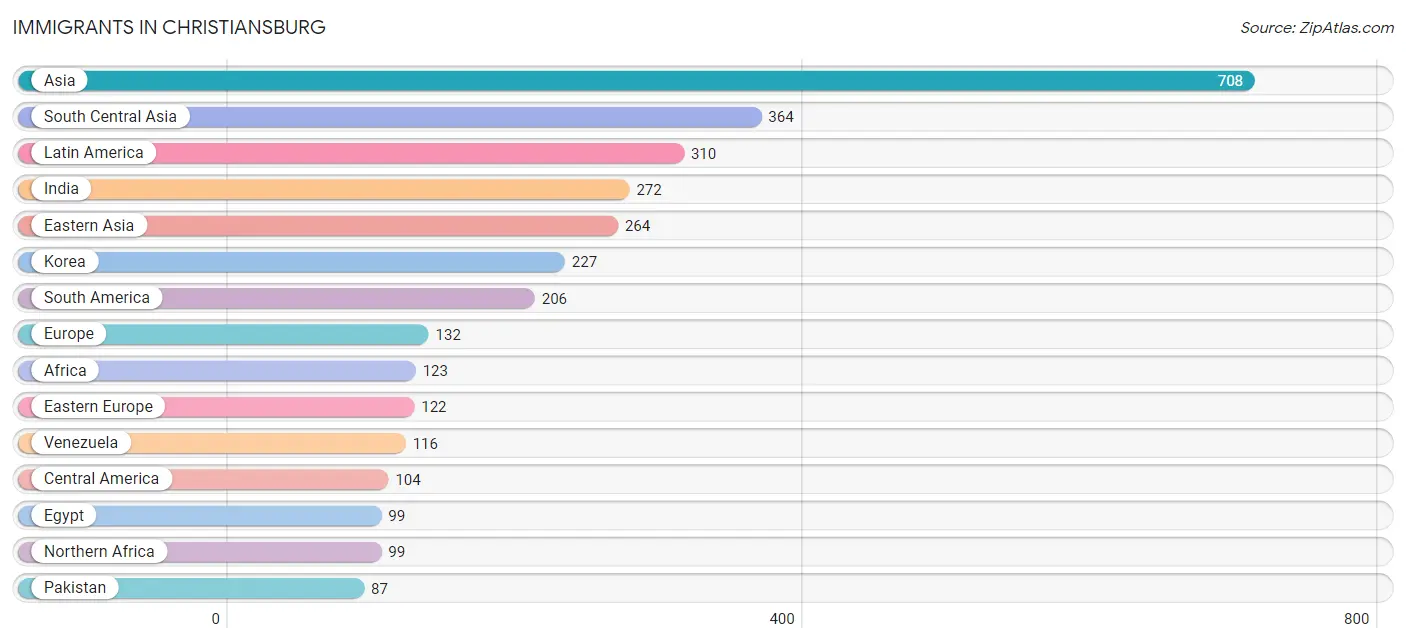
The most numerous immigrant groups reported in Christiansburg came from Asia (708 | 3.1%), South Central Asia (364 | 1.6%), Latin America (310 | 1.3%), India (272 | 1.2%), and Eastern Asia (264 | 1.1%), together accounting for 8.4% of all Christiansburg residents.
| Immigration Origin | # Population | % Population |
| Afghanistan | 5 | 0.0% |
| Africa | 123 | 0.5% |
| Asia | 708 | 3.1% |
| Austria | 10 | 0.0% |
| Bolivia | 16 | 0.1% |
| Bosnia and Herzegovina | 53 | 0.2% |
| Brazil | 20 | 0.1% |
| Canada | 22 | 0.1% |
| Central America | 104 | 0.4% |
| China | 37 | 0.2% |
| Colombia | 48 | 0.2% |
| Costa Rica | 16 | 0.1% |
| Eastern Africa | 24 | 0.1% |
| Eastern Asia | 264 | 1.1% |
| Eastern Europe | 122 | 0.5% |
| Egypt | 99 | 0.4% |
| El Salvador | 4 | 0.0% |
| Eritrea | 11 | 0.1% |
| Ethiopia | 2 | 0.0% |
| Europe | 132 | 0.6% |
| Hungary | 26 | 0.1% |
| India | 272 | 1.2% |
| Kenya | 11 | 0.1% |
| Korea | 227 | 1.0% |
| Latin America | 310 | 1.3% |
| Mexico | 84 | 0.4% |
| Northern Africa | 99 | 0.4% |
| Pakistan | 87 | 0.4% |
| Peru | 6 | 0.0% |
| Philippines | 3 | 0.0% |
| Poland | 23 | 0.1% |
| Russia | 20 | 0.1% |
| Saudi Arabia | 7 | 0.0% |
| South America | 206 | 0.9% |
| South Central Asia | 364 | 1.6% |
| South Eastern Asia | 73 | 0.3% |
| Venezuela | 116 | 0.5% |
| Vietnam | 70 | 0.3% |
| Western Asia | 7 | 0.0% |
| Western Europe | 10 | 0.0% | View All 40 Rows |
Sex and Age in Christiansburg
Sex and Age in Christiansburg
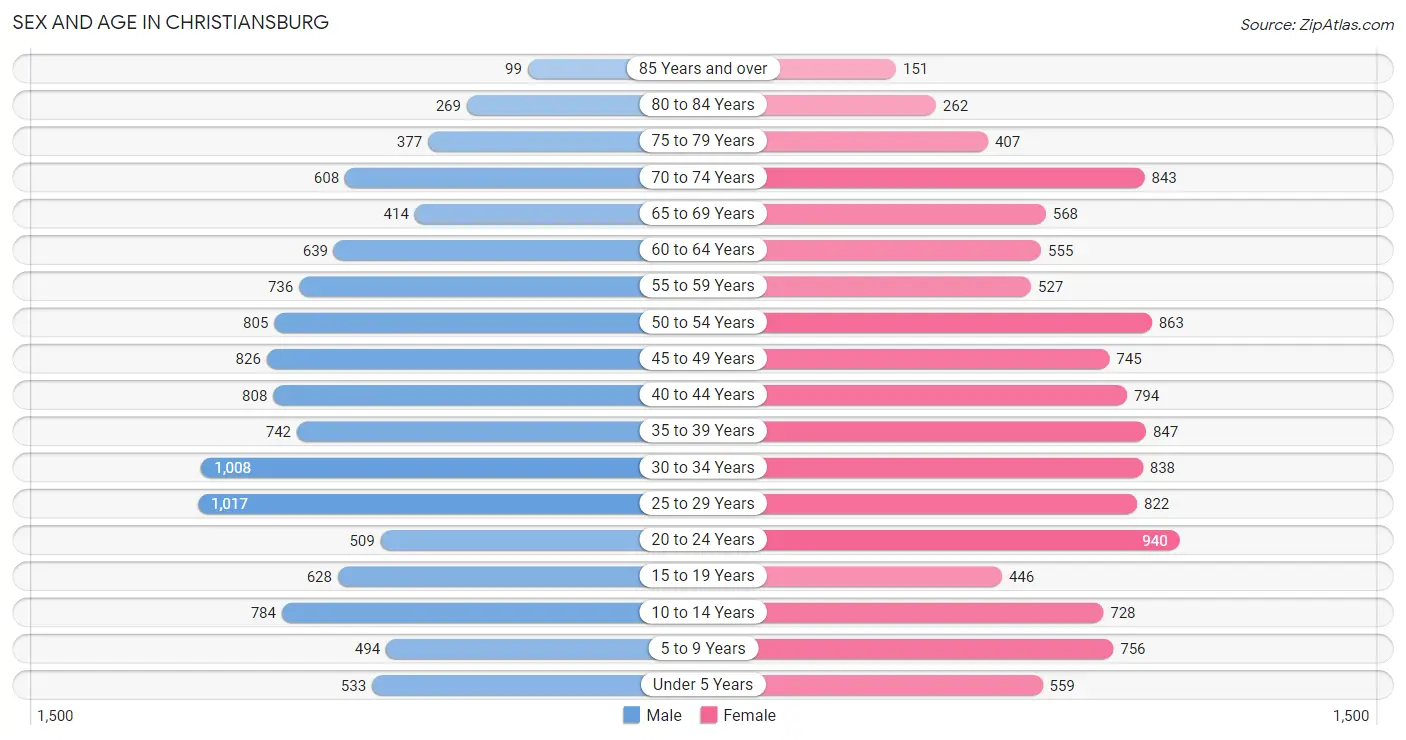
The most populous age groups in Christiansburg are 25 to 29 Years (1,017 | 9.0%) for men and 20 to 24 Years (940 | 8.1%) for women.
| Age Bracket | Male | Female |
| Under 5 Years | 533 (4.7%) | 559 (4.8%) |
| 5 to 9 Years | 494 (4.4%) | 756 (6.5%) |
| 10 to 14 Years | 784 (6.9%) | 728 (6.2%) |
| 15 to 19 Years | 628 (5.6%) | 446 (3.8%) |
| 20 to 24 Years | 509 (4.5%) | 940 (8.1%) |
| 25 to 29 Years | 1,017 (9.0%) | 822 (7.1%) |
| 30 to 34 Years | 1,008 (8.9%) | 838 (7.2%) |
| 35 to 39 Years | 742 (6.6%) | 847 (7.3%) |
| 40 to 44 Years | 808 (7.1%) | 794 (6.8%) |
| 45 to 49 Years | 826 (7.3%) | 745 (6.4%) |
| 50 to 54 Years | 805 (7.1%) | 863 (7.4%) |
| 55 to 59 Years | 736 (6.5%) | 527 (4.5%) |
| 60 to 64 Years | 639 (5.7%) | 555 (4.8%) |
| 65 to 69 Years | 414 (3.7%) | 568 (4.9%) |
| 70 to 74 Years | 608 (5.4%) | 843 (7.2%) |
| 75 to 79 Years | 377 (3.3%) | 407 (3.5%) |
| 80 to 84 Years | 269 (2.4%) | 262 (2.2%) |
| 85 Years and over | 99 (0.9%) | 151 (1.3%) |
| Total | 11,296 (100.0%) | 11,651 (100.0%) |
Families and Households in Christiansburg
Median Family Size in Christiansburg
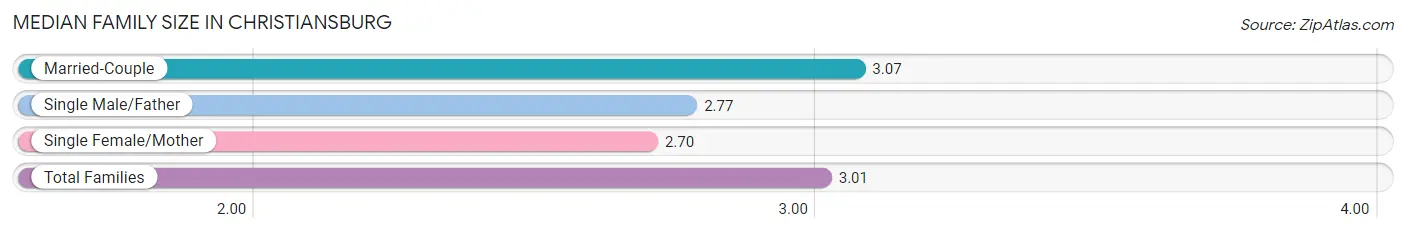
The median family size in Christiansburg is 3.01 persons per family, with married-couple families (4,810 | 82.9%) accounting for the largest median family size of 3.07 persons per family. On the other hand, single female/mother families (730 | 12.6%) represent the smallest median family size with 2.70 persons per family.
| Family Type | # Families | Family Size |
| Married-Couple | 4,810 (82.9%) | 3.07 |
| Single Male/Father | 261 (4.5%) | 2.77 |
| Single Female/Mother | 730 (12.6%) | 2.70 |
| Total Families | 5,801 (100.0%) | 3.01 |
Median Household Size in Christiansburg
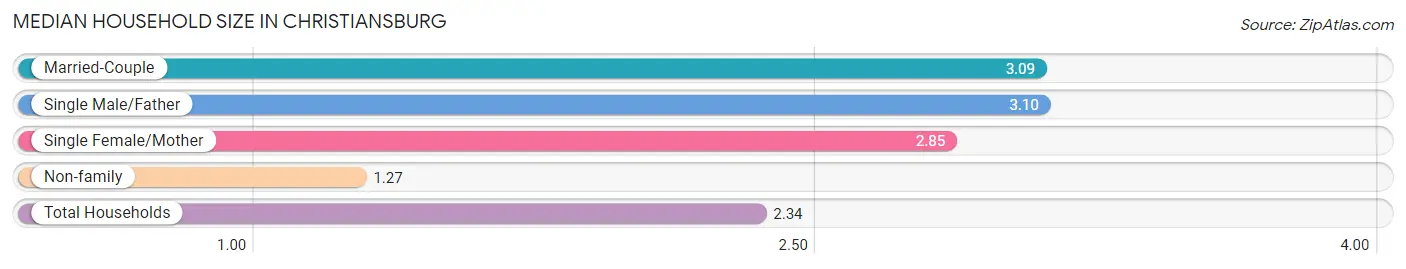
The median household size in Christiansburg is 2.34 persons per household, with single male/father households (261 | 2.7%) accounting for the largest median household size of 3.1 persons per household. non-family households (3,885 | 40.1%) represent the smallest median household size with 1.27 persons per household.
| Household Type | # Households | Household Size |
| Married-Couple | 4,810 (49.7%) | 3.09 |
| Single Male/Father | 261 (2.7%) | 3.10 |
| Single Female/Mother | 730 (7.5%) | 2.85 |
| Non-family | 3,885 (40.1%) | 1.27 |
| Total Households | 9,686 (100.0%) | 2.34 |
Household Size by Marriage Status in Christiansburg
Out of a total of 9,686 households in Christiansburg, 5,801 (59.9%) are family households, while 3,885 (40.1%) are nonfamily households. The most numerous type of family households are 2-person households, comprising 2,754, and the most common type of nonfamily households are 1-person households, comprising 3,091.
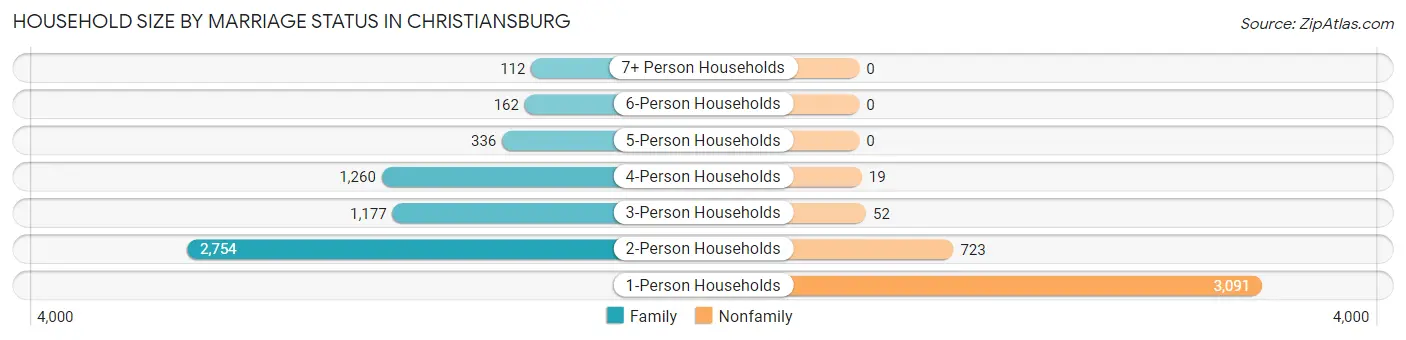
| Household Size | Family Households | Nonfamily Households |
| 1-Person Households | - | 3,091 (31.9%) |
| 2-Person Households | 2,754 (28.4%) | 723 (7.5%) |
| 3-Person Households | 1,177 (12.1%) | 52 (0.5%) |
| 4-Person Households | 1,260 (13.0%) | 19 (0.2%) |
| 5-Person Households | 336 (3.5%) | 0 (0.0%) |
| 6-Person Households | 162 (1.7%) | 0 (0.0%) |
| 7+ Person Households | 112 (1.2%) | 0 (0.0%) |
| Total | 5,801 (59.9%) | 3,885 (40.1%) |
Female Fertility in Christiansburg
Fertility by Age in Christiansburg
Average fertility rate in Christiansburg is 21.0 births per 1,000 women. Women in the age bracket of 35 to 50 years have the highest fertility rate with 23.0 births per 1,000 women. Women in the age bracket of 35 to 50 years acount for 51.3% of all women with births.
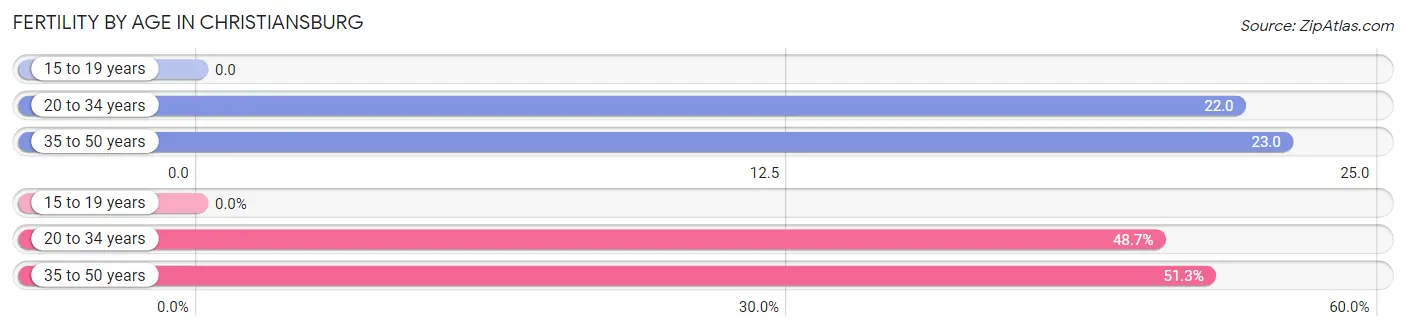
| Age Bracket | Women with Births | Births / 1,000 Women |
| 15 to 19 years | 0 (0.0%) | 0.0 |
| 20 to 34 years | 57 (48.7%) | 22.0 |
| 35 to 50 years | 60 (51.3%) | 23.0 |
| Total | 117 (100.0%) | 21.0 |
Fertility by Age by Marriage Status in Christiansburg
94.0% of women with births (117) in Christiansburg are married. The highest percentage of unmarried women with births falls into 20 to 34 years age bracket with 12.3% of them unmarried at the time of birth, while the lowest percentage of unmarried women with births belong to 35 to 50 years age bracket with 0.0% of them unmarried.
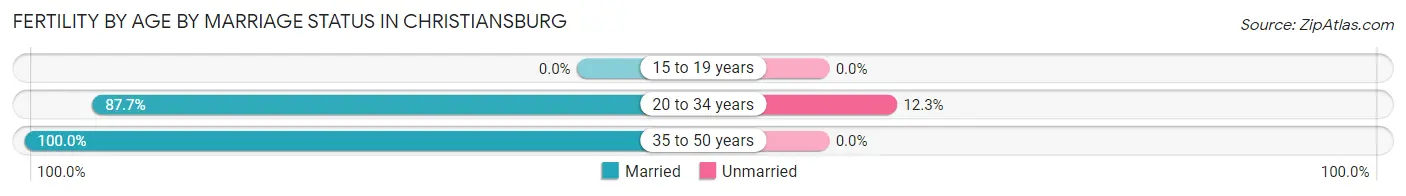
| Age Bracket | Married | Unmarried |
| 15 to 19 years | 0 (0.0%) | 0 (0.0%) |
| 20 to 34 years | 50 (87.7%) | 7 (12.3%) |
| 35 to 50 years | 60 (100.0%) | 0 (0.0%) |
| Total | 110 (94.0%) | 7 (6.0%) |
Fertility by Education in Christiansburg
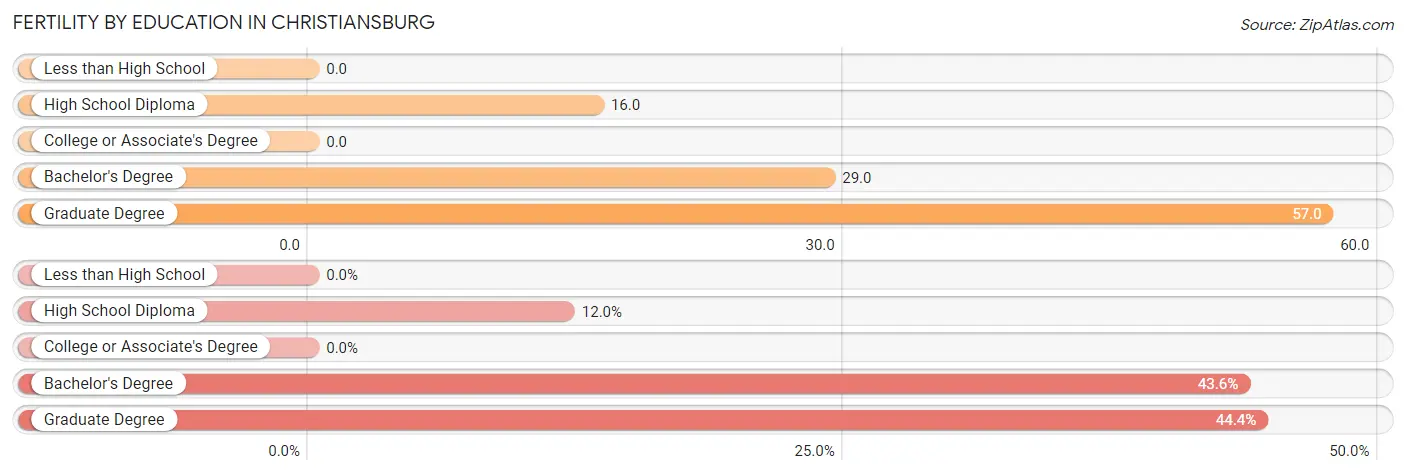
| Educational Attainment | Women with Births | Births / 1,000 Women |
| Less than High School | 0 (0.0%) | 0.0 |
| High School Diploma | 14 (12.0%) | 16.0 |
| College or Associate's Degree | 0 (0.0%) | 0.0 |
| Bachelor's Degree | 51 (43.6%) | 29.0 |
| Graduate Degree | 52 (44.4%) | 57.0 |
| Total | 117 (100.0%) | 21.0 |
Fertility by Education by Marriage Status in Christiansburg
6.0% of women with births in Christiansburg are unmarried. Women with the educational attainment of high school diploma are most likely to be married with 100.0% of them married at childbirth, while women with the educational attainment of bachelor's degree are least likely to be married with 13.7% of them unmarried at childbirth.
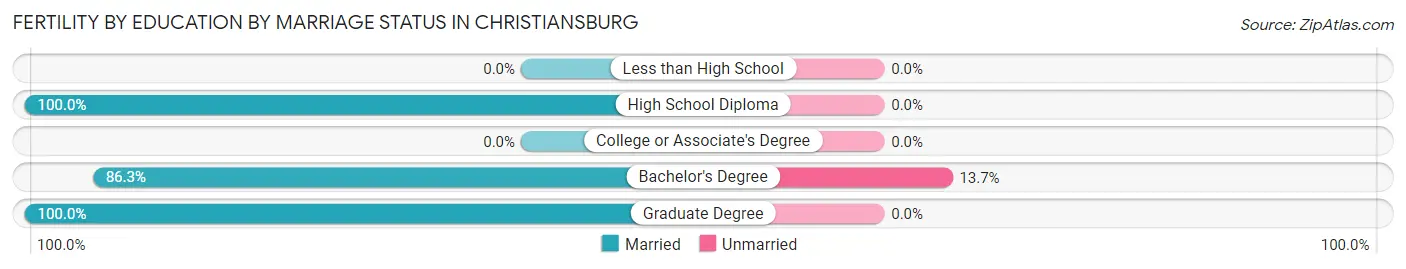
| Educational Attainment | Married | Unmarried |
| Less than High School | 0 (0.0%) | 0 (0.0%) |
| High School Diploma | 14 (100.0%) | 0 (0.0%) |
| College or Associate's Degree | 0 (0.0%) | 0 (0.0%) |
| Bachelor's Degree | 44 (86.3%) | 7 (13.7%) |
| Graduate Degree | 52 (100.0%) | 0 (0.0%) |
| Total | 110 (94.0%) | 7 (6.0%) |
Employment Characteristics in Christiansburg
Employment by Class of Employer in Christiansburg
Among the 11,749 employed individuals in Christiansburg, private company employees (6,936 | 59.0%), state government employees (1,935 | 16.5%), and not-for-profit organizations (1,060 | 9.0%) make up the most common classes of employment.
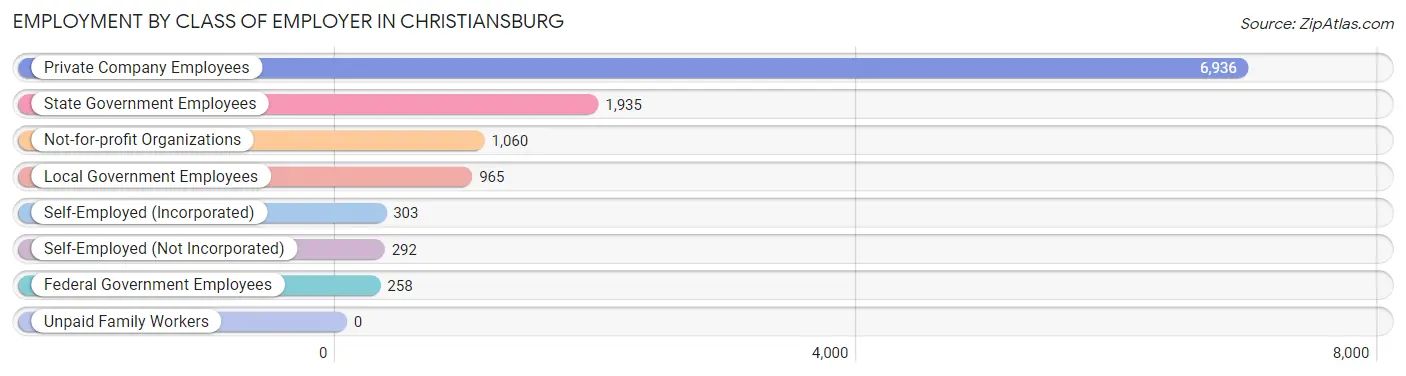
| Employer Class | # Employees | % Employees |
| Private Company Employees | 6,936 | 59.0% |
| Self-Employed (Incorporated) | 303 | 2.6% |
| Self-Employed (Not Incorporated) | 292 | 2.5% |
| Not-for-profit Organizations | 1,060 | 9.0% |
| Local Government Employees | 965 | 8.2% |
| State Government Employees | 1,935 | 16.5% |
| Federal Government Employees | 258 | 2.2% |
| Unpaid Family Workers | 0 | 0.0% |
| Total | 11,749 | 100.0% |
Employment Status by Age in Christiansburg
According to the labor force statistics for Christiansburg, out of the total population over 16 years of age (18,799), 64.8% or 12,182 individuals are in the labor force, with 2.4% or 292 of them unemployed. The age group with the highest labor force participation rate is 25 to 29 years, with 90.5% or 1,664 individuals in the labor force. Within the labor force, the 16 to 19 years age range has the highest percentage of unemployed individuals, with 14.9% or 56 of them being unemployed.
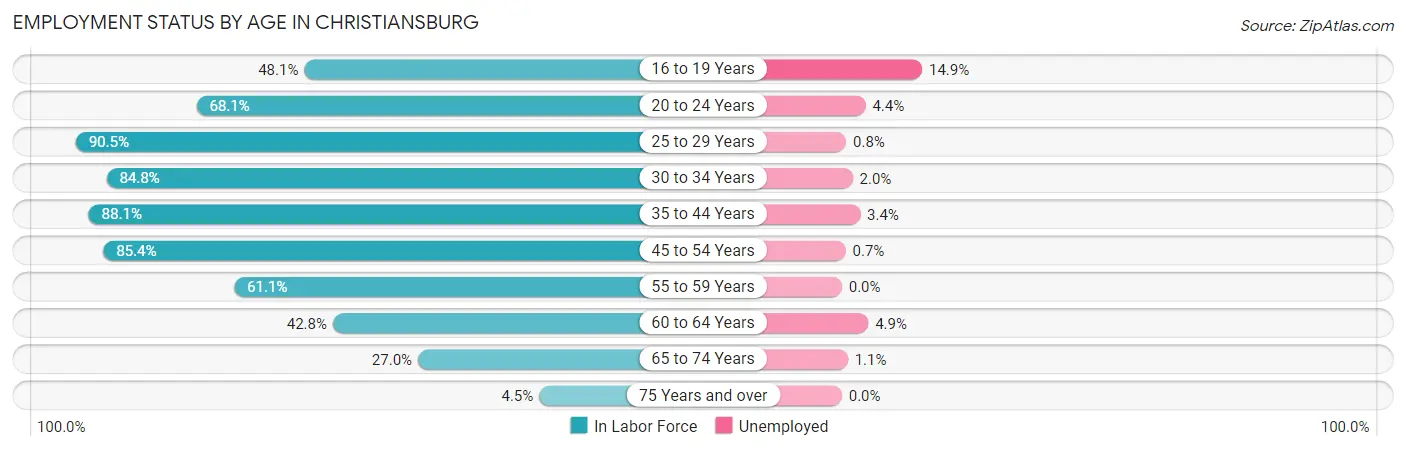
| Age Bracket | In Labor Force | Unemployed |
| 16 to 19 Years | 375 (48.1%) | 56 (14.9%) |
| 20 to 24 Years | 987 (68.1%) | 43 (4.4%) |
| 25 to 29 Years | 1,664 (90.5%) | 13 (0.8%) |
| 30 to 34 Years | 1,565 (84.8%) | 31 (2.0%) |
| 35 to 44 Years | 2,811 (88.1%) | 96 (3.4%) |
| 45 to 54 Years | 2,766 (85.4%) | 19 (0.7%) |
| 55 to 59 Years | 772 (61.1%) | 0 (0.0%) |
| 60 to 64 Years | 511 (42.8%) | 25 (4.9%) |
| 65 to 74 Years | 657 (27.0%) | 7 (1.1%) |
| 75 Years and over | 70 (4.5%) | 0 (0.0%) |
| Total | 12,182 (64.8%) | 292 (2.4%) |
Employment Status by Educational Attainment in Christiansburg
According to labor force statistics for Christiansburg, 80.2% of individuals (10,083) out of the total population between 25 and 64 years of age (12,572) are in the labor force, with 1.8% or 181 of them being unemployed. The group with the highest labor force participation rate are those with the educational attainment of bachelor's degree or higher, with 92.4% or 5,358 individuals in the labor force. Within the labor force, individuals with less than high school education have the highest percentage of unemployment, with 6.6% or 19 of them being unemployed.
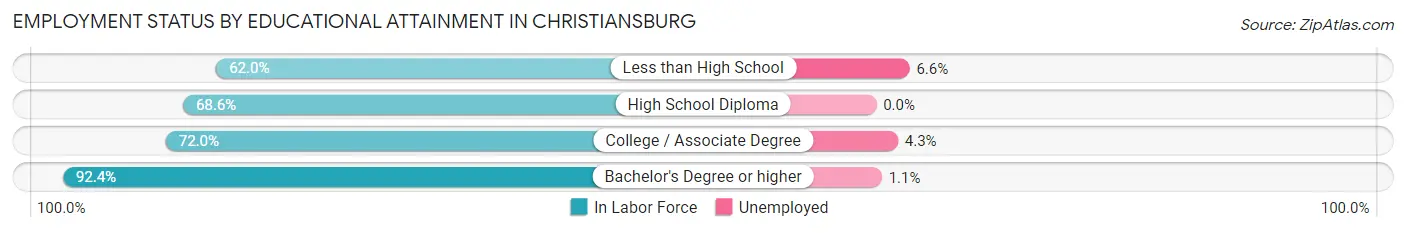
| Educational Attainment | In Labor Force | Unemployed |
| Less than High School | 290 (62.0%) | 31 (6.6%) |
| High School Diploma | 2,002 (68.6%) | 0 (0.0%) |
| College / Associate Degree | 2,439 (72.0%) | 146 (4.3%) |
| Bachelor's Degree or higher | 5,358 (92.4%) | 64 (1.1%) |
| Total | 10,083 (80.2%) | 226 (1.8%) |
Employment Occupations by Sex in Christiansburg
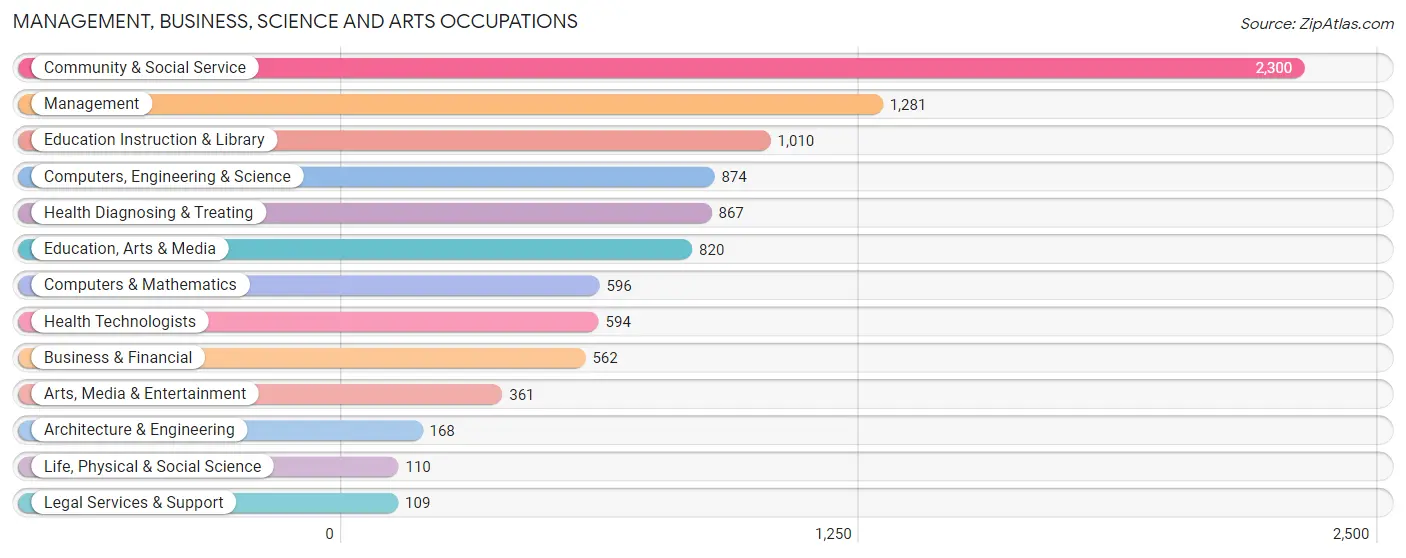
Management, Business, Science and Arts Occupations
The most common Management, Business, Science and Arts occupations in Christiansburg are Community & Social Service (2,300 | 19.4%), Management (1,281 | 10.8%), Education Instruction & Library (1,010 | 8.5%), Computers, Engineering & Science (874 | 7.4%), and Health Diagnosing & Treating (867 | 7.3%).
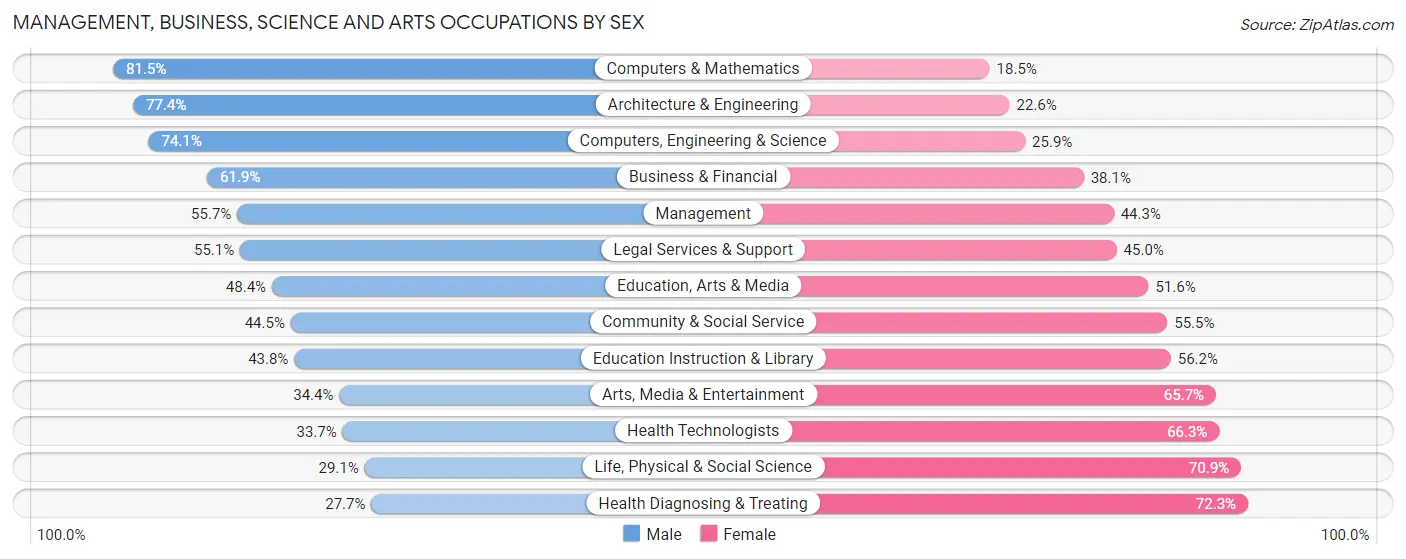
Management, Business, Science and Arts Occupations by Sex
Within the Management, Business, Science and Arts occupations in Christiansburg, the most male-oriented occupations are Computers & Mathematics (81.5%), Architecture & Engineering (77.4%), and Computers, Engineering & Science (74.1%), while the most female-oriented occupations are Health Diagnosing & Treating (72.3%), Life, Physical & Social Science (70.9%), and Health Technologists (66.3%).
| Occupation | Male | Female |
| Management | 713 (55.7%) | 568 (44.3%) |
| Business & Financial | 348 (61.9%) | 214 (38.1%) |
| Computers, Engineering & Science | 648 (74.1%) | 226 (25.9%) |
| Computers & Mathematics | 486 (81.5%) | 110 (18.5%) |
| Architecture & Engineering | 130 (77.4%) | 38 (22.6%) |
| Life, Physical & Social Science | 32 (29.1%) | 78 (70.9%) |
| Community & Social Service | 1,023 (44.5%) | 1,277 (55.5%) |
| Education, Arts & Media | 397 (48.4%) | 423 (51.6%) |
| Legal Services & Support | 60 (55.0%) | 49 (45.0%) |
| Education Instruction & Library | 442 (43.8%) | 568 (56.2%) |
| Arts, Media & Entertainment | 124 (34.4%) | 237 (65.6%) |
| Health Diagnosing & Treating | 240 (27.7%) | 627 (72.3%) |
| Health Technologists | 200 (33.7%) | 394 (66.3%) |
| Total (Category) | 2,972 (50.5%) | 2,912 (49.5%) |
| Total (Overall) | 6,237 (52.5%) | 5,633 (47.5%) |
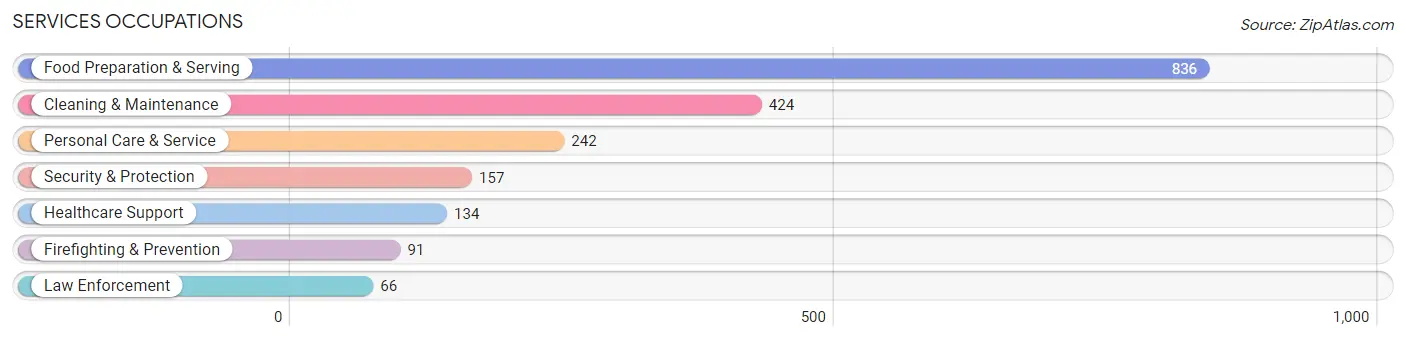
Services Occupations
The most common Services occupations in Christiansburg are Food Preparation & Serving (836 | 7.0%), Cleaning & Maintenance (424 | 3.6%), Personal Care & Service (242 | 2.0%), Security & Protection (157 | 1.3%), and Healthcare Support (134 | 1.1%).
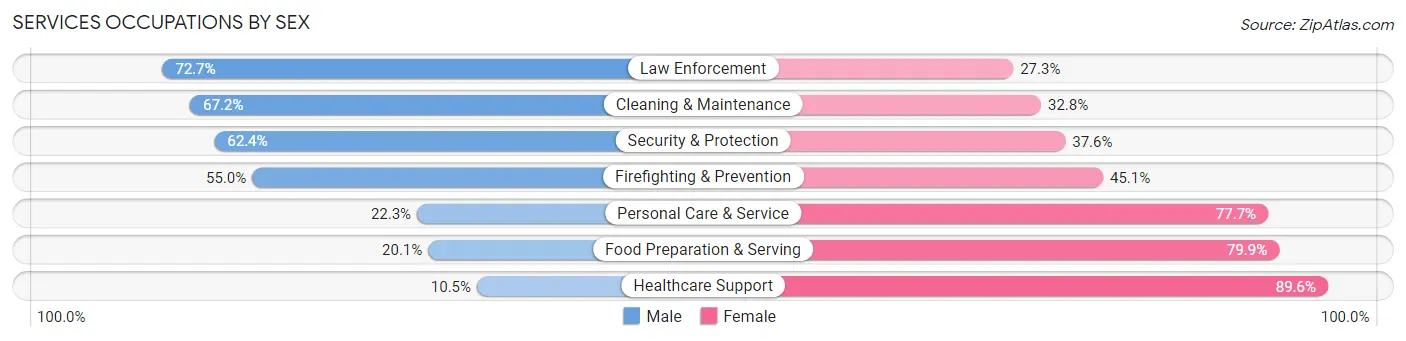
Services Occupations by Sex
Within the Services occupations in Christiansburg, the most male-oriented occupations are Law Enforcement (72.7%), Cleaning & Maintenance (67.2%), and Security & Protection (62.4%), while the most female-oriented occupations are Healthcare Support (89.5%), Food Preparation & Serving (79.9%), and Personal Care & Service (77.7%).
| Occupation | Male | Female |
| Healthcare Support | 14 (10.4%) | 120 (89.5%) |
| Security & Protection | 98 (62.4%) | 59 (37.6%) |
| Firefighting & Prevention | 50 (54.9%) | 41 (45.1%) |
| Law Enforcement | 48 (72.7%) | 18 (27.3%) |
| Food Preparation & Serving | 168 (20.1%) | 668 (79.9%) |
| Cleaning & Maintenance | 285 (67.2%) | 139 (32.8%) |
| Personal Care & Service | 54 (22.3%) | 188 (77.7%) |
| Total (Category) | 619 (34.5%) | 1,174 (65.5%) |
| Total (Overall) | 6,237 (52.5%) | 5,633 (47.5%) |
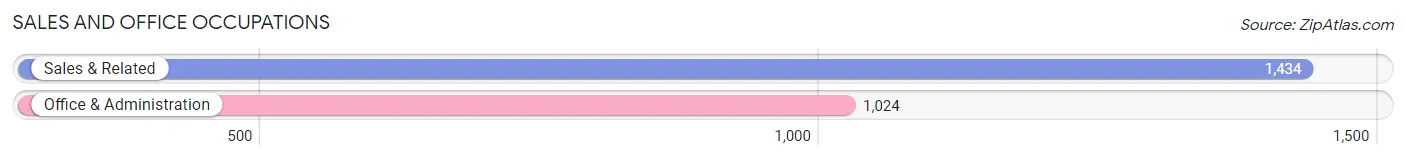
Sales and Office Occupations
The most common Sales and Office occupations in Christiansburg are Sales & Related (1,434 | 12.1%), and Office & Administration (1,024 | 8.6%).
Sales and Office Occupations by Sex
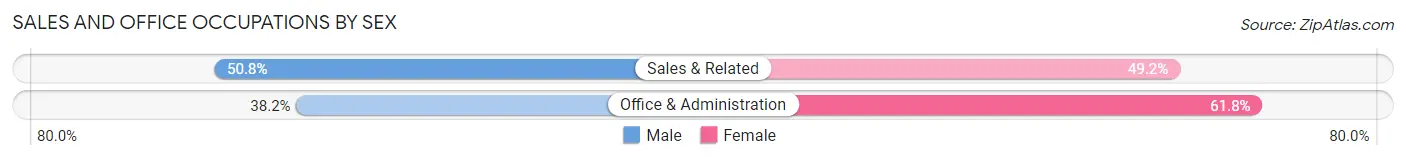
| Occupation | Male | Female |
| Sales & Related | 729 (50.8%) | 705 (49.2%) |
| Office & Administration | 391 (38.2%) | 633 (61.8%) |
| Total (Category) | 1,120 (45.6%) | 1,338 (54.4%) |
| Total (Overall) | 6,237 (52.5%) | 5,633 (47.5%) |
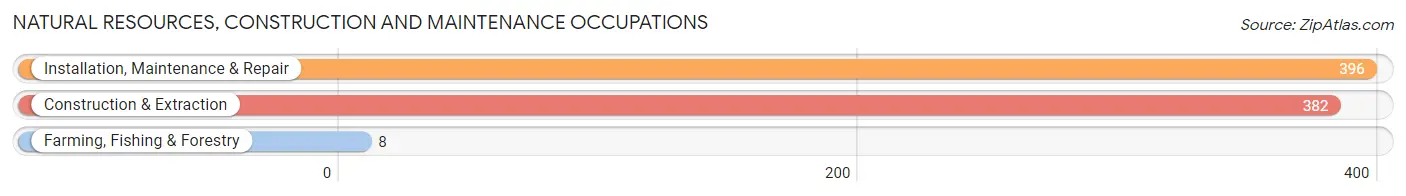
Natural Resources, Construction and Maintenance Occupations
The most common Natural Resources, Construction and Maintenance occupations in Christiansburg are Installation, Maintenance & Repair (396 | 3.3%), Construction & Extraction (382 | 3.2%), and Farming, Fishing & Forestry (8 | 0.1%).
Natural Resources, Construction and Maintenance Occupations by Sex
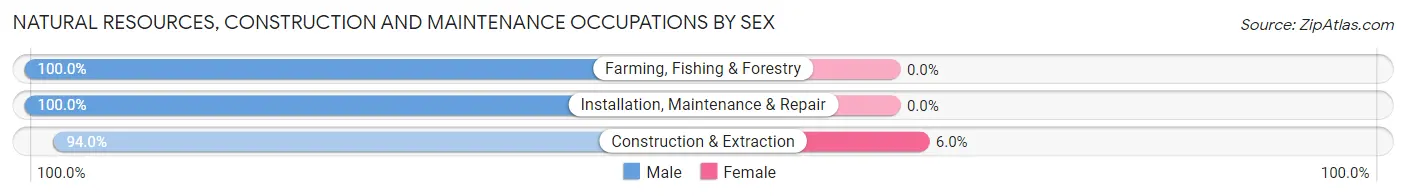
| Occupation | Male | Female |
| Farming, Fishing & Forestry | 8 (100.0%) | 0 (0.0%) |
| Construction & Extraction | 359 (94.0%) | 23 (6.0%) |
| Installation, Maintenance & Repair | 396 (100.0%) | 0 (0.0%) |
| Total (Category) | 763 (97.1%) | 23 (2.9%) |
| Total (Overall) | 6,237 (52.5%) | 5,633 (47.5%) |
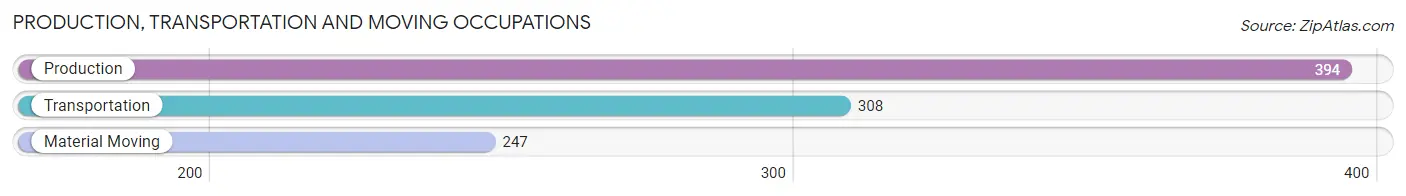
Production, Transportation and Moving Occupations
The most common Production, Transportation and Moving occupations in Christiansburg are Production (394 | 3.3%), Transportation (308 | 2.6%), and Material Moving (247 | 2.1%).
Production, Transportation and Moving Occupations by Sex
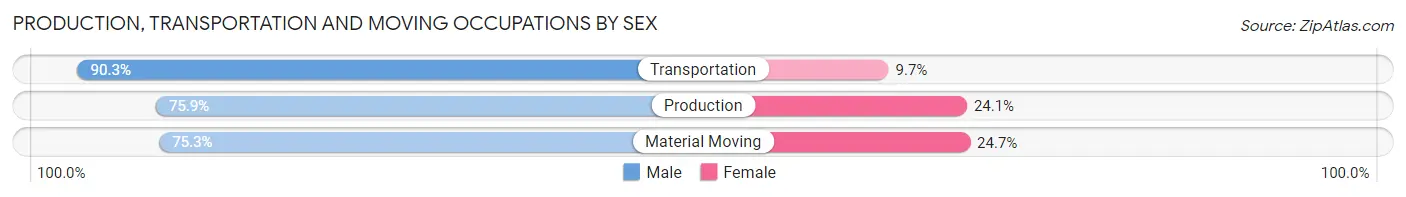
| Occupation | Male | Female |
| Production | 299 (75.9%) | 95 (24.1%) |
| Transportation | 278 (90.3%) | 30 (9.7%) |
| Material Moving | 186 (75.3%) | 61 (24.7%) |
| Total (Category) | 763 (80.4%) | 186 (19.6%) |
| Total (Overall) | 6,237 (52.5%) | 5,633 (47.5%) |
Employment Industries by Sex in Christiansburg
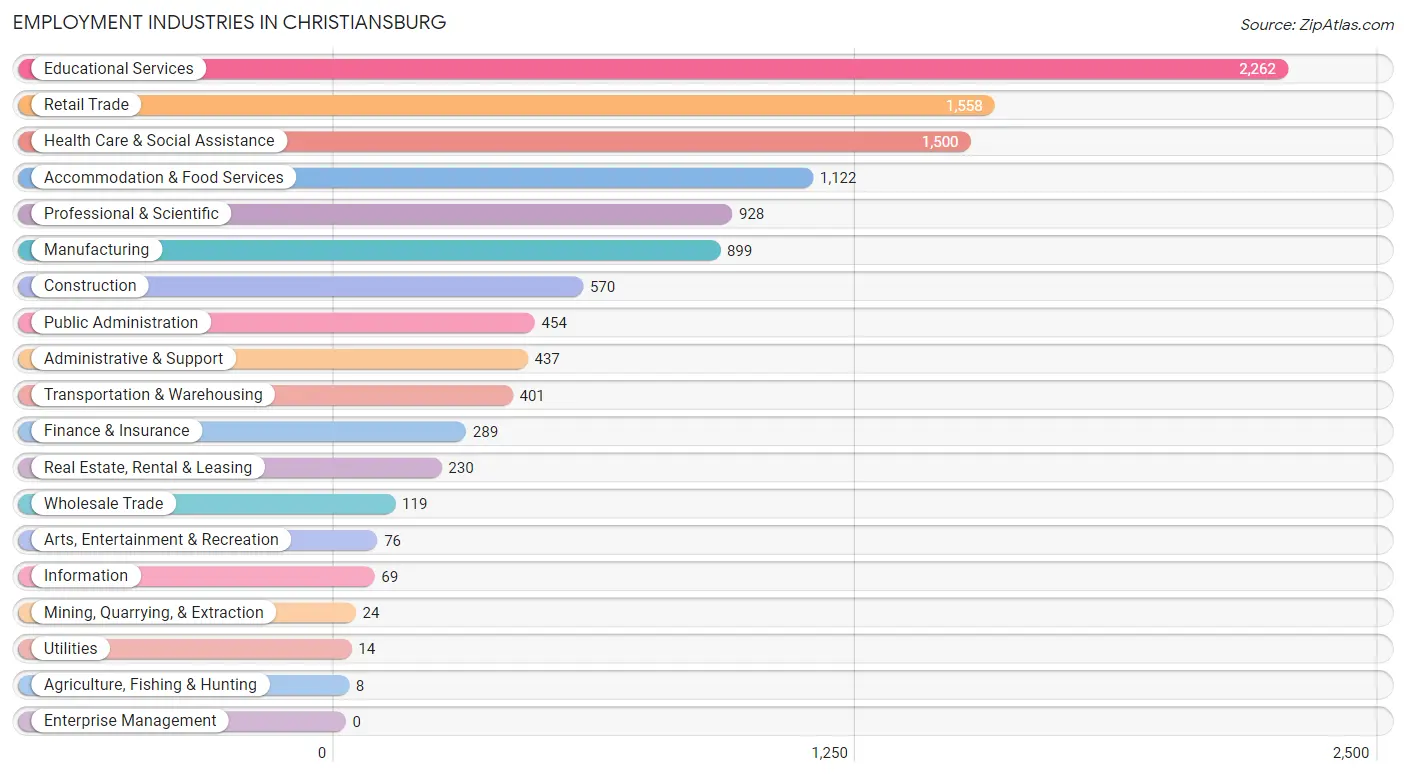
Employment Industries in Christiansburg
The major employment industries in Christiansburg include Educational Services (2,262 | 19.1%), Retail Trade (1,558 | 13.1%), Health Care & Social Assistance (1,500 | 12.6%), Accommodation & Food Services (1,122 | 9.5%), and Professional & Scientific (928 | 7.8%).
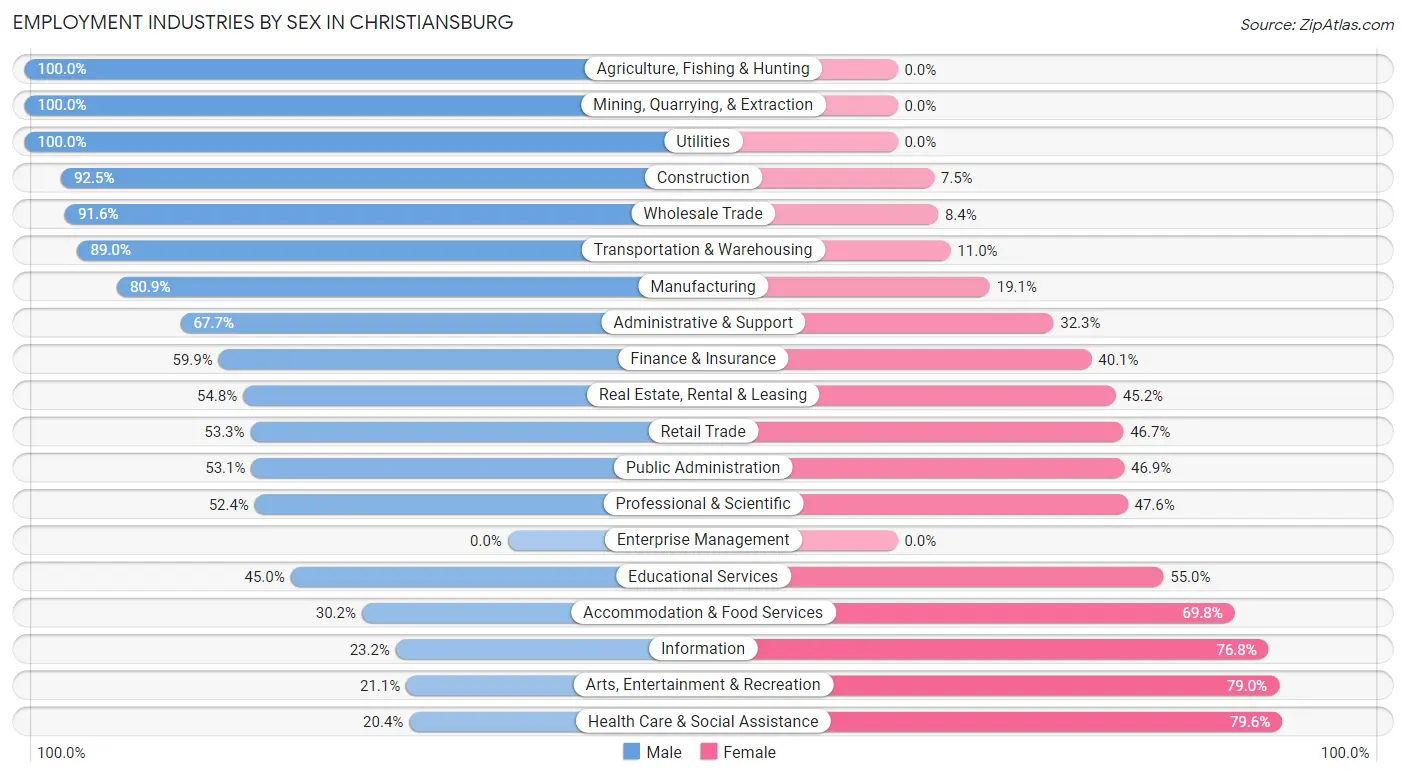
Employment Industries by Sex in Christiansburg
The Christiansburg industries that see more men than women are Agriculture, Fishing & Hunting (100.0%), Mining, Quarrying, & Extraction (100.0%), and Utilities (100.0%), whereas the industries that tend to have a higher number of women are Health Care & Social Assistance (79.6%), Arts, Entertainment & Recreation (78.9%), and Information (76.8%).
| Industry | Male | Female |
| Agriculture, Fishing & Hunting | 8 (100.0%) | 0 (0.0%) |
| Mining, Quarrying, & Extraction | 24 (100.0%) | 0 (0.0%) |
| Construction | 527 (92.5%) | 43 (7.5%) |
| Manufacturing | 727 (80.9%) | 172 (19.1%) |
| Wholesale Trade | 109 (91.6%) | 10 (8.4%) |
| Retail Trade | 830 (53.3%) | 728 (46.7%) |
| Transportation & Warehousing | 357 (89.0%) | 44 (11.0%) |
| Utilities | 14 (100.0%) | 0 (0.0%) |
| Information | 16 (23.2%) | 53 (76.8%) |
| Finance & Insurance | 173 (59.9%) | 116 (40.1%) |
| Real Estate, Rental & Leasing | 126 (54.8%) | 104 (45.2%) |
| Professional & Scientific | 486 (52.4%) | 442 (47.6%) |
| Enterprise Management | 0 (0.0%) | 0 (0.0%) |
| Administrative & Support | 296 (67.7%) | 141 (32.3%) |
| Educational Services | 1,017 (45.0%) | 1,245 (55.0%) |
| Health Care & Social Assistance | 306 (20.4%) | 1,194 (79.6%) |
| Arts, Entertainment & Recreation | 16 (21.0%) | 60 (78.9%) |
| Accommodation & Food Services | 339 (30.2%) | 783 (69.8%) |
| Public Administration | 241 (53.1%) | 213 (46.9%) |
| Total | 6,237 (52.5%) | 5,633 (47.5%) |
Education in Christiansburg
School Enrollment in Christiansburg
The most common levels of schooling among the 5,709 students in Christiansburg are elementary school (1,275 | 22.3%), college / undergraduate (1,231 | 21.6%), and middle school (1,080 | 18.9%).
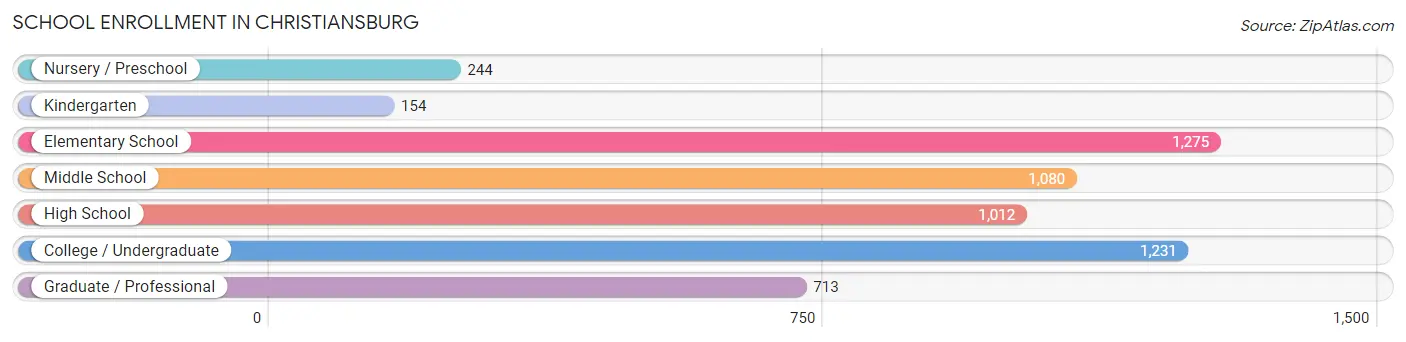
| School Level | # Students | % Students |
| Nursery / Preschool | 244 | 4.3% |
| Kindergarten | 154 | 2.7% |
| Elementary School | 1,275 | 22.3% |
| Middle School | 1,080 | 18.9% |
| High School | 1,012 | 17.7% |
| College / Undergraduate | 1,231 | 21.6% |
| Graduate / Professional | 713 | 12.5% |
| Total | 5,709 | 100.0% |
School Enrollment by Age by Funding Source in Christiansburg
Out of a total of 5,709 students who are enrolled in schools in Christiansburg, 617 (10.8%) attend a private institution, while the remaining 5,092 (89.2%) are enrolled in public schools. The age group of 3 to 4 year olds has the highest likelihood of being enrolled in private schools, with 75 (43.3% in the age bracket) enrolled. Conversely, the age group of 18 to 19 year olds has the lowest likelihood of being enrolled in a private school, with 193 (98.0% in the age bracket) attending a public institution.
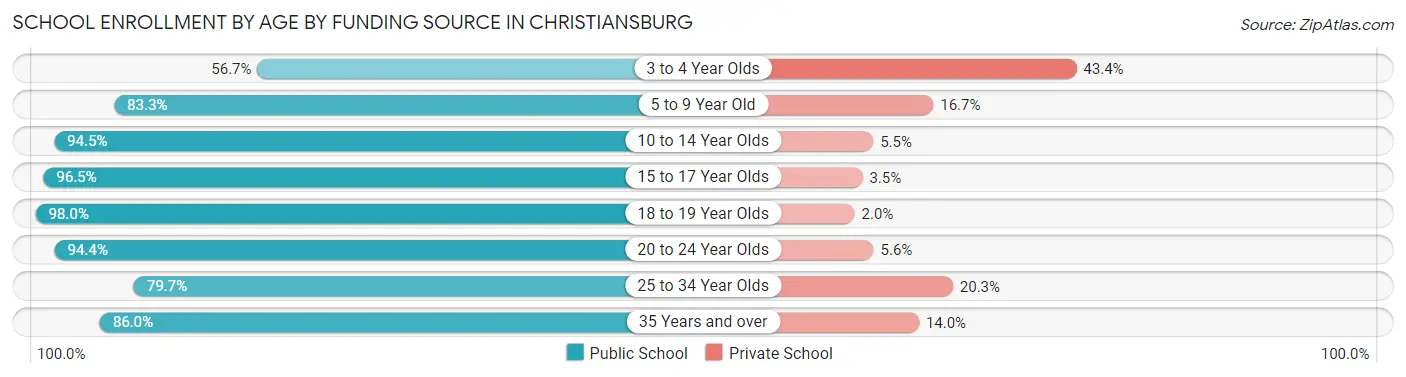
| Age Bracket | Public School | Private School |
| 3 to 4 Year Olds | 98 (56.7%) | 75 (43.3%) |
| 5 to 9 Year Old | 1,028 (83.3%) | 206 (16.7%) |
| 10 to 14 Year Olds | 1,423 (94.5%) | 83 (5.5%) |
| 15 to 17 Year Olds | 772 (96.5%) | 28 (3.5%) |
| 18 to 19 Year Olds | 193 (98.0%) | 4 (2.0%) |
| 20 to 24 Year Olds | 796 (94.4%) | 47 (5.6%) |
| 25 to 34 Year Olds | 466 (79.7%) | 119 (20.3%) |
| 35 Years and over | 319 (86.0%) | 52 (14.0%) |
| Total | 5,092 (89.2%) | 617 (10.8%) |
Educational Attainment by Field of Study in Christiansburg
Business (909 | 11.7%), arts & humanities (848 | 10.9%), education (840 | 10.8%), engineering (649 | 8.3%), and computers & mathematics (610 | 7.8%) are the most common fields of study among 7,778 individuals in Christiansburg who have obtained a bachelor's degree or higher.
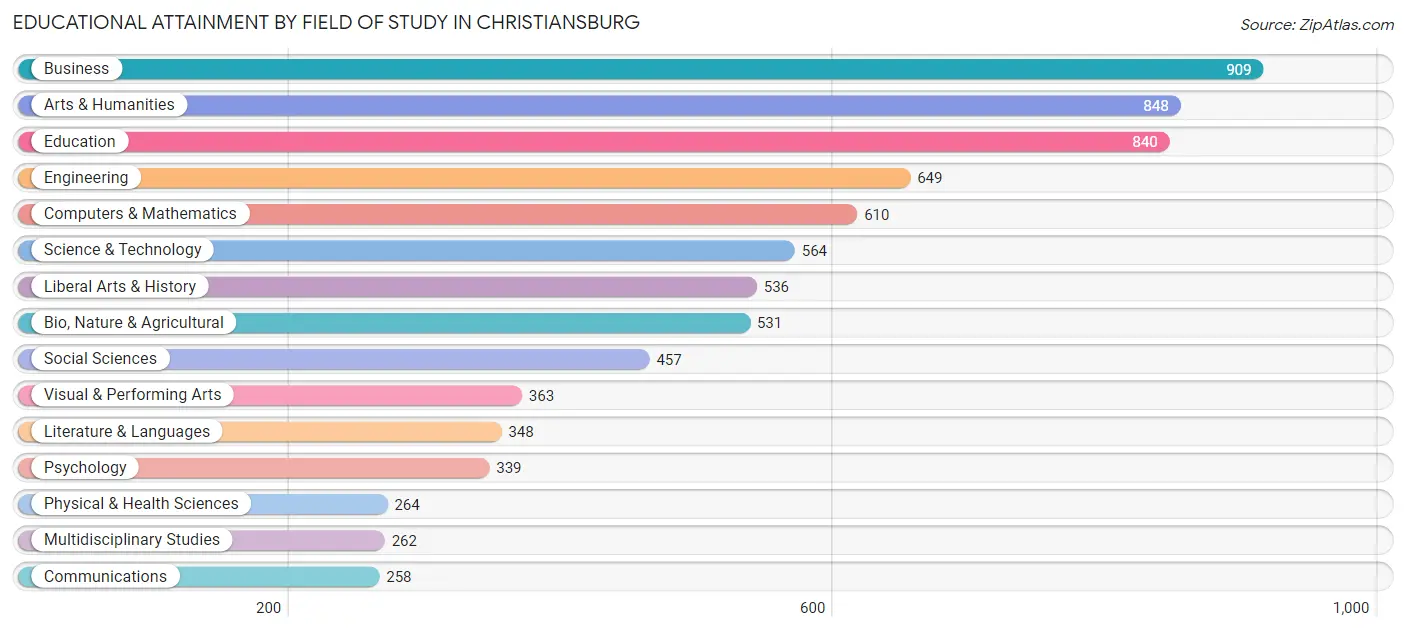
| Field of Study | # Graduates | % Graduates |
| Computers & Mathematics | 610 | 7.8% |
| Bio, Nature & Agricultural | 531 | 6.8% |
| Physical & Health Sciences | 264 | 3.4% |
| Psychology | 339 | 4.4% |
| Social Sciences | 457 | 5.9% |
| Engineering | 649 | 8.3% |
| Multidisciplinary Studies | 262 | 3.4% |
| Science & Technology | 564 | 7.2% |
| Business | 909 | 11.7% |
| Education | 840 | 10.8% |
| Literature & Languages | 348 | 4.5% |
| Liberal Arts & History | 536 | 6.9% |
| Visual & Performing Arts | 363 | 4.7% |
| Communications | 258 | 3.3% |
| Arts & Humanities | 848 | 10.9% |
| Total | 7,778 | 100.0% |
Transportation & Commute in Christiansburg
Vehicle Availability by Sex in Christiansburg
The most prevalent vehicle ownership categories in Christiansburg are males with 2 vehicles (3,522, accounting for 56.9%) and females with 2 vehicles (2,680, making up 63.9%).
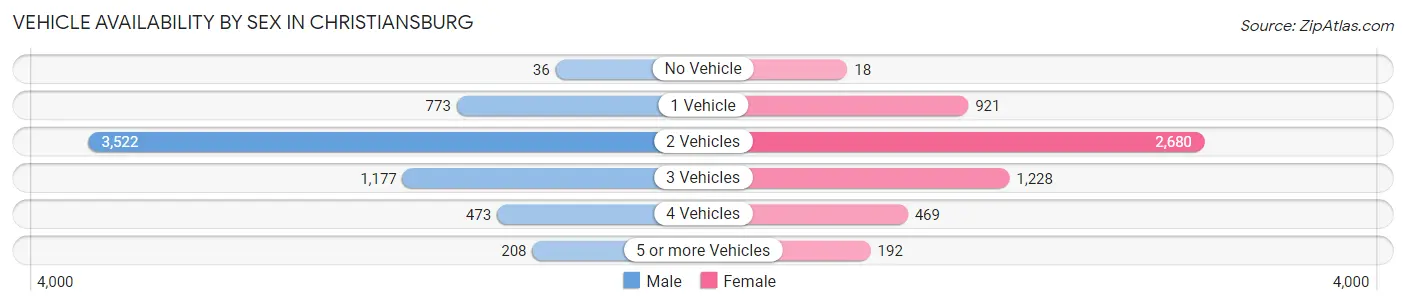
| Vehicles Available | Male | Female |
| No Vehicle | 36 (0.6%) | 18 (0.3%) |
| 1 Vehicle | 773 (12.5%) | 921 (16.7%) |
| 2 Vehicles | 3,522 (56.9%) | 2,680 (48.7%) |
| 3 Vehicles | 1,177 (19.0%) | 1,228 (22.3%) |
| 4 Vehicles | 473 (7.6%) | 469 (8.5%) |
| 5 or more Vehicles | 208 (3.4%) | 192 (3.5%) |
| Total | 6,189 (100.0%) | 5,508 (100.0%) |
Commute Time in Christiansburg
The most frequently occuring commute durations in Christiansburg are 15 to 19 minutes (3,122 commuters, 29.3%), 10 to 14 minutes (2,396 commuters, 22.5%), and 20 to 24 minutes (1,424 commuters, 13.4%).
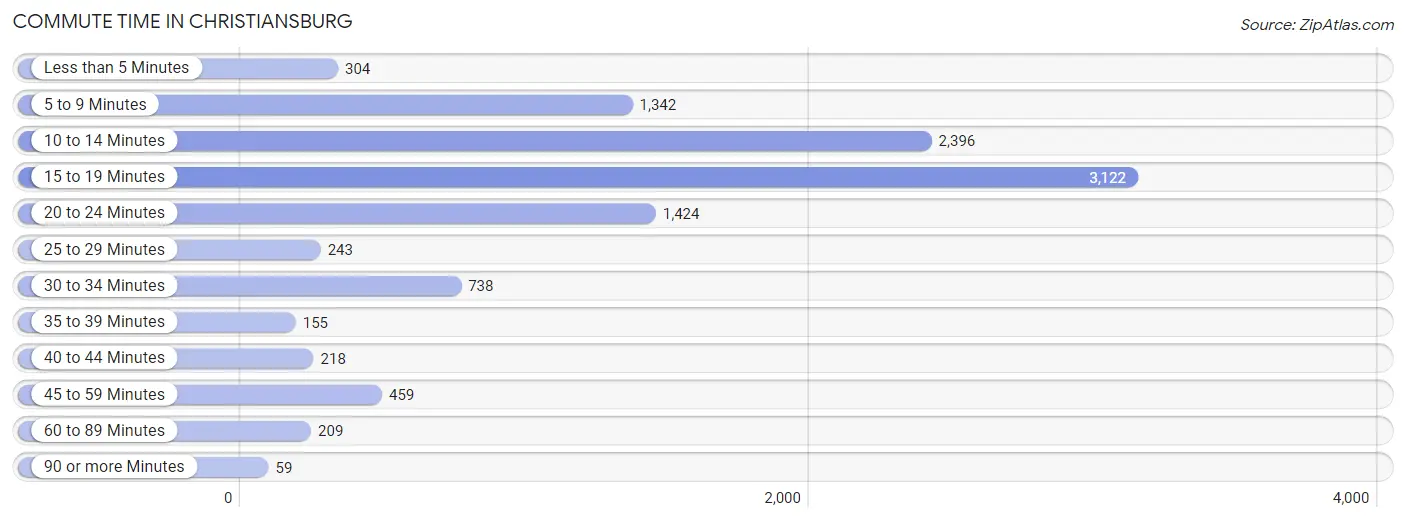
| Commute Time | # Commuters | % Commuters |
| Less than 5 Minutes | 304 | 2.9% |
| 5 to 9 Minutes | 1,342 | 12.6% |
| 10 to 14 Minutes | 2,396 | 22.5% |
| 15 to 19 Minutes | 3,122 | 29.3% |
| 20 to 24 Minutes | 1,424 | 13.4% |
| 25 to 29 Minutes | 243 | 2.3% |
| 30 to 34 Minutes | 738 | 6.9% |
| 35 to 39 Minutes | 155 | 1.5% |
| 40 to 44 Minutes | 218 | 2.0% |
| 45 to 59 Minutes | 459 | 4.3% |
| 60 to 89 Minutes | 209 | 2.0% |
| 90 or more Minutes | 59 | 0.5% |
Commute Time by Sex in Christiansburg
The most common commute times in Christiansburg are 15 to 19 minutes (1,726 commuters, 30.9%) for males and 15 to 19 minutes (1,396 commuters, 27.4%) for females.
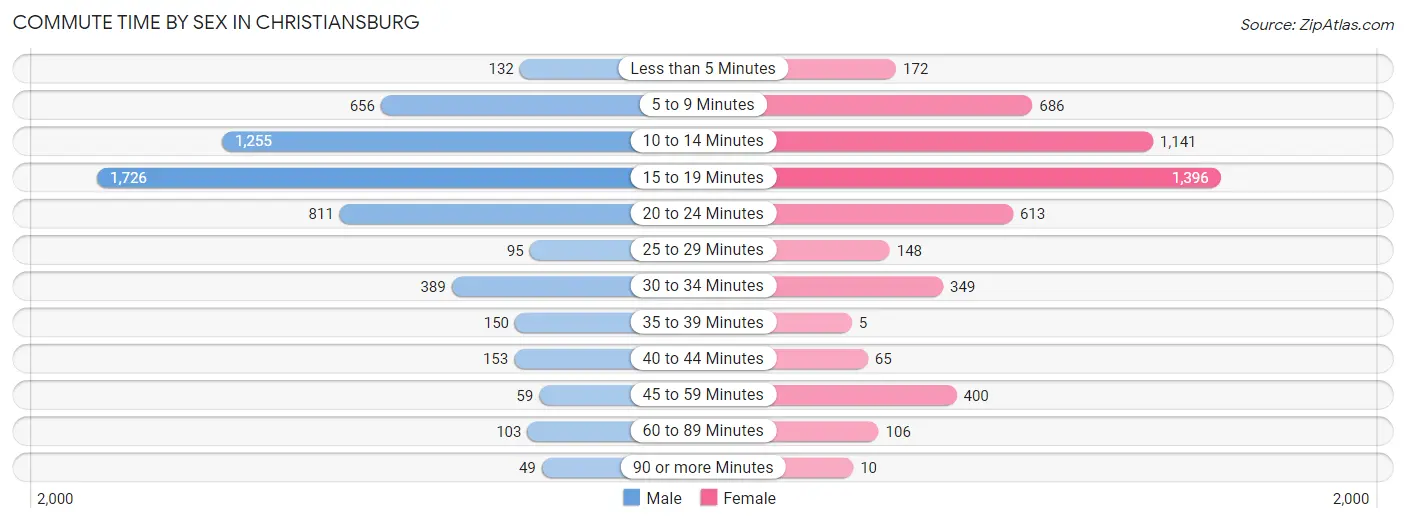
| Commute Time | Male | Female |
| Less than 5 Minutes | 132 (2.4%) | 172 (3.4%) |
| 5 to 9 Minutes | 656 (11.8%) | 686 (13.5%) |
| 10 to 14 Minutes | 1,255 (22.5%) | 1,141 (22.4%) |
| 15 to 19 Minutes | 1,726 (30.9%) | 1,396 (27.4%) |
| 20 to 24 Minutes | 811 (14.5%) | 613 (12.0%) |
| 25 to 29 Minutes | 95 (1.7%) | 148 (2.9%) |
| 30 to 34 Minutes | 389 (7.0%) | 349 (6.9%) |
| 35 to 39 Minutes | 150 (2.7%) | 5 (0.1%) |
| 40 to 44 Minutes | 153 (2.7%) | 65 (1.3%) |
| 45 to 59 Minutes | 59 (1.1%) | 400 (7.9%) |
| 60 to 89 Minutes | 103 (1.8%) | 106 (2.1%) |
| 90 or more Minutes | 49 (0.9%) | 10 (0.2%) |
Time of Departure to Work by Sex in Christiansburg
The most frequent times of departure to work in Christiansburg are 7:30 AM to 7:59 AM (1,100, 19.7%) for males and 8:00 AM to 8:29 AM (993, 19.5%) for females.
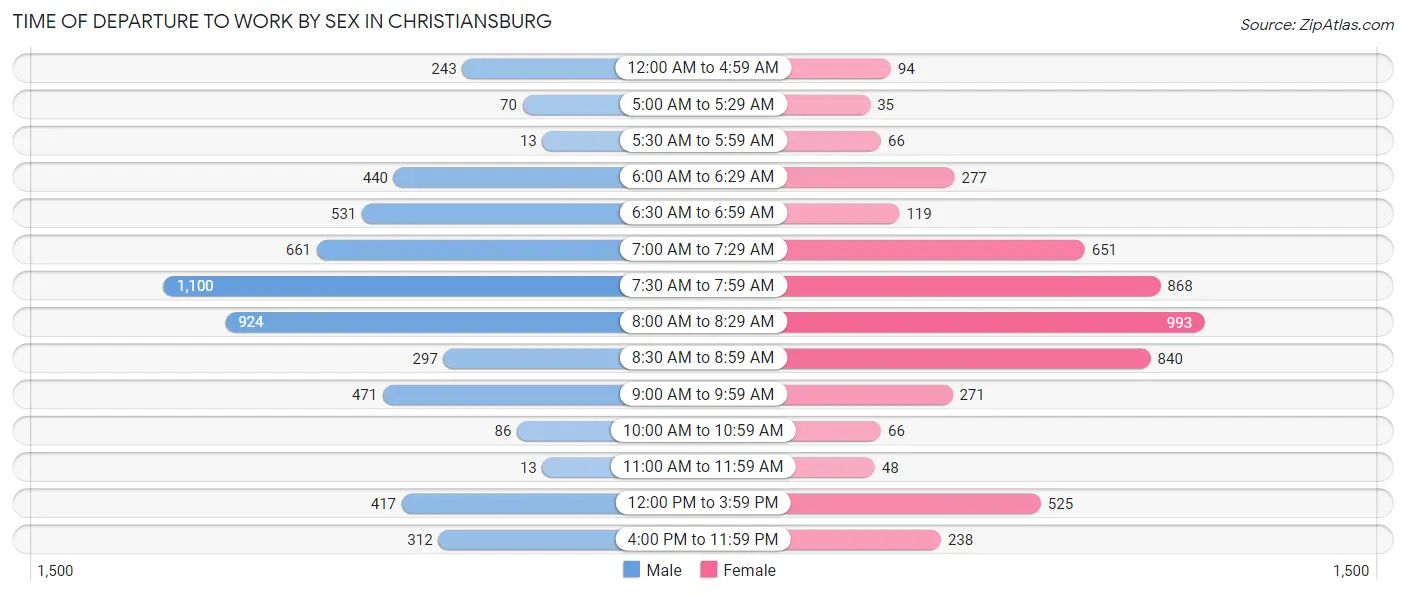
| Time of Departure | Male | Female |
| 12:00 AM to 4:59 AM | 243 (4.4%) | 94 (1.8%) |
| 5:00 AM to 5:29 AM | 70 (1.3%) | 35 (0.7%) |
| 5:30 AM to 5:59 AM | 13 (0.2%) | 66 (1.3%) |
| 6:00 AM to 6:29 AM | 440 (7.9%) | 277 (5.4%) |
| 6:30 AM to 6:59 AM | 531 (9.5%) | 119 (2.3%) |
| 7:00 AM to 7:29 AM | 661 (11.8%) | 651 (12.8%) |
| 7:30 AM to 7:59 AM | 1,100 (19.7%) | 868 (17.1%) |
| 8:00 AM to 8:29 AM | 924 (16.6%) | 993 (19.5%) |
| 8:30 AM to 8:59 AM | 297 (5.3%) | 840 (16.5%) |
| 9:00 AM to 9:59 AM | 471 (8.4%) | 271 (5.3%) |
| 10:00 AM to 10:59 AM | 86 (1.5%) | 66 (1.3%) |
| 11:00 AM to 11:59 AM | 13 (0.2%) | 48 (0.9%) |
| 12:00 PM to 3:59 PM | 417 (7.5%) | 525 (10.3%) |
| 4:00 PM to 11:59 PM | 312 (5.6%) | 238 (4.7%) |
| Total | 5,578 (100.0%) | 5,091 (100.0%) |
Housing Occupancy in Christiansburg
Occupancy by Ownership in Christiansburg
Of the total 9,686 dwellings in Christiansburg, owner-occupied units account for 6,048 (62.4%), while renter-occupied units make up 3,638 (37.6%).
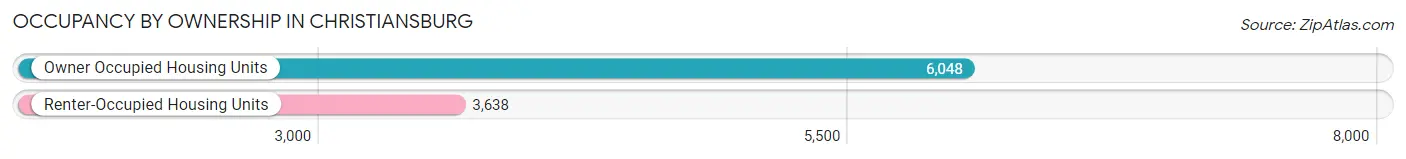
| Occupancy | # Housing Units | % Housing Units |
| Owner Occupied Housing Units | 6,048 | 62.4% |
| Renter-Occupied Housing Units | 3,638 | 37.6% |
| Total Occupied Housing Units | 9,686 | 100.0% |
Occupancy by Household Size in Christiansburg
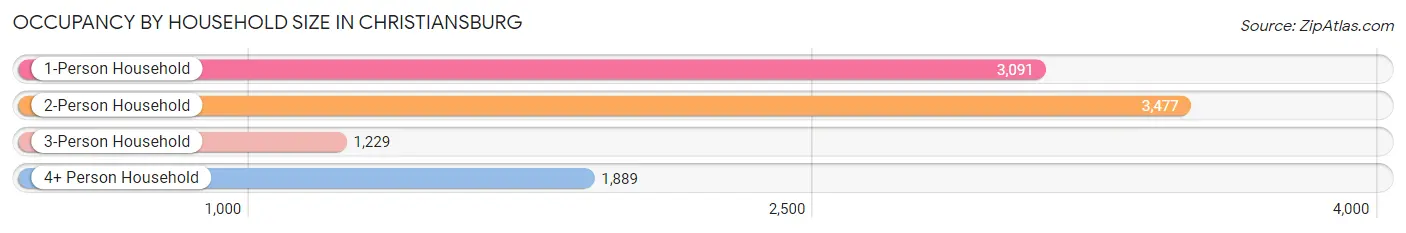
| Household Size | # Housing Units | % Housing Units |
| 1-Person Household | 3,091 | 31.9% |
| 2-Person Household | 3,477 | 35.9% |
| 3-Person Household | 1,229 | 12.7% |
| 4+ Person Household | 1,889 | 19.5% |
| Total Housing Units | 9,686 | 100.0% |
Occupancy by Ownership by Household Size in Christiansburg
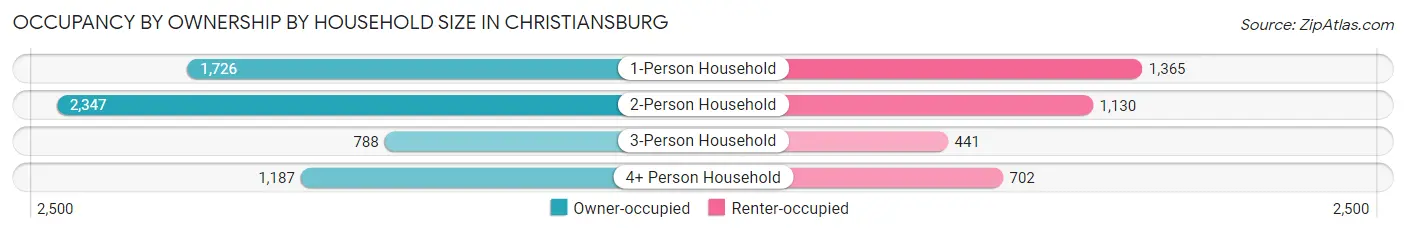
| Household Size | Owner-occupied | Renter-occupied |
| 1-Person Household | 1,726 (55.8%) | 1,365 (44.2%) |
| 2-Person Household | 2,347 (67.5%) | 1,130 (32.5%) |
| 3-Person Household | 788 (64.1%) | 441 (35.9%) |
| 4+ Person Household | 1,187 (62.8%) | 702 (37.2%) |
| Total Housing Units | 6,048 (62.4%) | 3,638 (37.6%) |
Occupancy by Educational Attainment in Christiansburg
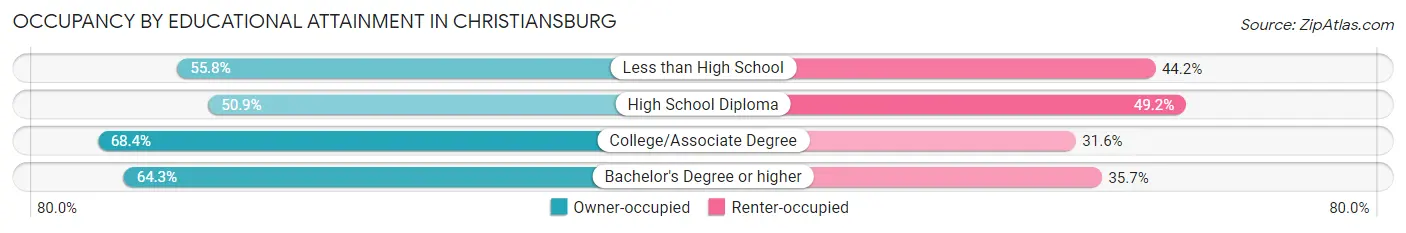
| Household Size | Owner-occupied | Renter-occupied |
| Less than High School | 352 (55.8%) | 279 (44.2%) |
| High School Diploma | 895 (50.8%) | 865 (49.1%) |
| College/Associate Degree | 1,872 (68.4%) | 865 (31.6%) |
| Bachelor's Degree or higher | 2,929 (64.3%) | 1,629 (35.7%) |
Occupancy by Age of Householder in Christiansburg
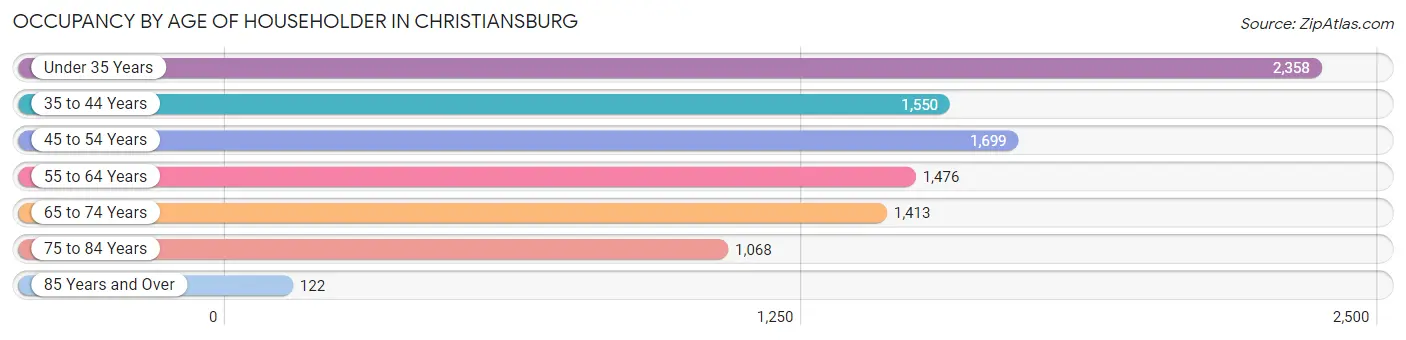
| Age Bracket | # Households | % Households |
| Under 35 Years | 2,358 | 24.3% |
| 35 to 44 Years | 1,550 | 16.0% |
| 45 to 54 Years | 1,699 | 17.5% |
| 55 to 64 Years | 1,476 | 15.2% |
| 65 to 74 Years | 1,413 | 14.6% |
| 75 to 84 Years | 1,068 | 11.0% |
| 85 Years and Over | 122 | 1.3% |
| Total | 9,686 | 100.0% |
Housing Finances in Christiansburg
Median Income by Occupancy in Christiansburg
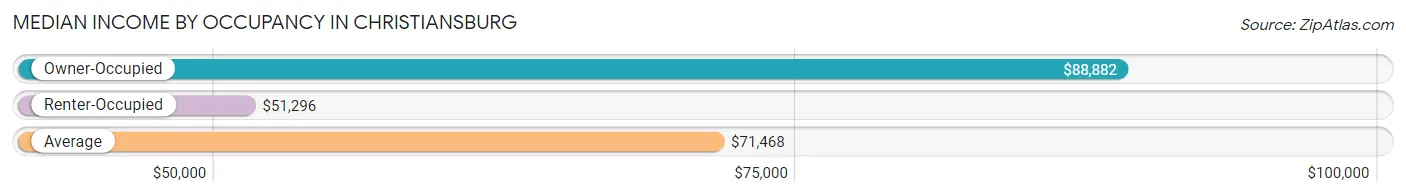
| Occupancy Type | # Households | Median Income |
| Owner-Occupied | 6,048 (62.4%) | $88,882 |
| Renter-Occupied | 3,638 (37.6%) | $51,296 |
| Average | 9,686 (100.0%) | $71,468 |
Occupancy by Householder Income Bracket in Christiansburg
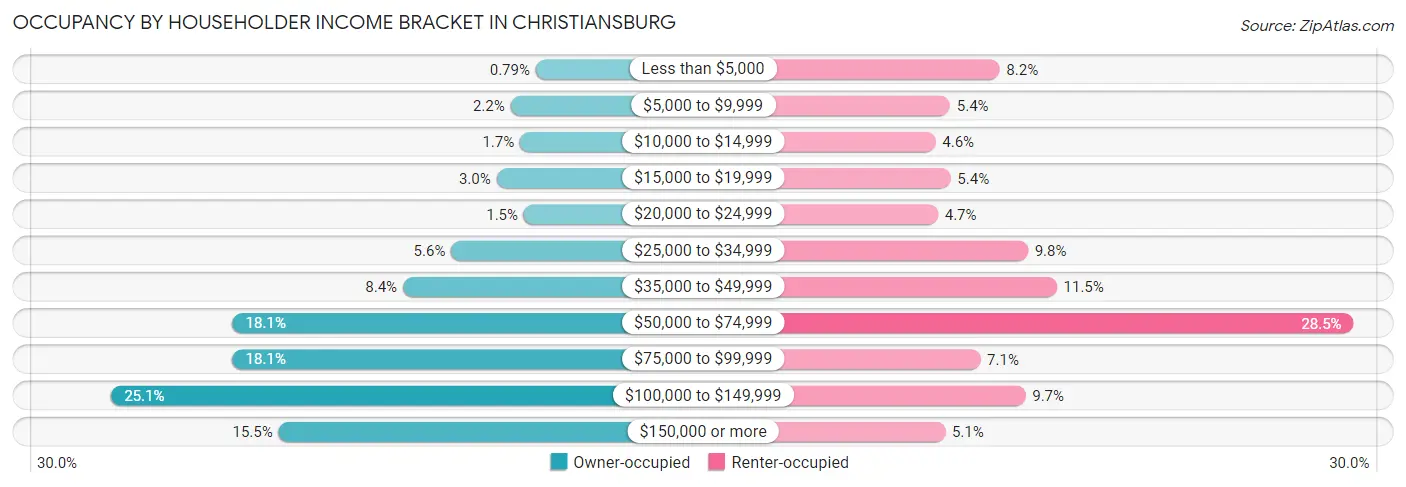
| Income Bracket | Owner-occupied | Renter-occupied |
| Less than $5,000 | 48 (0.8%) | 299 (8.2%) |
| $5,000 to $9,999 | 135 (2.2%) | 196 (5.4%) |
| $10,000 to $14,999 | 102 (1.7%) | 166 (4.6%) |
| $15,000 to $19,999 | 183 (3.0%) | 197 (5.4%) |
| $20,000 to $24,999 | 89 (1.5%) | 171 (4.7%) |
| $25,000 to $34,999 | 340 (5.6%) | 358 (9.8%) |
| $35,000 to $49,999 | 507 (8.4%) | 418 (11.5%) |
| $50,000 to $74,999 | 1,096 (18.1%) | 1,035 (28.4%) |
| $75,000 to $99,999 | 1,096 (18.1%) | 259 (7.1%) |
| $100,000 to $149,999 | 1,515 (25.1%) | 353 (9.7%) |
| $150,000 or more | 937 (15.5%) | 186 (5.1%) |
| Total | 6,048 (100.0%) | 3,638 (100.0%) |
Monthly Housing Cost Tiers in Christiansburg
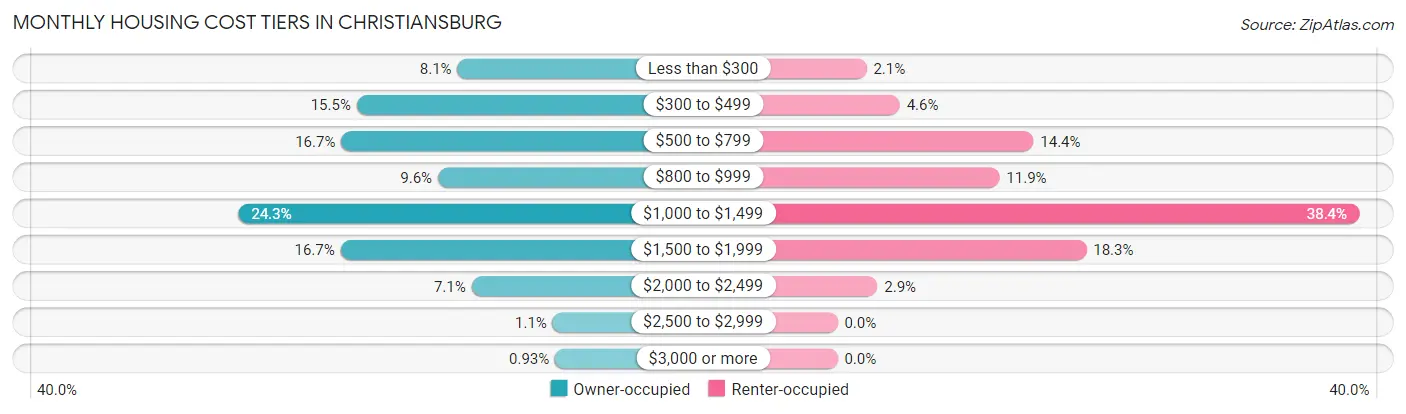
| Monthly Cost | Owner-occupied | Renter-occupied |
| Less than $300 | 491 (8.1%) | 78 (2.1%) |
| $300 to $499 | 940 (15.5%) | 167 (4.6%) |
| $500 to $799 | 1,009 (16.7%) | 525 (14.4%) |
| $800 to $999 | 578 (9.6%) | 434 (11.9%) |
| $1,000 to $1,499 | 1,467 (24.3%) | 1,397 (38.4%) |
| $1,500 to $1,999 | 1,012 (16.7%) | 667 (18.3%) |
| $2,000 to $2,499 | 428 (7.1%) | 107 (2.9%) |
| $2,500 to $2,999 | 67 (1.1%) | 0 (0.0%) |
| $3,000 or more | 56 (0.9%) | 0 (0.0%) |
| Total | 6,048 (100.0%) | 3,638 (100.0%) |
Physical Housing Characteristics in Christiansburg
Housing Structures in Christiansburg
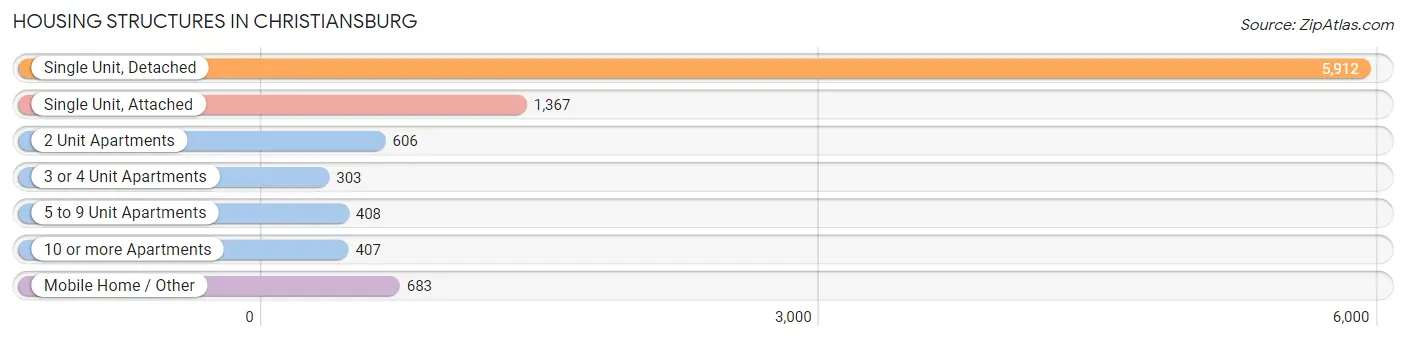
| Structure Type | # Housing Units | % Housing Units |
| Single Unit, Detached | 5,912 | 61.0% |
| Single Unit, Attached | 1,367 | 14.1% |
| 2 Unit Apartments | 606 | 6.3% |
| 3 or 4 Unit Apartments | 303 | 3.1% |
| 5 to 9 Unit Apartments | 408 | 4.2% |
| 10 or more Apartments | 407 | 4.2% |
| Mobile Home / Other | 683 | 7.0% |
| Total | 9,686 | 100.0% |
Housing Structures by Occupancy in Christiansburg
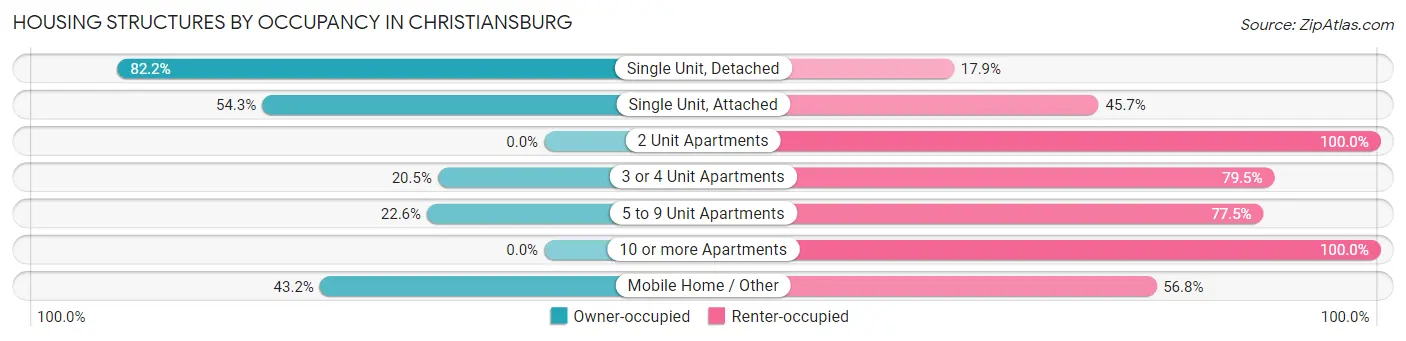
| Structure Type | Owner-occupied | Renter-occupied |
| Single Unit, Detached | 4,857 (82.2%) | 1,055 (17.8%) |
| Single Unit, Attached | 742 (54.3%) | 625 (45.7%) |
| 2 Unit Apartments | 0 (0.0%) | 606 (100.0%) |
| 3 or 4 Unit Apartments | 62 (20.5%) | 241 (79.5%) |
| 5 to 9 Unit Apartments | 92 (22.6%) | 316 (77.4%) |
| 10 or more Apartments | 0 (0.0%) | 407 (100.0%) |
| Mobile Home / Other | 295 (43.2%) | 388 (56.8%) |
| Total | 6,048 (62.4%) | 3,638 (37.6%) |
Housing Structures by Number of Rooms in Christiansburg
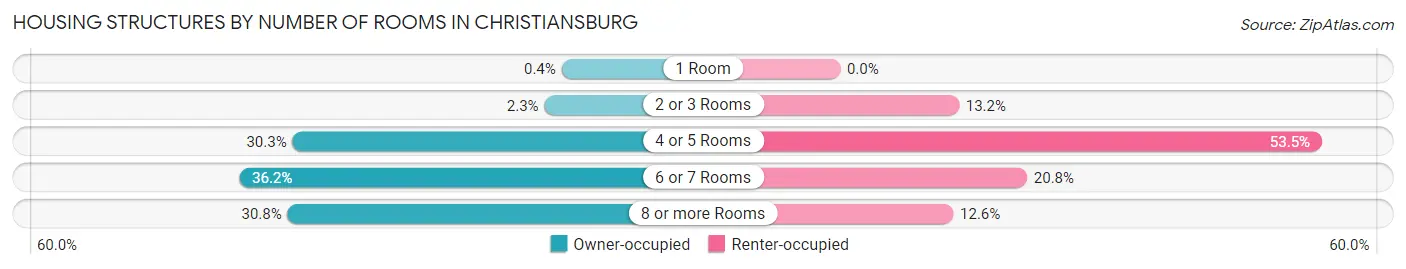
| Number of Rooms | Owner-occupied | Renter-occupied |
| 1 Room | 24 (0.4%) | 0 (0.0%) |
| 2 or 3 Rooms | 140 (2.3%) | 480 (13.2%) |
| 4 or 5 Rooms | 1,831 (30.3%) | 1,946 (53.5%) |
| 6 or 7 Rooms | 2,189 (36.2%) | 755 (20.7%) |
| 8 or more Rooms | 1,864 (30.8%) | 457 (12.6%) |
| Total | 6,048 (100.0%) | 3,638 (100.0%) |
Housing Structure by Heating Type in Christiansburg
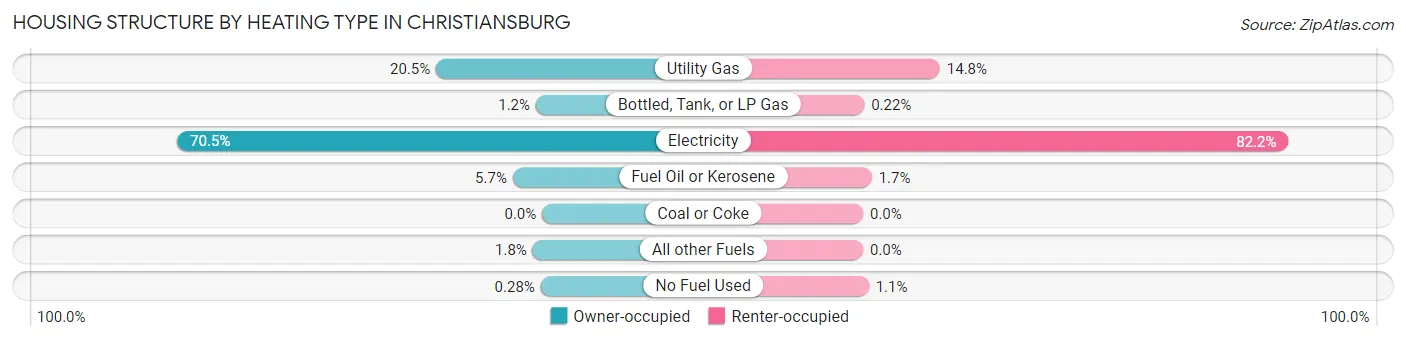
| Heating Type | Owner-occupied | Renter-occupied |
| Utility Gas | 1,240 (20.5%) | 540 (14.8%) |
| Bottled, Tank, or LP Gas | 73 (1.2%) | 8 (0.2%) |
| Electricity | 4,265 (70.5%) | 2,989 (82.2%) |
| Fuel Oil or Kerosene | 343 (5.7%) | 61 (1.7%) |
| Coal or Coke | 0 (0.0%) | 0 (0.0%) |
| All other Fuels | 110 (1.8%) | 0 (0.0%) |
| No Fuel Used | 17 (0.3%) | 40 (1.1%) |
| Total | 6,048 (100.0%) | 3,638 (100.0%) |
Household Vehicle Usage in Christiansburg
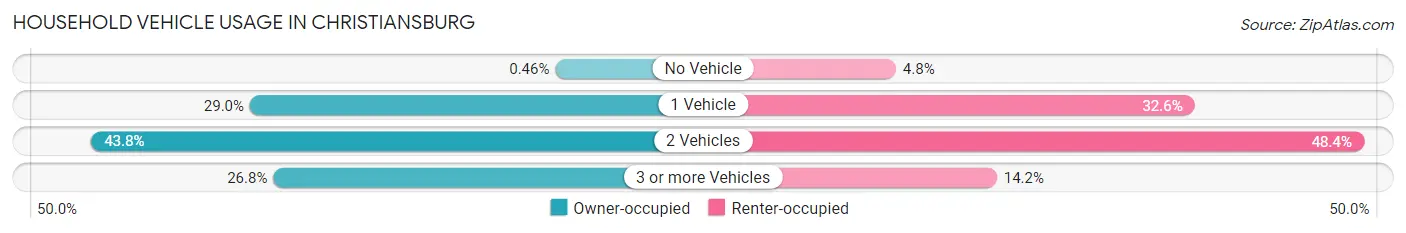
| Vehicles per Household | Owner-occupied | Renter-occupied |
| No Vehicle | 28 (0.5%) | 173 (4.8%) |
| 1 Vehicle | 1,752 (29.0%) | 1,187 (32.6%) |
| 2 Vehicles | 2,648 (43.8%) | 1,762 (48.4%) |
| 3 or more Vehicles | 1,620 (26.8%) | 516 (14.2%) |
| Total | 6,048 (100.0%) | 3,638 (100.0%) |
Real Estate & Mortgages in Christiansburg
Real Estate and Mortgage Overview in Christiansburg
| Characteristic | Without Mortgage | With Mortgage |
| Housing Units | 2,499 | 3,549 |
| Median Property Value | $232,700 | $230,500 |
| Median Household Income | $77,066 | $639 |
| Monthly Housing Costs | $461 | $42 |
| Real Estate Taxes | $1,923 | $82 |
Property Value by Mortgage Status in Christiansburg
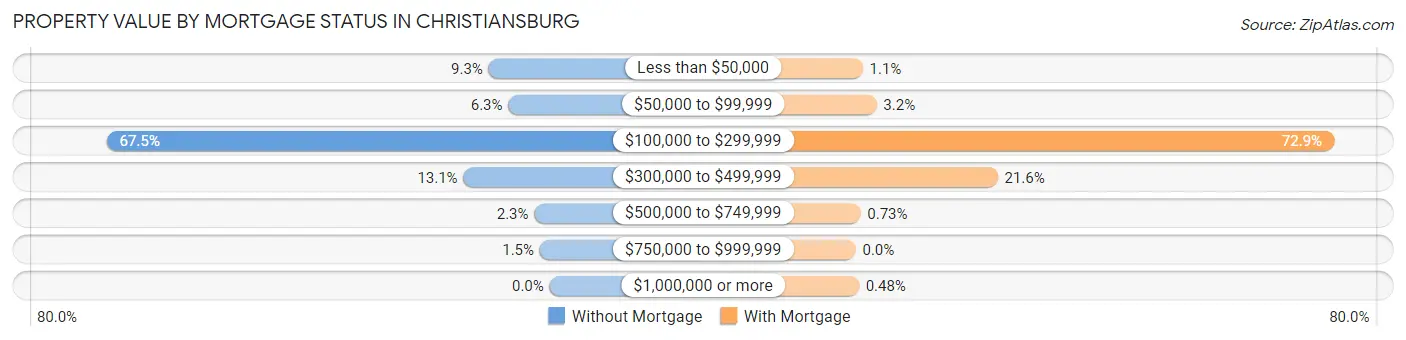
| Property Value | Without Mortgage | With Mortgage |
| Less than $50,000 | 232 (9.3%) | 38 (1.1%) |
| $50,000 to $99,999 | 157 (6.3%) | 113 (3.2%) |
| $100,000 to $299,999 | 1,687 (67.5%) | 2,587 (72.9%) |
| $300,000 to $499,999 | 328 (13.1%) | 768 (21.6%) |
| $500,000 to $749,999 | 58 (2.3%) | 26 (0.7%) |
| $750,000 to $999,999 | 37 (1.5%) | 0 (0.0%) |
| $1,000,000 or more | 0 (0.0%) | 17 (0.5%) |
| Total | 2,499 (100.0%) | 3,549 (100.0%) |
Household Income by Mortgage Status in Christiansburg
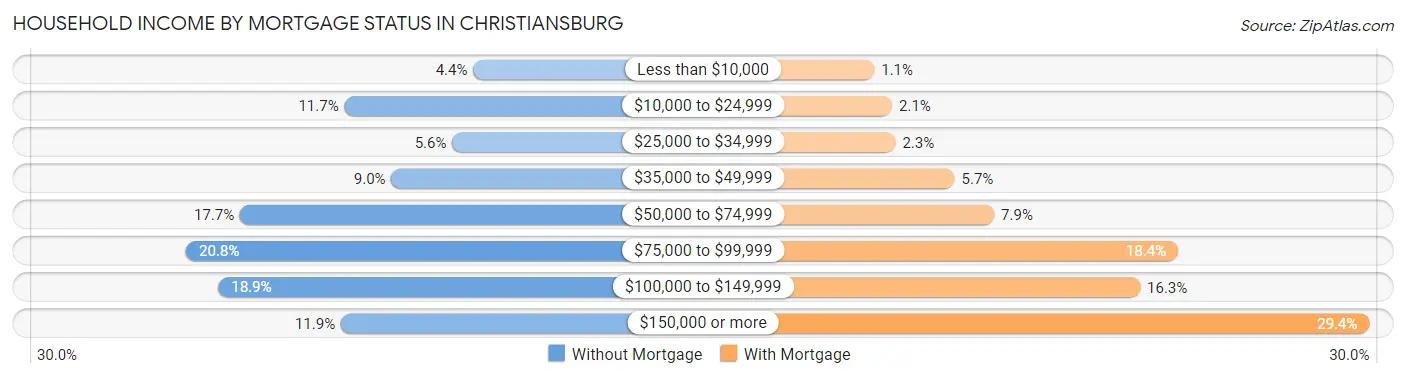
| Household Income | Without Mortgage | With Mortgage |
| Less than $10,000 | 109 (4.4%) | 38 (1.1%) |
| $10,000 to $24,999 | 293 (11.7%) | 74 (2.1%) |
| $25,000 to $34,999 | 139 (5.6%) | 81 (2.3%) |
| $35,000 to $49,999 | 226 (9.0%) | 201 (5.7%) |
| $50,000 to $74,999 | 442 (17.7%) | 281 (7.9%) |
| $75,000 to $99,999 | 519 (20.8%) | 654 (18.4%) |
| $100,000 to $149,999 | 473 (18.9%) | 577 (16.3%) |
| $150,000 or more | 298 (11.9%) | 1,042 (29.4%) |
| Total | 2,499 (100.0%) | 3,549 (100.0%) |
Property Value to Household Income Ratio in Christiansburg
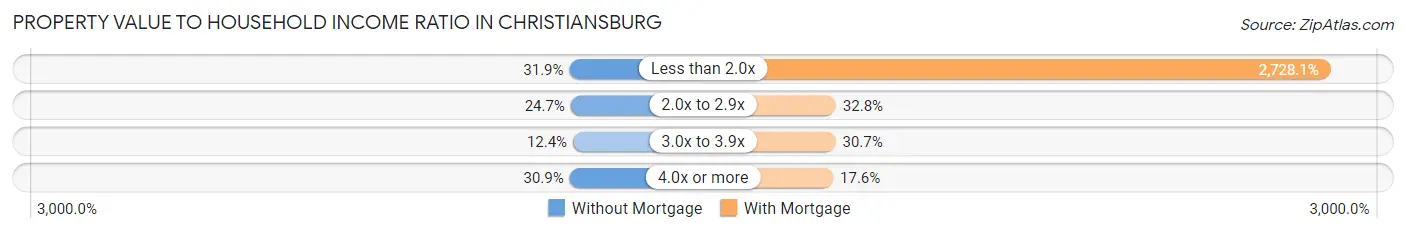
| Value-to-Income Ratio | Without Mortgage | With Mortgage |
| Less than 2.0x | 798 (31.9%) | 96,819 (2,728.1%) |
| 2.0x to 2.9x | 618 (24.7%) | 1,163 (32.8%) |
| 3.0x to 3.9x | 310 (12.4%) | 1,091 (30.7%) |
| 4.0x or more | 773 (30.9%) | 623 (17.5%) |
| Total | 2,499 (100.0%) | 3,549 (100.0%) |
Real Estate Taxes by Mortgage Status in Christiansburg
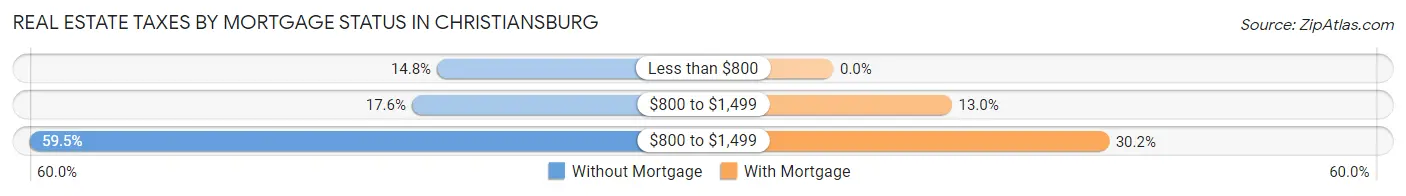
| Property Taxes | Without Mortgage | With Mortgage |
| Less than $800 | 370 (14.8%) | 0 (0.0%) |
| $800 to $1,499 | 439 (17.6%) | 461 (13.0%) |
| $800 to $1,499 | 1,487 (59.5%) | 1,072 (30.2%) |
| Total | 2,499 (100.0%) | 3,549 (100.0%) |
Health & Disability in Christiansburg
Health Insurance Coverage by Age in Christiansburg
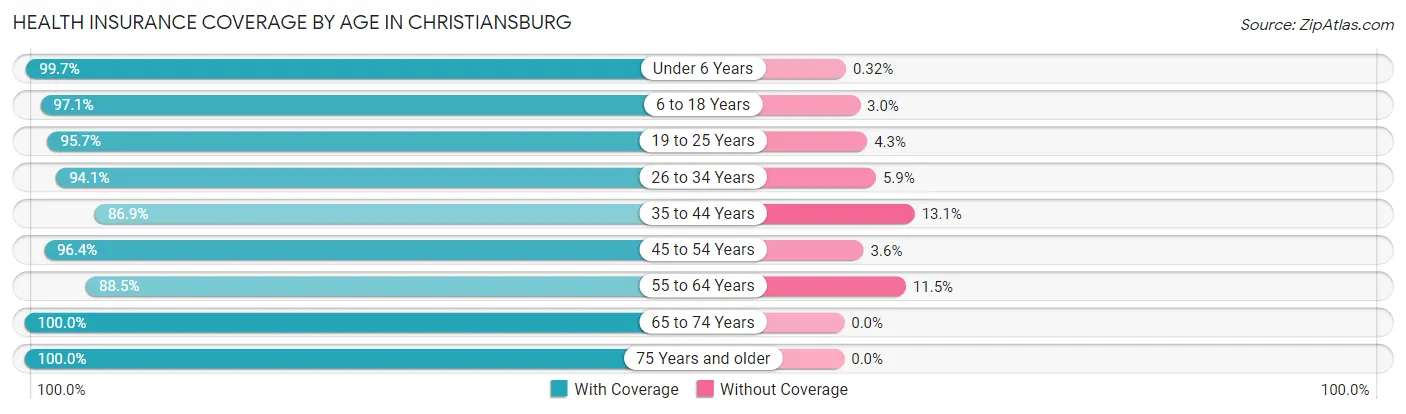
| Age Bracket | With Coverage | Without Coverage |
| Under 6 Years | 1,254 (99.7%) | 4 (0.3%) |
| 6 to 18 Years | 3,454 (97.1%) | 105 (2.9%) |
| 19 to 25 Years | 1,743 (95.7%) | 78 (4.3%) |
| 26 to 34 Years | 3,168 (94.1%) | 199 (5.9%) |
| 35 to 44 Years | 2,745 (86.9%) | 415 (13.1%) |
| 45 to 54 Years | 3,122 (96.4%) | 117 (3.6%) |
| 55 to 64 Years | 2,150 (88.5%) | 279 (11.5%) |
| 65 to 74 Years | 2,428 (100.0%) | 0 (0.0%) |
| 75 Years and older | 1,487 (100.0%) | 0 (0.0%) |
| Total | 21,551 (94.7%) | 1,197 (5.3%) |
Health Insurance Coverage by Citizenship Status in Christiansburg
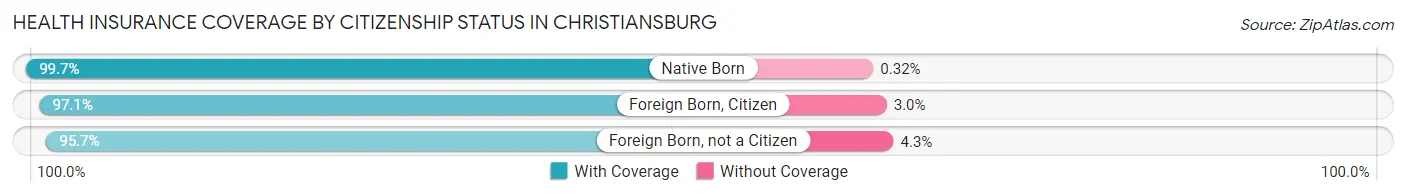
| Citizenship Status | With Coverage | Without Coverage |
| Native Born | 1,254 (99.7%) | 4 (0.3%) |
| Foreign Born, Citizen | 3,454 (97.1%) | 105 (2.9%) |
| Foreign Born, not a Citizen | 1,743 (95.7%) | 78 (4.3%) |
Health Insurance Coverage by Household Income in Christiansburg
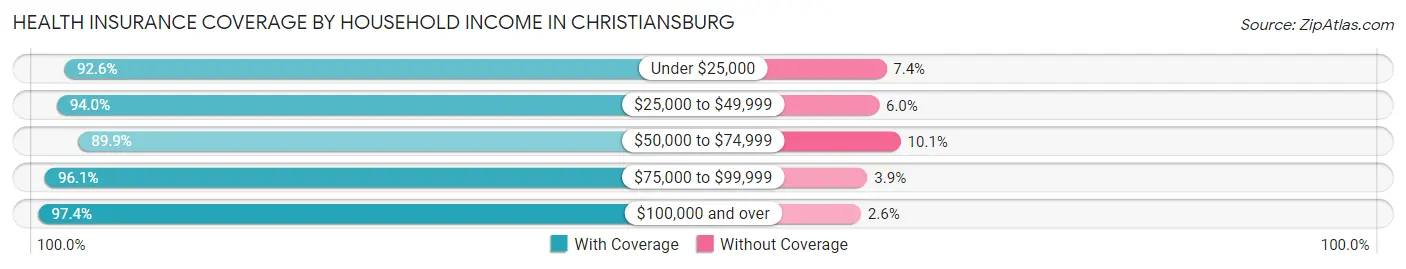
| Household Income | With Coverage | Without Coverage |
| Under $25,000 | 2,298 (92.6%) | 184 (7.4%) |
| $25,000 to $49,999 | 3,066 (94.0%) | 197 (6.0%) |
| $50,000 to $74,999 | 3,981 (89.9%) | 447 (10.1%) |
| $75,000 to $99,999 | 3,112 (96.1%) | 125 (3.9%) |
| $100,000 and over | 8,988 (97.4%) | 244 (2.6%) |
Public vs Private Health Insurance Coverage by Age in Christiansburg
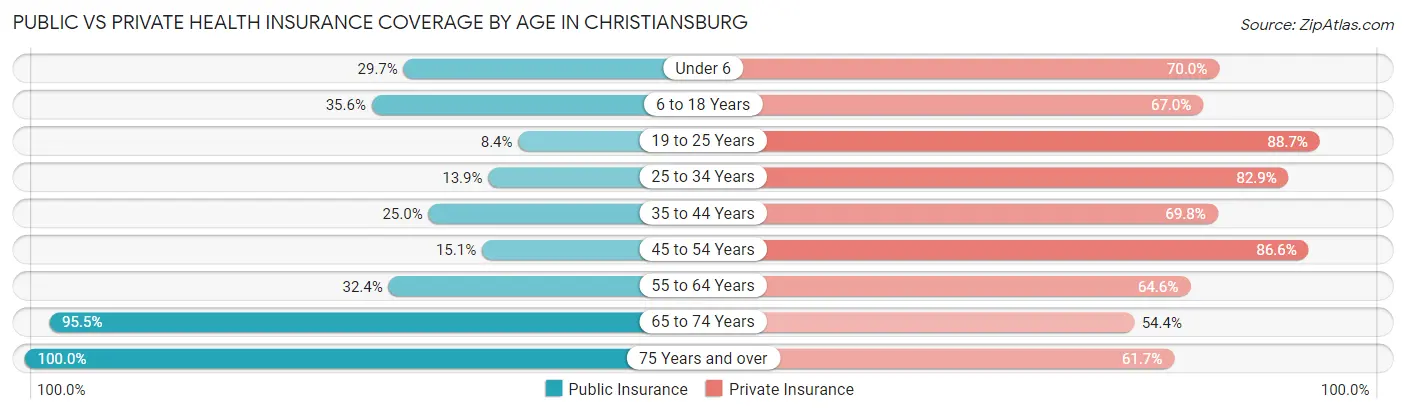
| Age Bracket | Public Insurance | Private Insurance |
| Under 6 | 373 (29.6%) | 881 (70.0%) |
| 6 to 18 Years | 1,266 (35.6%) | 2,386 (67.0%) |
| 19 to 25 Years | 152 (8.4%) | 1,615 (88.7%) |
| 25 to 34 Years | 469 (13.9%) | 2,792 (82.9%) |
| 35 to 44 Years | 791 (25.0%) | 2,204 (69.8%) |
| 45 to 54 Years | 489 (15.1%) | 2,806 (86.6%) |
| 55 to 64 Years | 788 (32.4%) | 1,570 (64.6%) |
| 65 to 74 Years | 2,318 (95.5%) | 1,320 (54.4%) |
| 75 Years and over | 1,487 (100.0%) | 917 (61.7%) |
| Total | 8,133 (35.7%) | 16,491 (72.5%) |
Disability Status by Sex by Age in Christiansburg
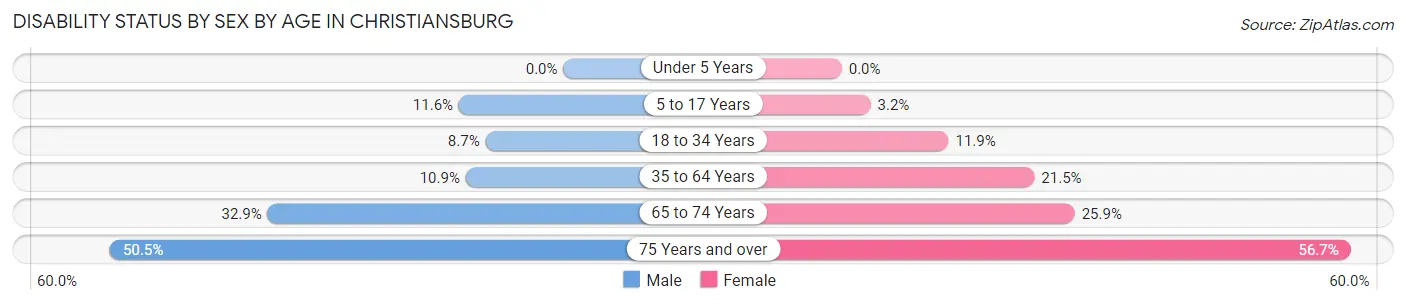
| Age Bracket | Male | Female |
| Under 5 Years | 0 (0.0%) | 0 (0.0%) |
| 5 to 17 Years | 204 (11.6%) | 58 (3.2%) |
| 18 to 34 Years | 228 (8.7%) | 324 (11.9%) |
| 35 to 64 Years | 491 (10.9%) | 925 (21.4%) |
| 65 to 74 Years | 335 (32.9%) | 366 (25.9%) |
| 75 Years and over | 364 (50.5%) | 434 (56.7%) |
Disability Class by Sex by Age in Christiansburg
Disability Class: Hearing Difficulty
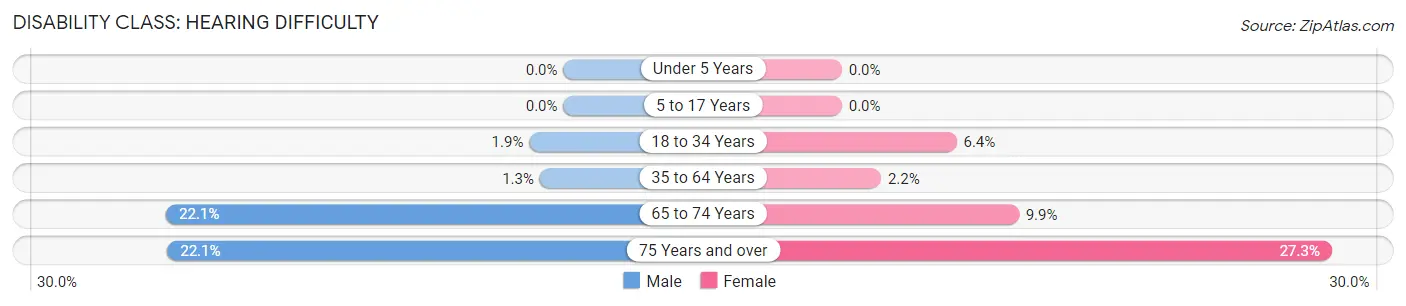
| Age Bracket | Male | Female |
| Under 5 Years | 0 (0.0%) | 0 (0.0%) |
| 5 to 17 Years | 0 (0.0%) | 0 (0.0%) |
| 18 to 34 Years | 50 (1.9%) | 174 (6.4%) |
| 35 to 64 Years | 59 (1.3%) | 94 (2.2%) |
| 65 to 74 Years | 225 (22.1%) | 139 (9.9%) |
| 75 Years and over | 159 (22.1%) | 209 (27.3%) |
Disability Class: Vision Difficulty
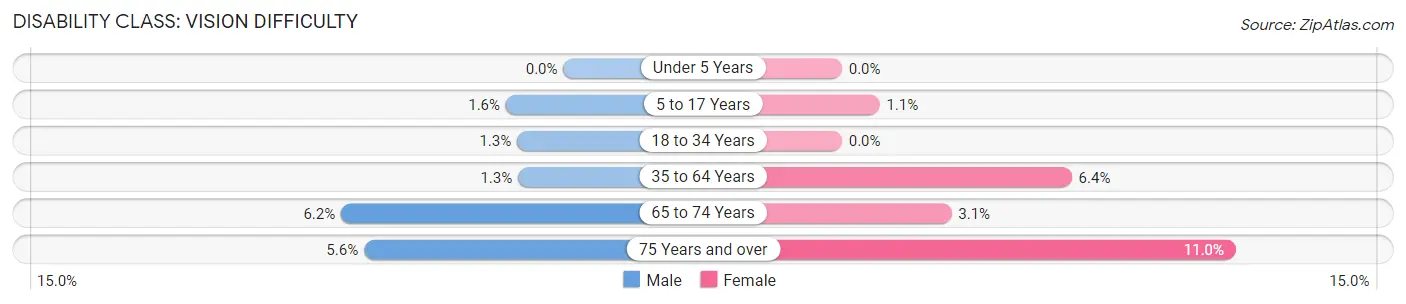
| Age Bracket | Male | Female |
| Under 5 Years | 0 (0.0%) | 0 (0.0%) |
| 5 to 17 Years | 28 (1.6%) | 19 (1.1%) |
| 18 to 34 Years | 34 (1.3%) | 0 (0.0%) |
| 35 to 64 Years | 57 (1.3%) | 276 (6.4%) |
| 65 to 74 Years | 63 (6.2%) | 43 (3.0%) |
| 75 Years and over | 40 (5.6%) | 84 (11.0%) |
Disability Class: Cognitive Difficulty
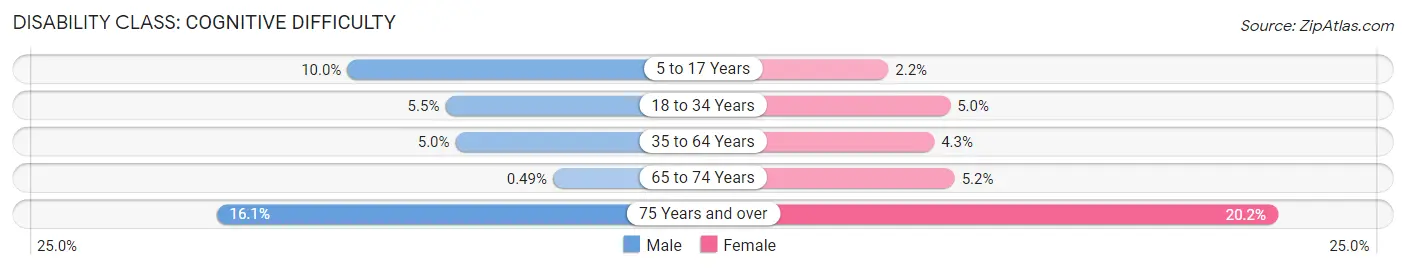
| Age Bracket | Male | Female |
| 5 to 17 Years | 176 (10.0%) | 39 (2.2%) |
| 18 to 34 Years | 144 (5.5%) | 137 (5.0%) |
| 35 to 64 Years | 226 (5.0%) | 185 (4.3%) |
| 65 to 74 Years | 5 (0.5%) | 74 (5.2%) |
| 75 Years and over | 116 (16.1%) | 155 (20.2%) |
Disability Class: Ambulatory Difficulty
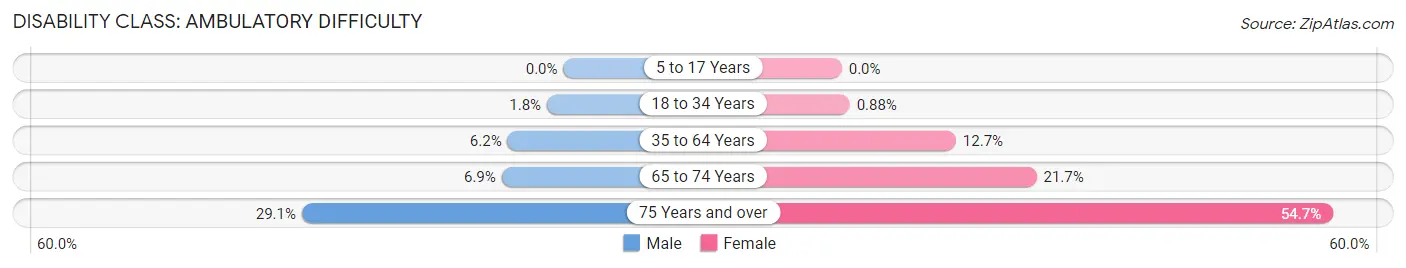
| Age Bracket | Male | Female |
| 5 to 17 Years | 0 (0.0%) | 0 (0.0%) |
| 18 to 34 Years | 48 (1.8%) | 24 (0.9%) |
| 35 to 64 Years | 281 (6.2%) | 548 (12.7%) |
| 65 to 74 Years | 70 (6.9%) | 306 (21.7%) |
| 75 Years and over | 210 (29.1%) | 419 (54.7%) |
Disability Class: Self-Care Difficulty
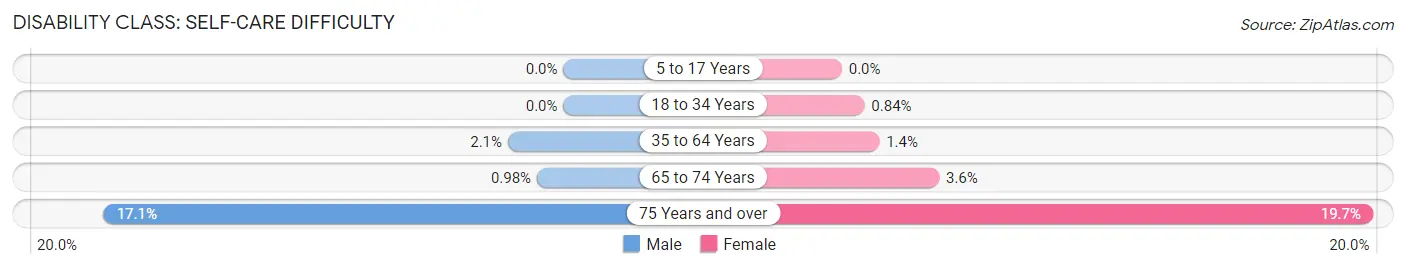
| Age Bracket | Male | Female |
| 5 to 17 Years | 0 (0.0%) | 0 (0.0%) |
| 18 to 34 Years | 0 (0.0%) | 23 (0.8%) |
| 35 to 64 Years | 93 (2.1%) | 60 (1.4%) |
| 65 to 74 Years | 10 (1.0%) | 51 (3.6%) |
| 75 Years and over | 123 (17.1%) | 151 (19.7%) |
Technology Access in Christiansburg
Computing Device Access in Christiansburg
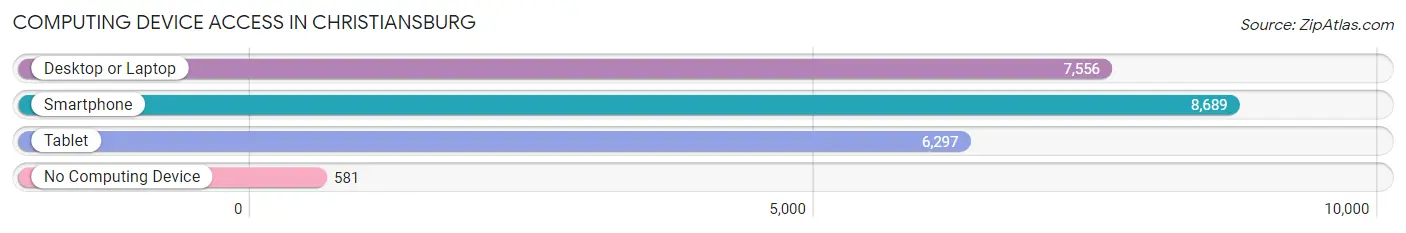
| Device Type | # Households | % Households |
| Desktop or Laptop | 7,556 | 78.0% |
| Smartphone | 8,689 | 89.7% |
| Tablet | 6,297 | 65.0% |
| No Computing Device | 581 | 6.0% |
| Total | 9,686 | 100.0% |
Internet Access in Christiansburg
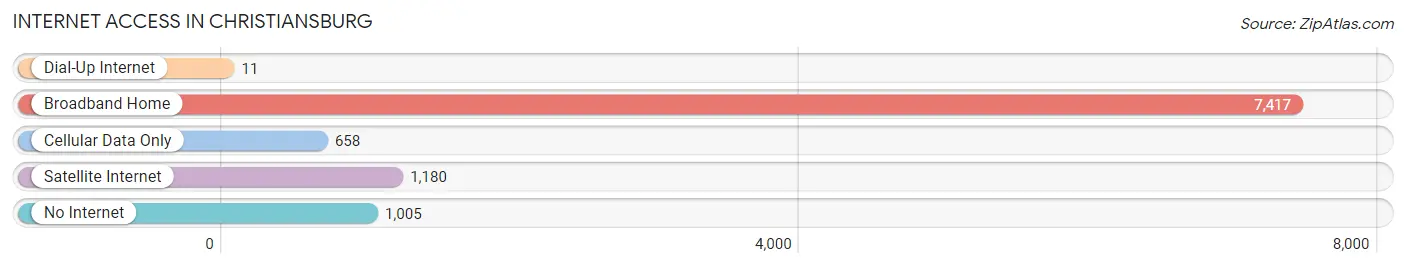
| Internet Type | # Households | % Households |
| Dial-Up Internet | 11 | 0.1% |
| Broadband Home | 7,417 | 76.6% |
| Cellular Data Only | 658 | 6.8% |
| Satellite Internet | 1,180 | 12.2% |
| No Internet | 1,005 | 10.4% |
| Total | 9,686 | 100.0% |
Christiansburg Summary
Christiansburg is a town located in Montgomery County, Virginia, United States. It is part of the Blacksburg-Christiansburg-Radford Metropolitan Statistical Area. The population was 21,041 at the 2010 census. It is the county seat of Montgomery County.
History
The area that is now Christiansburg was first settled in 1771 by Colonel William Preston and his family. The town was named after Colonel William Christian, who was a Revolutionary War hero and a member of the Virginia House of Delegates. The town was officially established in 1792 and incorporated in 1833.
In the 19th century, Christiansburg was a major center for the production of iron and steel. The town was home to several iron furnaces and forges, as well as a large number of foundries and machine shops. The town was also home to several large mills, including the Christiansburg Woolen Mills, which was one of the largest woolen mills in the country.
In the early 20th century, the town began to diversify its economy. The town was home to several large manufacturing plants, including the Christiansburg Manufacturing Company, which produced a variety of products, including furniture, clothing, and textiles. The town was also home to several large retail stores, including the Montgomery Ward department store.
Geography
Christiansburg is located in the New River Valley of southwestern Virginia, at the intersection of Interstate 81 and U.S. Route 460. The town is situated in the Appalachian Mountains, at an elevation of 1,845 feet (562 m). The town is located approximately 25 miles (40 km) southwest of Roanoke, and about 50 miles (80 km) northwest of Blacksburg.
The town is located in a valley, surrounded by the Blue Ridge Mountains to the east and the Allegheny Mountains to the west. The New River flows through the town, and the town is located near several large reservoirs, including Claytor Lake and Smith Mountain Lake.
Economy
Christiansburg is home to several large employers, including Volvo Trucks North America, which has a large manufacturing plant in the town. The town is also home to several large retail stores, including Walmart, Lowe’s, and Target. The town is also home to several large medical facilities, including Carilion New River Valley Medical Center and LewisGale Hospital Montgomery.
The town is also home to several large educational institutions, including Virginia Tech, Radford University, and New River Community College. The town is also home to several large technology companies, including the software company, Oracle.
Demographics
As of the 2010 census, the population of Christiansburg was 21,041. The racial makeup of the town was 87.3% White, 8.2% African American, 0.4% Native American, 1.2% Asian, 0.1% Pacific Islander, 1.2% from other races, and 1.7% from two or more races. Hispanic or Latino of any race were 3.2% of the population.
The median income for a household in the town was $41,945, and the median income for a family was $50,945. The per capita income for the town was $20,945. About 8.2% of families and 11.2% of the population were below the poverty line, including 15.2% of those under age 18 and 8.2% of those age 65 or over.
Common Questions
What is Per Capita Income in Christiansburg?
Per Capita income in Christiansburg is $37,268.
What is the Median Family Income in Christiansburg?
Median Family Income in Christiansburg is $93,539.
What is the Median Household income in Christiansburg?
Median Household Income in Christiansburg is $71,468.
What is Income or Wage Gap in Christiansburg?
Income or Wage Gap in Christiansburg is 41.8%.
Women in Christiansburg earn 58.2 cents for every dollar earned by a man.
What is Inequality or Gini Index in Christiansburg?
Inequality or Gini Index in Christiansburg is 0.42.
What is the Total Population of Christiansburg?
Total Population of Christiansburg is 22,947.
What is the Total Male Population of Christiansburg?
Total Male Population of Christiansburg is 11,296.
What is the Total Female Population of Christiansburg?
Total Female Population of Christiansburg is 11,651.
What is the Ratio of Males per 100 Females in Christiansburg?
There are 96.95 Males per 100 Females in Christiansburg.
What is the Ratio of Females per 100 Males in Christiansburg?
There are 103.14 Females per 100 Males in Christiansburg.
What is the Median Population Age in Christiansburg?
Median Population Age in Christiansburg is 39.1 Years.
What is the Average Family Size in Christiansburg
Average Family Size in Christiansburg is 3.0 People.
What is the Average Household Size in Christiansburg
Average Household Size in Christiansburg is 2.3 People.
How Large is the Labor Force in Christiansburg?
There are 12,182 People in the Labor Forcein in Christiansburg.
What is the Percentage of People in the Labor Force in Christiansburg?
64.8% of People are in the Labor Force in Christiansburg.
What is the Unemployment Rate in Christiansburg?
Unemployment Rate in Christiansburg is 2.4%.