Zip Codes with the Highest Percentage of Households Without a Vehicle in Denison, TX
RELATED REPORTS & OPTIONS
Households without a Cars
Denison
Compare Zip Codes
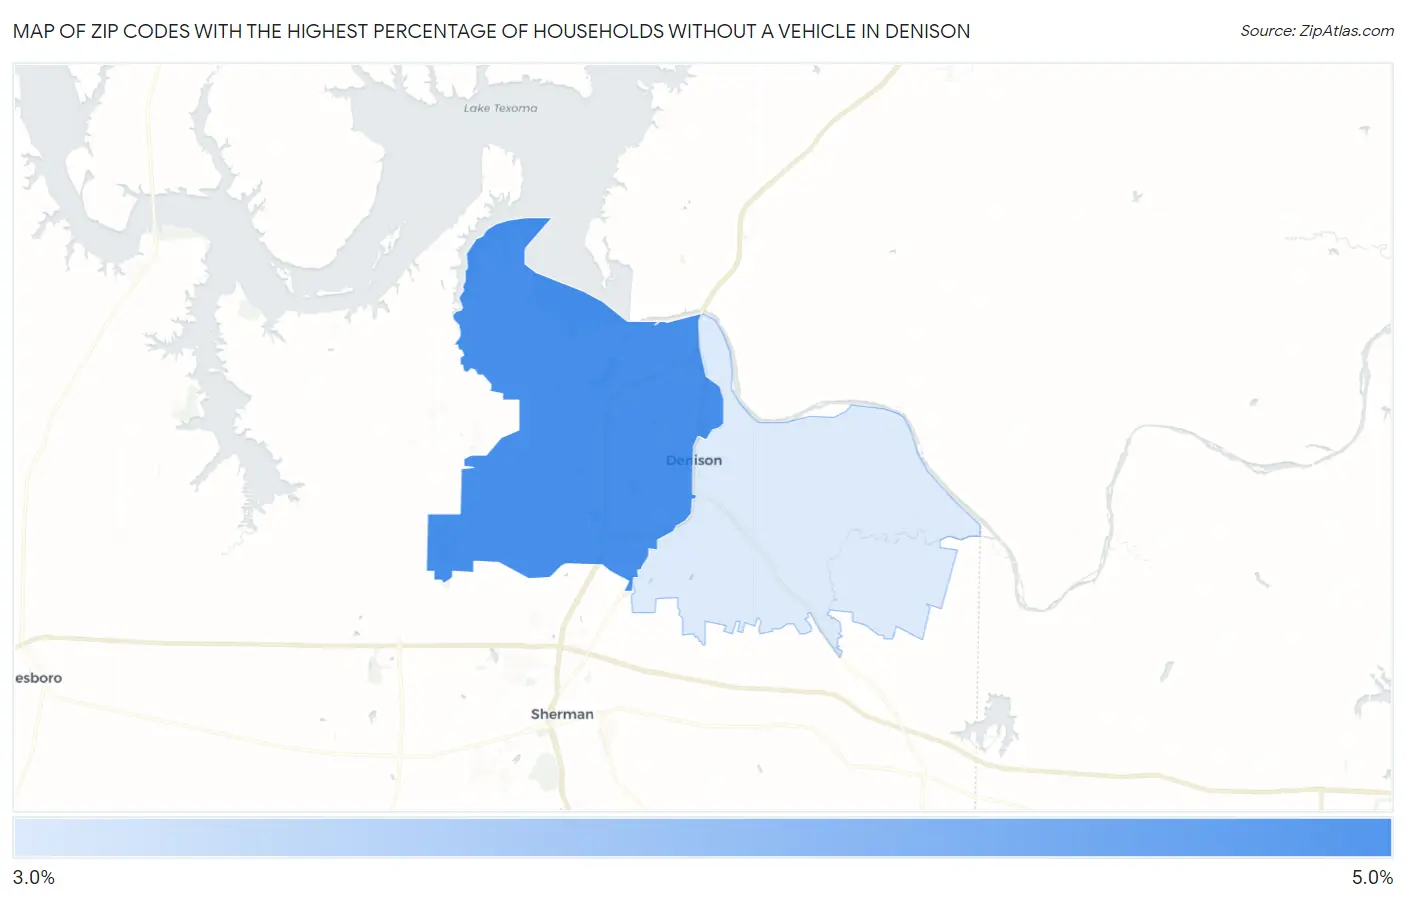
Map of Zip Codes with the Highest Percentage of Households Without a Vehicle in Denison
3.1%
4.8%
Zip Codes with the Highest Percentage of Households Without a Vehicle in Denison, TX
| Zip Code | Housholds Without a Car | vs State | vs National | |
| 1. | 75020 | 4.8% | 5.3%(-0.500)#703 | 8.3%(-3.50)#13,371 |
| 2. | 75021 | 3.1% | 5.3%(-2.20)#1,051 | 8.3%(-5.20)#18,809 |
1
Common Questions
What are the Top Zip Codes with the Highest Percentage of Households Without a Vehicle in Denison, TX?
Top Zip Codes with the Highest Percentage of Households Without a Vehicle in Denison, TX are:
What zip code has the Highest Percentage of Households Without a Vehicle in Denison, TX?
75020 has the Highest Percentage of Households Without a Vehicle in Denison, TX with 4.8%.
What is the Percentage of Households Without a Vehicle in Denison, TX?
Percentage of Households Without a Vehicle in Denison is 5.1%.
What is the Percentage of Households Without a Vehicle in Texas?
Percentage of Households Without a Vehicle in Texas is 5.3%.
What is the Percentage of Households Without a Vehicle in the United States?
Percentage of Households Without a Vehicle in the United States is 8.3%.