Zip Codes with the Highest Percentage of Population Employed in Office & Administration in Stephenville, TX
RELATED REPORTS & OPTIONS
Office & Administration
Stephenville
Compare Zip Codes
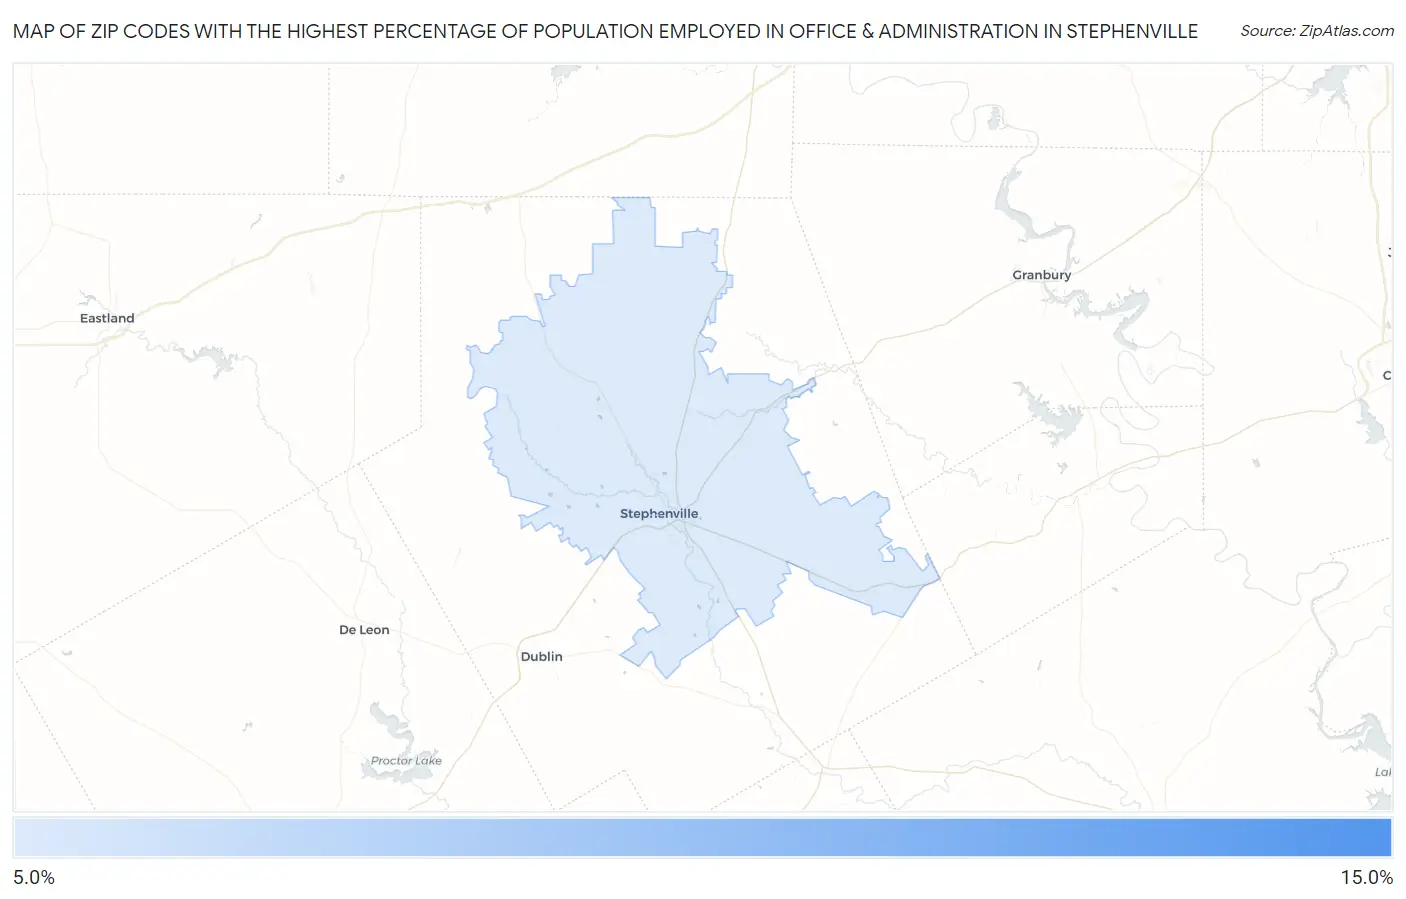
Map of Zip Codes with the Highest Percentage of Population Employed in Office & Administration in Stephenville
10.8%
12.5%
Zip Codes with the Highest Percentage of Population Employed in Office & Administration in Stephenville, TX
| Zip Code | % Employed | vs State | vs National | |
| 1. | 76402 | 12.5% | 11.0%(+1.57)#578 | 10.9%(+1.69)#9,167 |
| 2. | 76401 | 10.8% | 11.0%(-0.197)#878 | 10.9%(-0.082)#14,581 |
1
Common Questions
What are the Top Zip Codes with the Highest Percentage of Population Employed in Office & Administration in Stephenville, TX?
Top Zip Codes with the Highest Percentage of Population Employed in Office & Administration in Stephenville, TX are:
What zip code has the Highest Percentage of Population Employed in Office & Administration in Stephenville, TX?
76402 has the Highest Percentage of Population Employed in Office & Administration in Stephenville, TX with 12.5%.
What is the Percentage of Population Employed in Office & Administration in Stephenville, TX?
Percentage of Population Employed in Office & Administration in Stephenville is 10.0%.
What is the Percentage of Population Employed in Office & Administration in Texas?
Percentage of Population Employed in Office & Administration in Texas is 11.0%.
What is the Percentage of Population Employed in Office & Administration in the United States?
Percentage of Population Employed in Office & Administration in the United States is 10.9%.