Zip Codes with the Highest Percentage of Population Employed in Office & Administration in Beeville, TX
RELATED REPORTS & OPTIONS
Office & Administration
Beeville
Compare Zip Codes
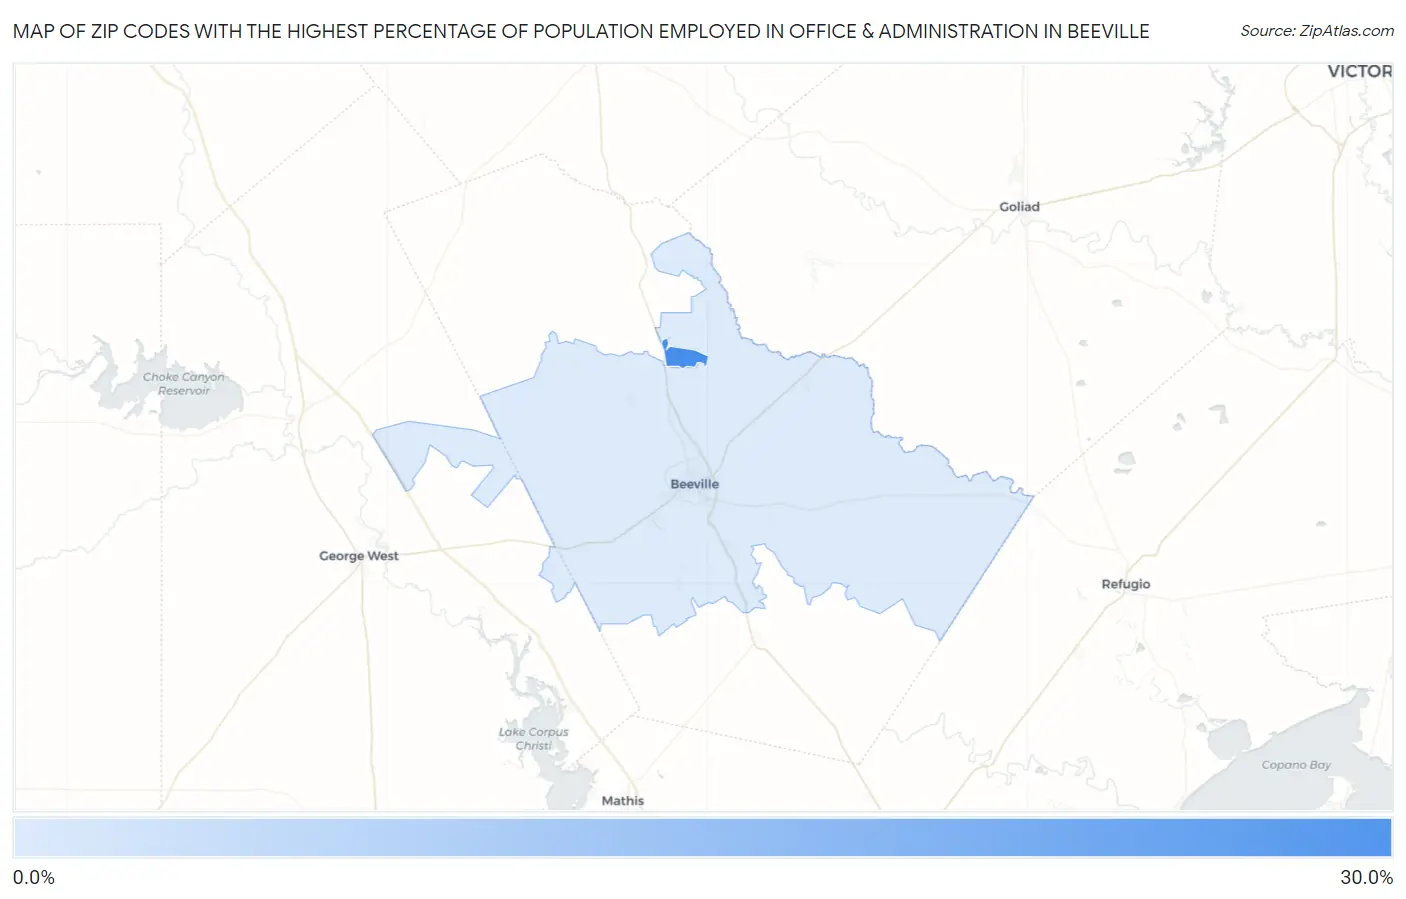
Map of Zip Codes with the Highest Percentage of Population Employed in Office & Administration in Beeville
7.7%
29.3%
Zip Codes with the Highest Percentage of Population Employed in Office & Administration in Beeville, TX
| Zip Code | % Employed | vs State | vs National | |
| 1. | 78104 | 29.3% | 11.0%(+18.3)#33 | 10.9%(+18.4)#598 |
| 2. | 78102 | 7.7% | 11.0%(-3.24)#1,411 | 10.9%(-3.12)#23,630 |
1
Common Questions
What are the Top Zip Codes with the Highest Percentage of Population Employed in Office & Administration in Beeville, TX?
Top Zip Codes with the Highest Percentage of Population Employed in Office & Administration in Beeville, TX are:
What zip code has the Highest Percentage of Population Employed in Office & Administration in Beeville, TX?
78104 has the Highest Percentage of Population Employed in Office & Administration in Beeville, TX with 29.3%.
What is the Percentage of Population Employed in Office & Administration in Beeville, TX?
Percentage of Population Employed in Office & Administration in Beeville is 9.5%.
What is the Percentage of Population Employed in Office & Administration in Texas?
Percentage of Population Employed in Office & Administration in Texas is 11.0%.
What is the Percentage of Population Employed in Office & Administration in the United States?
Percentage of Population Employed in Office & Administration in the United States is 10.9%.