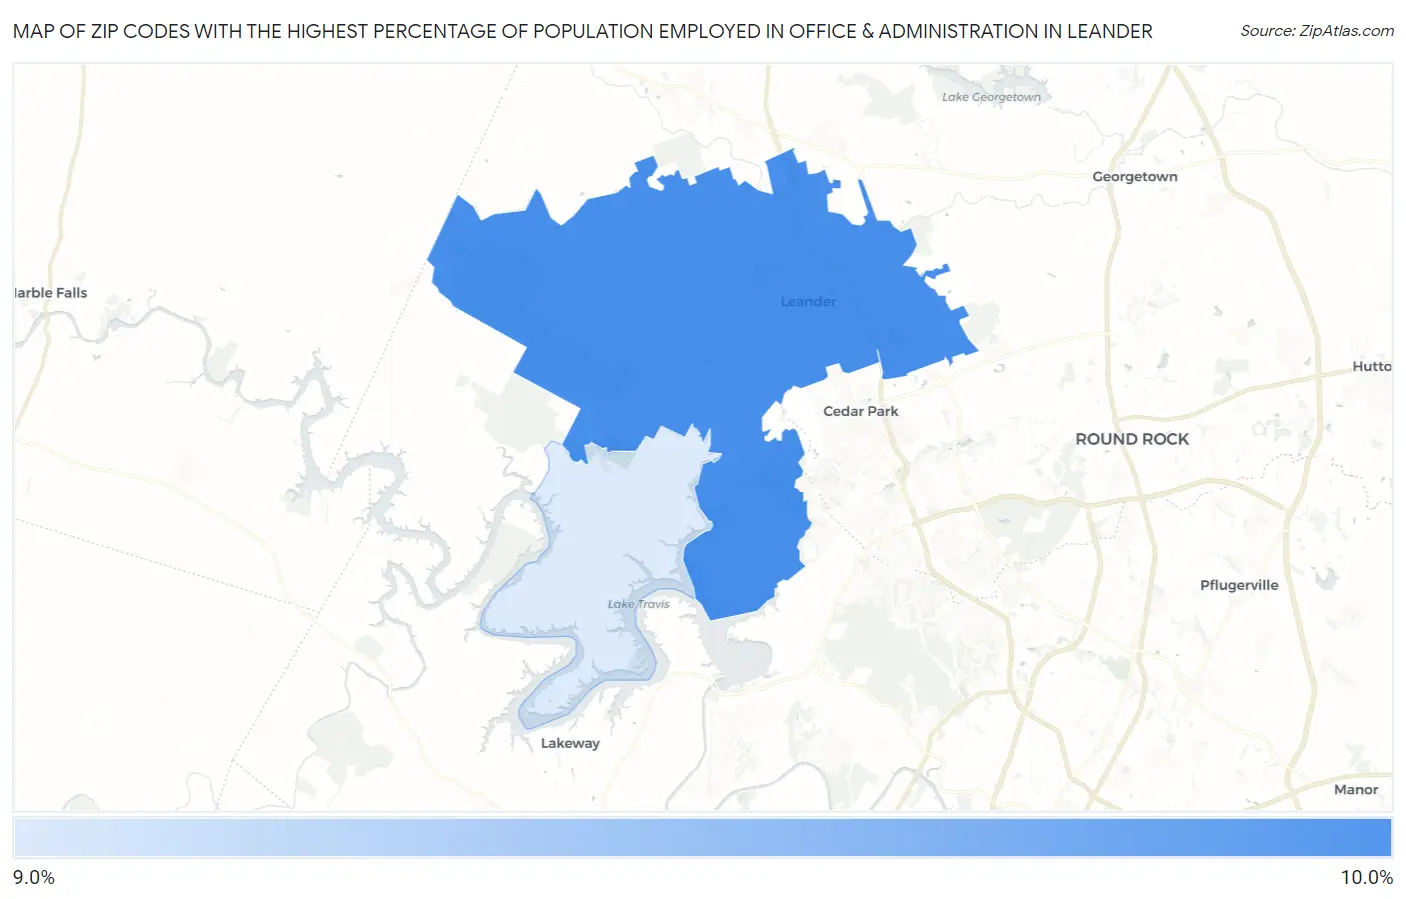
Zip Codes with the Highest Percentage of Population Employed in Office & Administration in Leander, TX
RELATED REPORTS & OPTIONS
Office & Administration
Leander
Compare Zip Codes
Map of Zip Codes with the Highest Percentage of Population Employed in Office & Administration in Leander
9.8%
9.9%
Zip Codes with the Highest Percentage of Population Employed in Office & Administration in Leander, TX
| Zip Code | % Employed | vs State | vs National | |
| 1. | 78641 | 9.9% | 11.0%(-1.09)#1,067 | 10.9%(-0.976)#17,523 |
| 2. | 78645 | 9.8% | 11.0%(-1.21)#1,094 | 10.9%(-1.10)#17,881 |
1
Common Questions
What are the Top Zip Codes with the Highest Percentage of Population Employed in Office & Administration in Leander, TX?
Top Zip Codes with the Highest Percentage of Population Employed in Office & Administration in Leander, TX are:
What zip code has the Highest Percentage of Population Employed in Office & Administration in Leander, TX?
78641 has the Highest Percentage of Population Employed in Office & Administration in Leander, TX with 9.9%.
What is the Percentage of Population Employed in Office & Administration in Leander, TX?
Percentage of Population Employed in Office & Administration in Leander is 9.5%.
What is the Percentage of Population Employed in Office & Administration in Texas?
Percentage of Population Employed in Office & Administration in Texas is 11.0%.
What is the Percentage of Population Employed in Office & Administration in the United States?
Percentage of Population Employed in Office & Administration in the United States is 10.9%.