Zip Codes with the Highest Percentage of Households with Income Above $100,000 in Chattanooga, TN

RELATED REPORTS & OPTIONS

Household Income | $100k+
Population
Families and Households
Female Fertility
Female Fertility (Unmarried)
Race (Community Size)
Race (Percentage)
Ancestry (Community Size)
AfricanAmericanArabArgentineanArmenianAustralianAustrianBelgianBhutaneseBlackfeetBrazilianBritishBurmeseCajunCanadianCelticCentral AmericanCherokeeChileanChippewaChoctawColombianCreekCroatianCubanCzechCzechoslovakianDanishDominicanDutchDutch West IndianEastern EuropeanEgyptianEnglishEthiopianEuropeanFilipinoFinnishFrenchFrench American IndianFrench CanadianGermanGreekGuamanian / ChamorroGuatemalanHaitianHonduranHungarianIcelanderIndian (Asian)IranianIrishIsraeliItalianJamaicanJapaneseKoreanLaotianLebaneseLithuanianLuxembourgerMalaysianMalteseMexicanMexican American IndianMoroccanNative HawaiianNew ZealanderNicaraguanNigerianNorthern EuropeanNorwegianPakistaniPalestinianPanamanianPennsylvania GermanPeruvianPolishPortuguesePuerto RicanRomanianRussianSalvadoranSamoanScandinavianScotch-IrishScottishSerbianSiouxSlovakSloveneSouth AfricanSouth AmericanSpaniardSpanishSri LankanSubsaharan AfricanSudaneseSwedishSwissSyrianThaiTurkishUkrainianUruguayanVenezuelanWelshYugoslavian
Ancestry (Percentage)
AfricanAmericanArabArgentineanArmenianAustralianAustrianBelgianBhutaneseBlackfeetBrazilianBritishBurmeseCajunCanadianCelticCentral AmericanCherokeeChileanChippewaChoctawColombianCreekCroatianCubanCzechCzechoslovakianDanishDominicanDutchDutch West IndianEastern EuropeanEgyptianEnglishEthiopianEuropeanFilipinoFinnishFrenchFrench American IndianFrench CanadianGermanGreekGuamanian / ChamorroGuatemalanHaitianHonduranHungarianIcelanderIndian (Asian)IranianIrishIsraeliItalianJamaicanJapaneseKoreanLaotianLebaneseLithuanianLuxembourgerMalaysianMalteseMexicanMexican American IndianMoroccanNative HawaiianNew ZealanderNicaraguanNigerianNorthern EuropeanNorwegianPakistaniPalestinianPanamanianPennsylvania GermanPeruvianPolishPortuguesePuerto RicanRomanianRussianSalvadoranSamoanScandinavianScotch-IrishScottishSerbianSiouxSlovakSloveneSouth AfricanSouth AmericanSpaniardSpanishSri LankanSubsaharan AfricanSudaneseSwedishSwissSyrianThaiTurkishUkrainianUruguayanVenezuelanWelshYugoslavian
Immigrant Origin (Total)
Immigrant Origin (Percentage)
Income
Income (Families)
Income (Households)
Poverty
Poverty (Families)
Unemployment
Employment Occupations
Employment Industries
Employer Class
Commute Time
Commute Means
School Enrollment
Education by Degree Field
Occupancy
Finances
Physical Characteristics
Chattanooga
Compare Zip Codes
Comparison Subject

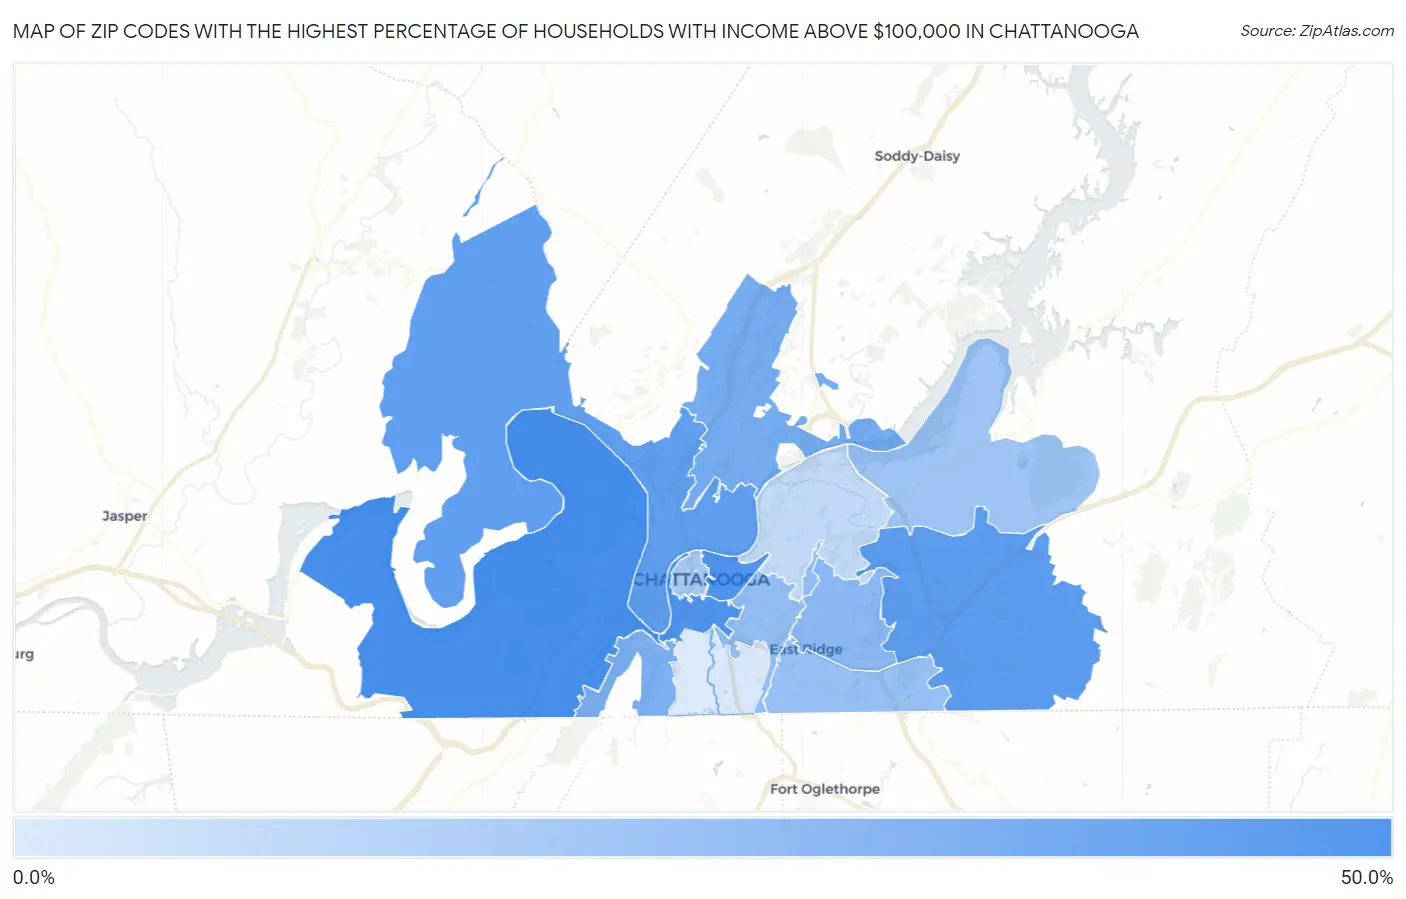
Map of Zip Codes with the Highest Percentage of Households with Income Above $100,000 in Chattanooga

0.0%
50.0%
Zip Codes with the Highest Percentage of Households with Income Above $100,000 in Chattanooga Map

Zip Codes with the Highest Percentage of Households with Income Above $100,000 in Chattanooga, TN

Zip Code Households with Income > $100k vs State vs National
1.3741943.4%29.7%(+13.7)#6037.3%(+6.10)#7,255
2.3740841.7%29.7%(+12.0)#6937.3%(+4.40)#8,040
3.3740341.4%29.7%(+11.7)#7137.3%(+4.10)#8,169
4.3742137.3%29.7%(+7.60)#9837.3%(=0.000)#10,362
5.3740536.2%29.7%(+6.50)#10637.3%(-1.10)#11,030
6.3741530.3%29.7%(+0.600)#16437.3%(-7.00)#15,190
7.3740928.3%29.7%(-1.40)#19937.3%(-9.00)#16,885
8.3741125.0%29.7%(-4.70)#25337.3%(-12.3)#19,748
9.3740422.8%29.7%(-6.90)#31037.3%(-14.5)#21,739
10.3741221.1%29.7%(-8.60)#34337.3%(-16.2)#23,160
11.3741619.6%29.7%(-10.1)#37137.3%(-17.7)#24,355
12.3740217.8%29.7%(-11.9)#42437.3%(-19.5)#25,703
13.3740611.2%29.7%(-18.5)#54837.3%(-26.1)#29,360
14.374076.3%29.7%(-23.4)#59037.3%(-31.0)#30,801
15.374105.2%29.7%(-24.5)#59537.3%(-32.1)#31,021

Common Questions

What are the Top 10 Zip Codes with the Highest Percentage of Households with Income Above $100,000 in Chattanooga, TN?
Top 10 Zip Codes with the Highest Percentage of Households with Income Above $100,000 in Chattanooga, TN are:
#1
43.4%
#2
41.7%
#3
41.4%
#4
37.3%
#5
36.2%
#6
30.3%
#7
28.3%
#8
25.0%
#9
22.8%
#10
21.1%
What zip code has the Highest Percentage of Households with Income Above $100,000 in Chattanooga, TN?
37419 has the Highest Percentage of Households with Income Above $100,000 in Chattanooga, TN with 43.4%.
What is the Percentage of Households with Income Above $100,000 in Chattanooga, TN?
Percentage of Households with Income Above $100,000 in Chattanooga is 27.7%.
What is the Percentage of Households with Income Above $100,000 in Tennessee?
Percentage of Households with Income Above $100,000 in Tennessee is 29.7%.
What is the Percentage of Households with Income Above $100,000 in the United States?
Percentage of Households with Income Above $100,000 in the United States is 37.3%.