Zip Codes with the Highest Percentage of Population Employed in Health Diagnosing & Treating in Nashville, TN
RELATED REPORTS & OPTIONS
Health Diagnosing & Treating
Nashville
Compare Zip Codes
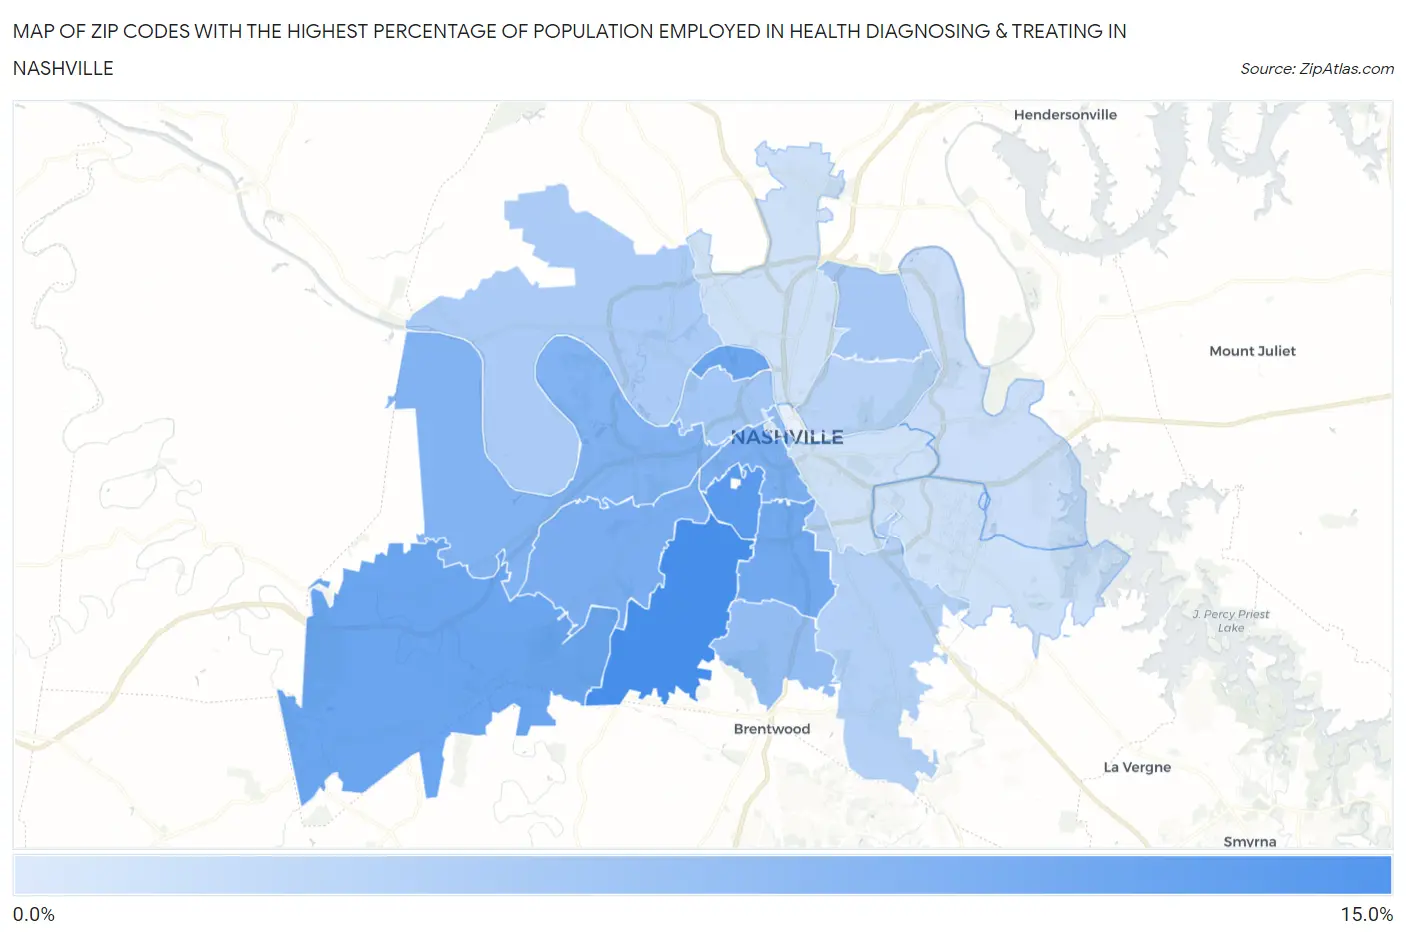
Map of Zip Codes with the Highest Percentage of Population Employed in Health Diagnosing & Treating in Nashville
2.2%
14.0%
Zip Codes with the Highest Percentage of Population Employed in Health Diagnosing & Treating in Nashville, TN
| Zip Code | % Employed | vs State | vs National | |
| 1. | 37215 | 14.0% | 6.9%(+7.16)#23 | 6.2%(+7.77)#1,405 |
| 2. | 37212 | 12.5% | 6.9%(+5.62)#38 | 6.2%(+6.23)#1,973 |
| 3. | 37221 | 11.0% | 6.9%(+4.16)#55 | 6.2%(+4.78)#2,873 |
| 4. | 37228 | 10.8% | 6.9%(+3.94)#63 | 6.2%(+4.56)#3,050 |
| 5. | 37204 | 10.4% | 6.9%(+3.53)#71 | 6.2%(+4.15)#3,415 |
| 6. | 37205 | 9.8% | 6.9%(+2.97)#88 | 6.2%(+3.59)#4,075 |
| 7. | 37203 | 9.8% | 6.9%(+2.90)#90 | 6.2%(+3.51)#4,167 |
| 8. | 37209 | 9.3% | 6.9%(+2.46)#110 | 6.2%(+3.08)#4,813 |
| 9. | 37201 | 7.9% | 6.9%(+1.07)#186 | 6.2%(+1.69)#7,682 |
| 10. | 37220 | 7.8% | 6.9%(+0.907)#196 | 6.2%(+1.52)#8,070 |
| 11. | 37208 | 6.6% | 6.9%(-0.216)#273 | 6.2%(+0.401)#11,501 |
| 12. | 37216 | 6.4% | 6.9%(-0.495)#296 | 6.2%(+0.121)#12,519 |
| 13. | 37218 | 6.1% | 6.9%(-0.781)#321 | 6.2%(-0.164)#13,578 |
| 14. | 37211 | 5.3% | 6.9%(-1.53)#376 | 6.2%(-0.915)#16,434 |
| 15. | 37206 | 4.9% | 6.9%(-1.95)#396 | 6.2%(-1.33)#18,038 |
| 16. | 37214 | 3.5% | 6.9%(-3.33)#479 | 6.2%(-2.72)#22,829 |
| 17. | 37210 | 3.3% | 6.9%(-3.57)#493 | 6.2%(-2.95)#23,503 |
| 18. | 37207 | 3.3% | 6.9%(-3.59)#496 | 6.2%(-2.97)#23,569 |
| 19. | 37217 | 3.2% | 6.9%(-3.64)#501 | 6.2%(-3.02)#23,723 |
| 20. | 37219 | 2.2% | 6.9%(-4.67)#532 | 6.2%(-4.05)#26,127 |
1
Common Questions
What are the Top 10 Zip Codes with the Highest Percentage of Population Employed in Health Diagnosing & Treating in Nashville, TN?
Top 10 Zip Codes with the Highest Percentage of Population Employed in Health Diagnosing & Treating in Nashville, TN are:
What zip code has the Highest Percentage of Population Employed in Health Diagnosing & Treating in Nashville, TN?
37215 has the Highest Percentage of Population Employed in Health Diagnosing & Treating in Nashville, TN with 14.0%.
What is the Percentage of Population Employed in Health Diagnosing & Treating in Nashville, TN?
Percentage of Population Employed in Health Diagnosing & Treating in Nashville is 6.5%.
What is the Percentage of Population Employed in Health Diagnosing & Treating in Tennessee?
Percentage of Population Employed in Health Diagnosing & Treating in Tennessee is 6.9%.
What is the Percentage of Population Employed in Health Diagnosing & Treating in the United States?
Percentage of Population Employed in Health Diagnosing & Treating in the United States is 6.2%.