Zip Codes with the Highest Percentage of Population Employed in Health Diagnosing & Treating in Jackson, TN
RELATED REPORTS & OPTIONS
Health Diagnosing & Treating
Jackson
Compare Zip Codes
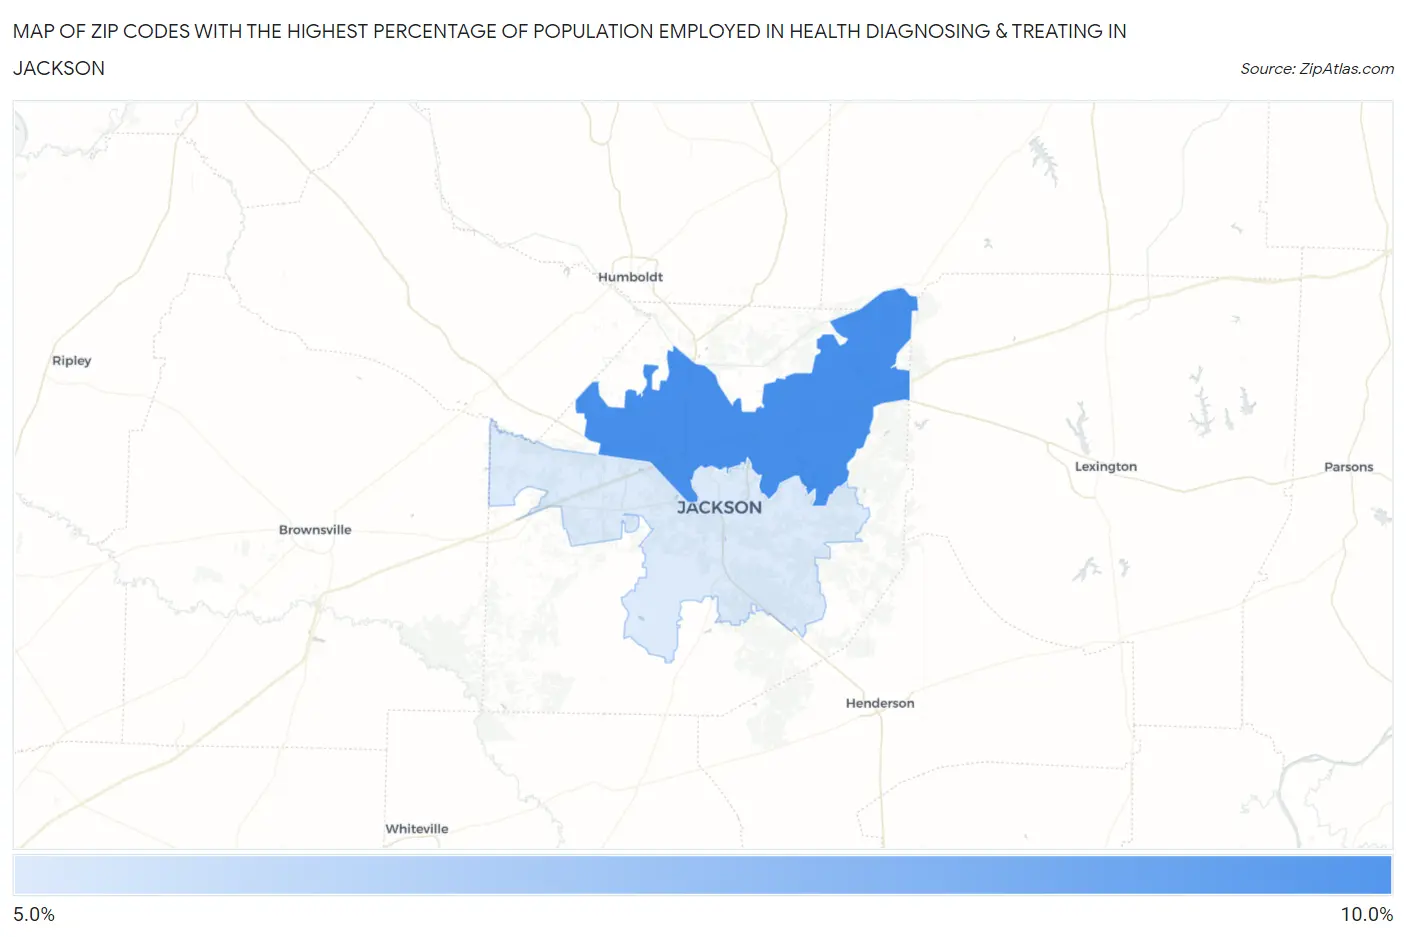
Map of Zip Codes with the Highest Percentage of Population Employed in Health Diagnosing & Treating in Jackson
5.2%
9.4%
Zip Codes with the Highest Percentage of Population Employed in Health Diagnosing & Treating in Jackson, TN
| Zip Code | % Employed | vs State | vs National | |
| 1. | 38305 | 9.4% | 6.9%(+2.51)#108 | 6.2%(+3.12)#4,731 |
| 2. | 38301 | 5.2% | 6.9%(-1.65)#384 | 6.2%(-1.04)#16,902 |
1
Common Questions
What are the Top Zip Codes with the Highest Percentage of Population Employed in Health Diagnosing & Treating in Jackson, TN?
Top Zip Codes with the Highest Percentage of Population Employed in Health Diagnosing & Treating in Jackson, TN are:
What zip code has the Highest Percentage of Population Employed in Health Diagnosing & Treating in Jackson, TN?
38305 has the Highest Percentage of Population Employed in Health Diagnosing & Treating in Jackson, TN with 9.4%.
What is the Percentage of Population Employed in Health Diagnosing & Treating in Jackson, TN?
Percentage of Population Employed in Health Diagnosing & Treating in Jackson is 6.9%.
What is the Percentage of Population Employed in Health Diagnosing & Treating in Tennessee?
Percentage of Population Employed in Health Diagnosing & Treating in Tennessee is 6.9%.
What is the Percentage of Population Employed in Health Diagnosing & Treating in the United States?
Percentage of Population Employed in Health Diagnosing & Treating in the United States is 6.2%.