Zip Codes with the Highest Percentage of Population Employed in Real Estate, Rental & Leasing in Lebanon, TN
RELATED REPORTS & OPTIONS
Real Estate, Rental & Leasing
Lebanon
Compare Zip Codes
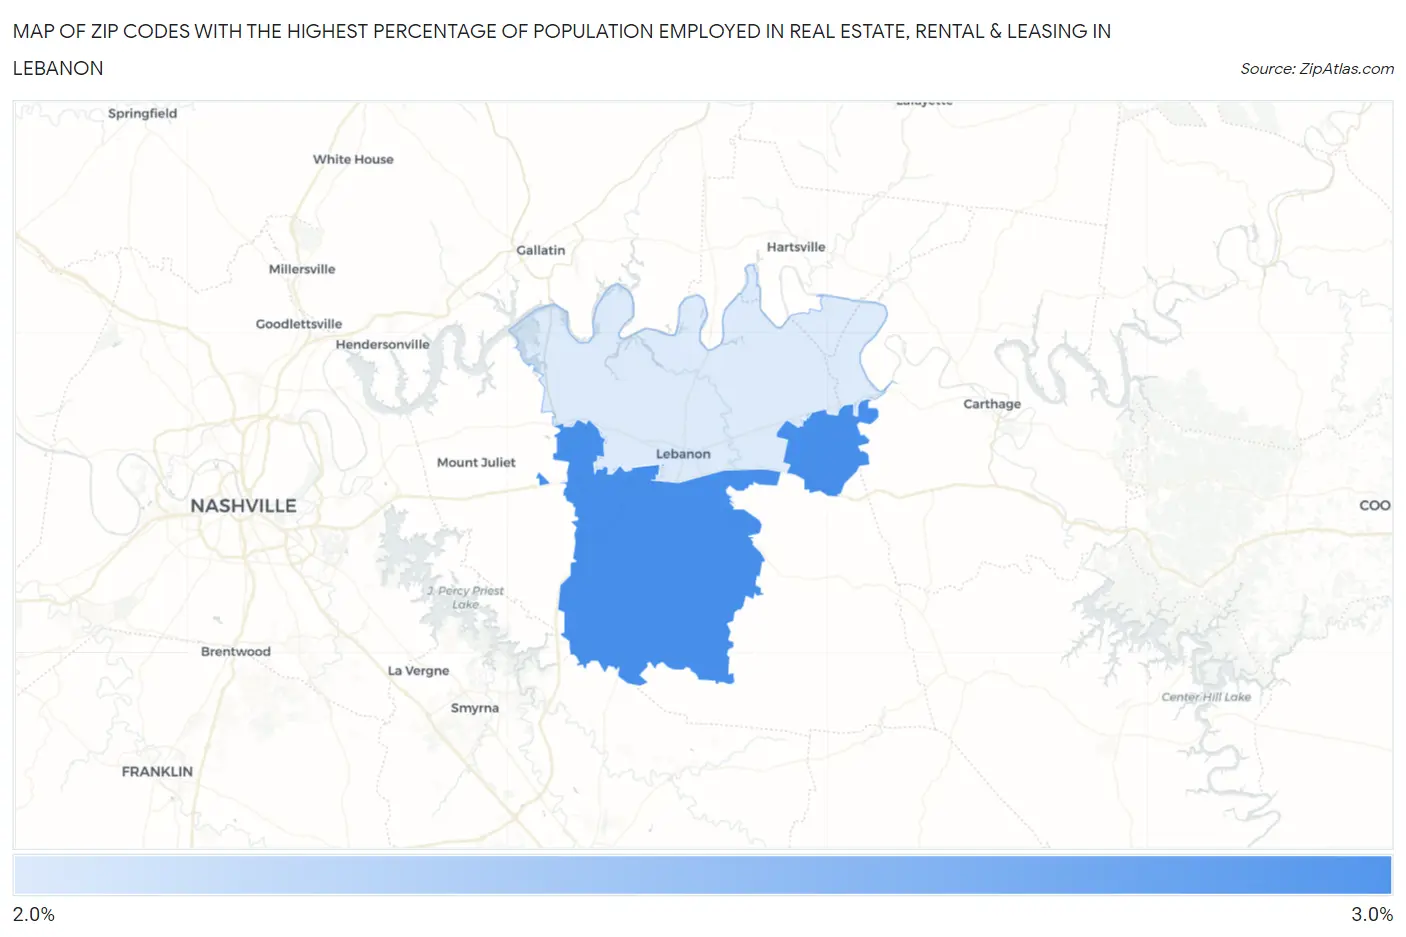
Map of Zip Codes with the Highest Percentage of Population Employed in Real Estate, Rental & Leasing in Lebanon
2.6%
2.7%
Zip Codes with the Highest Percentage of Population Employed in Real Estate, Rental & Leasing in Lebanon, TN
| Zip Code | % Employed | vs State | vs National | |
| 1. | 37090 | 2.7% | 1.7%(+0.957)#77 | 1.9%(+0.800)#4,775 |
| 2. | 37087 | 2.6% | 1.7%(+0.882)#86 | 1.9%(+0.725)#5,047 |
1
Common Questions
What are the Top Zip Codes with the Highest Percentage of Population Employed in Real Estate, Rental & Leasing in Lebanon, TN?
Top Zip Codes with the Highest Percentage of Population Employed in Real Estate, Rental & Leasing in Lebanon, TN are:
What zip code has the Highest Percentage of Population Employed in Real Estate, Rental & Leasing in Lebanon, TN?
37090 has the Highest Percentage of Population Employed in Real Estate, Rental & Leasing in Lebanon, TN with 2.7%.
What is the Percentage of Population Employed in Real Estate, Rental & Leasing in Lebanon, TN?
Percentage of Population Employed in Real Estate, Rental & Leasing in Lebanon is 2.8%.
What is the Percentage of Population Employed in Real Estate, Rental & Leasing in Tennessee?
Percentage of Population Employed in Real Estate, Rental & Leasing in Tennessee is 1.7%.
What is the Percentage of Population Employed in Real Estate, Rental & Leasing in the United States?
Percentage of Population Employed in Real Estate, Rental & Leasing in the United States is 1.9%.