Subsaharan African vs Austrian Family Poverty
COMPARE
Subsaharan African
Austrian
Family Poverty
Family Poverty Comparison
Sub-Saharan Africans
Austrians
10.9%
FAMILY POVERTY
0.2/ 100
METRIC RATING
258th/ 347
METRIC RANK
7.8%
FAMILY POVERTY
98.2/ 100
METRIC RATING
73rd/ 347
METRIC RANK
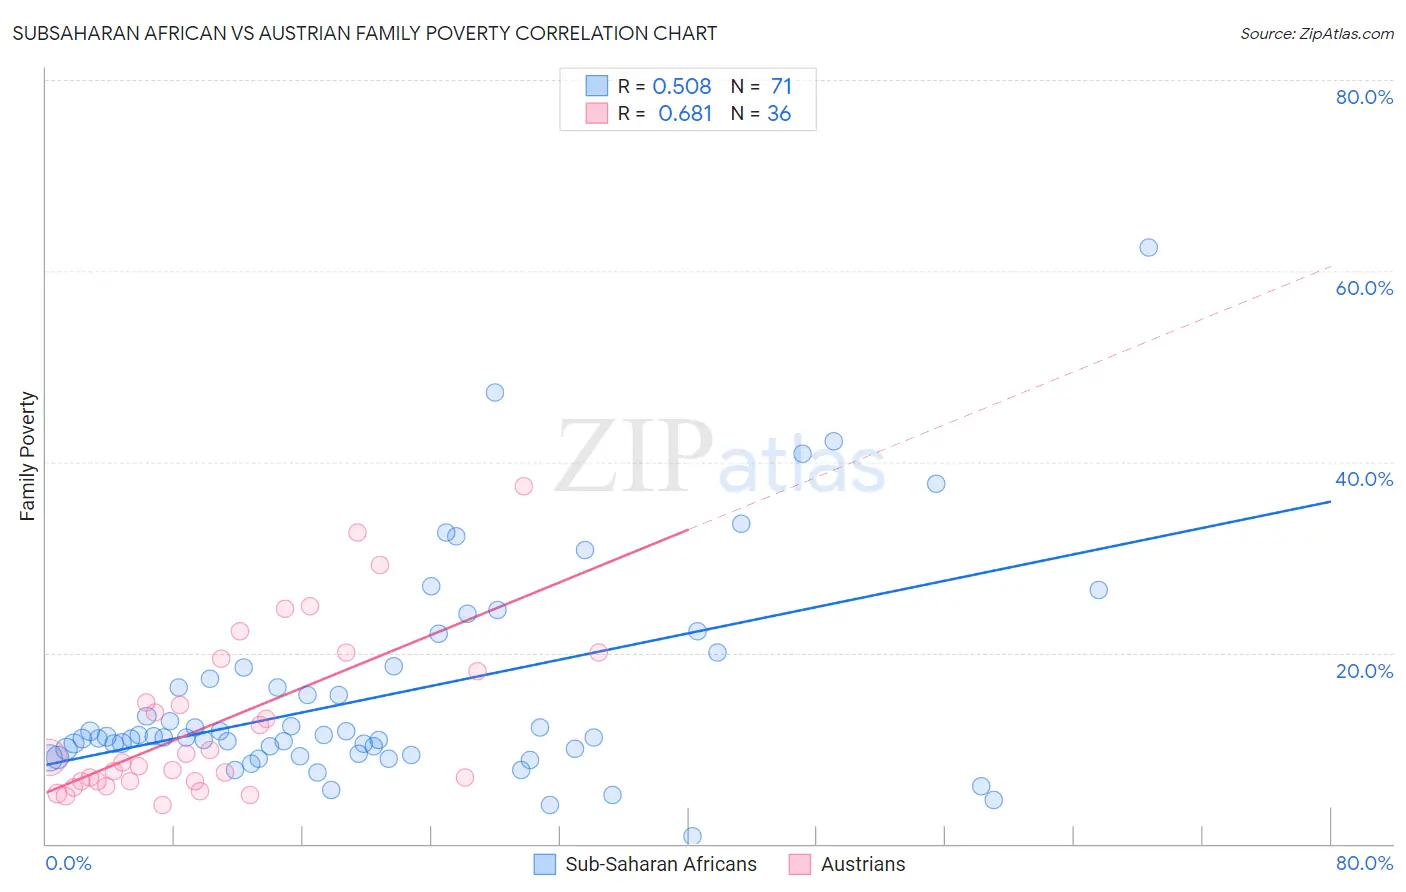
Subsaharan African vs Austrian Family Poverty Correlation Chart
The statistical analysis conducted on geographies consisting of 506,098,570 people shows a substantial positive correlation between the proportion of Sub-Saharan Africans and poverty level among families in the United States with a correlation coefficient (R) of 0.508 and weighted average of 10.9%. Similarly, the statistical analysis conducted on geographies consisting of 450,050,339 people shows a significant positive correlation between the proportion of Austrians and poverty level among families in the United States with a correlation coefficient (R) of 0.681 and weighted average of 7.8%, a difference of 38.6%.
Family Poverty Correlation Summary
| Measurement | Subsaharan African | Austrian |
| Minimum | 0.78% | 4.1% |
| Maximum | 62.5% | 37.5% |
| Range | 61.7% | 33.4% |
| Mean | 15.6% | 12.8% |
| Median | 11.1% | 8.8% |
| Interquartile 25% (IQ1) | 9.4% | 6.6% |
| Interquartile 75% (IQ3) | 18.4% | 18.8% |
| Interquartile Range (IQR) | 9.0% | 12.2% |
| Standard Deviation (Sample) | 11.1% | 8.6% |
| Standard Deviation (Population) | 11.0% | 8.5% |
Similar Demographics by Family Poverty
Demographics Similar to Sub-Saharan Africans by Family Poverty
In terms of family poverty, the demographic groups most similar to Sub-Saharan Africans are Immigrants from Ghana (10.8%, a difference of 0.030%), Mexican American Indian (10.9%, a difference of 0.040%), Chickasaw (10.8%, a difference of 0.070%), Immigrants from Liberia (10.8%, a difference of 0.34%), and Bangladeshi (10.9%, a difference of 0.39%).
| Demographics | Rating | Rank | Family Poverty |
| Iroquois | 0.3 /100 | #251 | Tragic 10.7% |
| Immigrants | Zaire | 0.3 /100 | #252 | Tragic 10.7% |
| Immigrants | Western Africa | 0.3 /100 | #253 | Tragic 10.7% |
| Ecuadorians | 0.2 /100 | #254 | Tragic 10.8% |
| Immigrants | Liberia | 0.2 /100 | #255 | Tragic 10.8% |
| Chickasaw | 0.2 /100 | #256 | Tragic 10.8% |
| Immigrants | Ghana | 0.2 /100 | #257 | Tragic 10.8% |
| Sub-Saharan Africans | 0.2 /100 | #258 | Tragic 10.9% |
| Mexican American Indians | 0.2 /100 | #259 | Tragic 10.9% |
| Bangladeshis | 0.2 /100 | #260 | Tragic 10.9% |
| Shoshone | 0.2 /100 | #261 | Tragic 10.9% |
| Spanish American Indians | 0.2 /100 | #262 | Tragic 10.9% |
| Cape Verdeans | 0.1 /100 | #263 | Tragic 10.9% |
| Trinidadians and Tobagonians | 0.1 /100 | #264 | Tragic 10.9% |
| Immigrants | Trinidad and Tobago | 0.1 /100 | #265 | Tragic 10.9% |
Demographics Similar to Austrians by Family Poverty
In terms of family poverty, the demographic groups most similar to Austrians are Immigrants from Romania (7.8%, a difference of 0.0%), Cambodian (7.8%, a difference of 0.060%), Immigrants from China (7.8%, a difference of 0.070%), Immigrants from Canada (7.8%, a difference of 0.080%), and Immigrants from Belgium (7.8%, a difference of 0.13%).
| Demographics | Rating | Rank | Family Poverty |
| Dutch | 98.3 /100 | #66 | Exceptional 7.8% |
| Northern Europeans | 98.3 /100 | #67 | Exceptional 7.8% |
| Australians | 98.2 /100 | #68 | Exceptional 7.8% |
| Immigrants | Belgium | 98.2 /100 | #69 | Exceptional 7.8% |
| Immigrants | Canada | 98.2 /100 | #70 | Exceptional 7.8% |
| Cambodians | 98.2 /100 | #71 | Exceptional 7.8% |
| Immigrants | Romania | 98.2 /100 | #72 | Exceptional 7.8% |
| Austrians | 98.2 /100 | #73 | Exceptional 7.8% |
| Immigrants | China | 98.1 /100 | #74 | Exceptional 7.8% |
| Immigrants | Croatia | 98.1 /100 | #75 | Exceptional 7.8% |
| Immigrants | Latvia | 98.0 /100 | #76 | Exceptional 7.9% |
| Ukrainians | 98.0 /100 | #77 | Exceptional 7.9% |
| Immigrants | North America | 97.9 /100 | #78 | Exceptional 7.9% |
| Immigrants | Europe | 97.8 /100 | #79 | Exceptional 7.9% |
| English | 97.8 /100 | #80 | Exceptional 7.9% |