White/Caucasian Single Male Poverty
COMPARE
White/Caucasian
Select to Compare
Single Male Poverty
White/Caucasian Single Male Poverty
14.5%
POVERTY | SINGLE MALES
0.0/ 100
METRIC RATING
288th/ 347
METRIC RANK
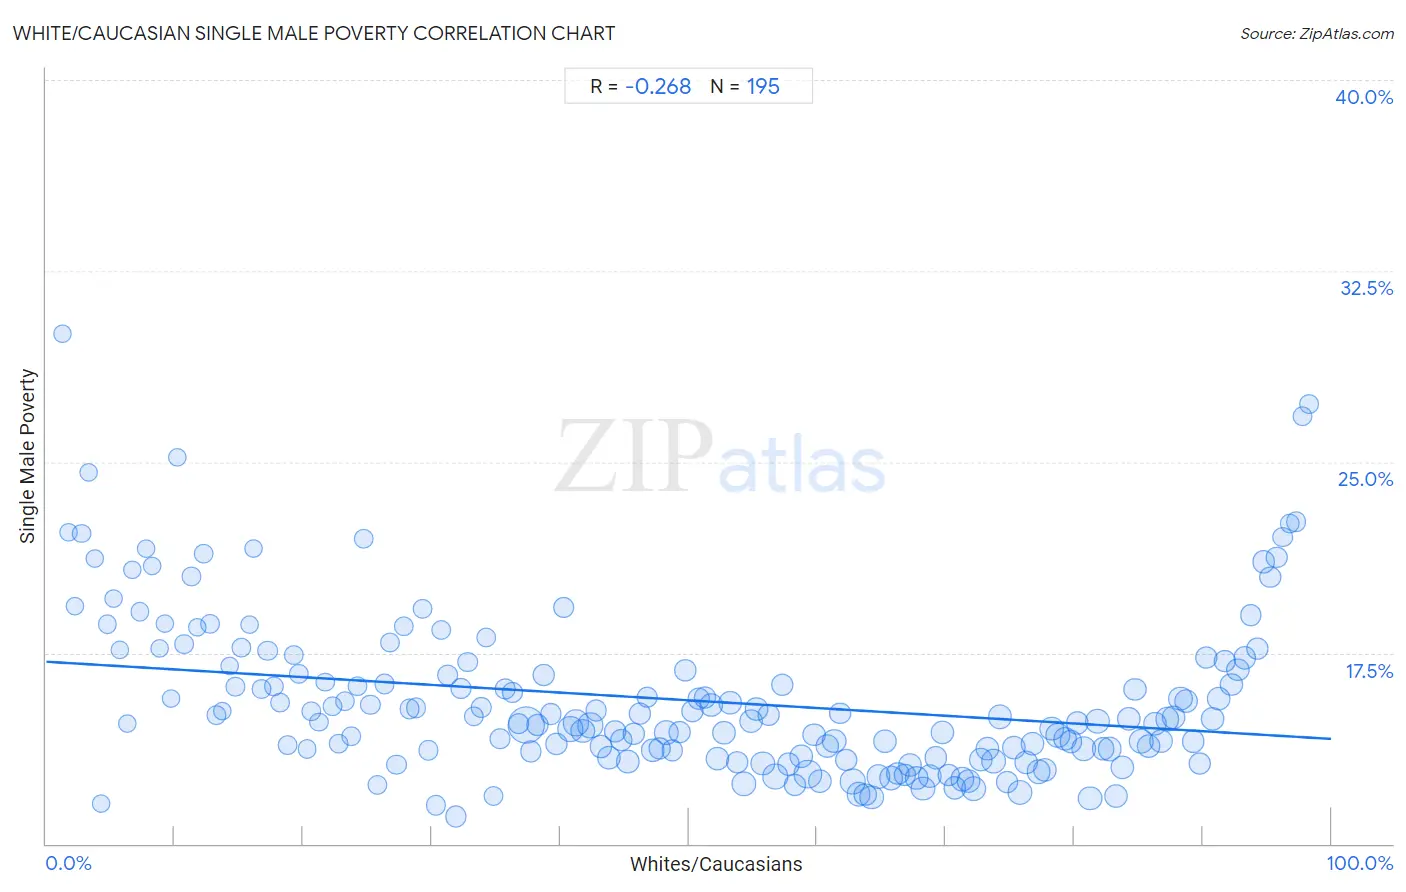
White/Caucasian Single Male Poverty Correlation Chart
The statistical analysis conducted on geographies consisting of 478,066,159 people shows a weak negative correlation between the proportion of Whites/Caucasians and poverty level among single males in the United States with a correlation coefficient (R) of -0.268 and weighted average of 14.5%. On average, for every 1% (one percent) increase in Whites/Caucasians within a typical geography, there is a decrease of 0.030% in poverty level among single males.
It is essential to understand that the correlation between the percentage of Whites/Caucasians and poverty level among single males does not imply a direct cause-and-effect relationship. It remains uncertain whether the presence of Whites/Caucasians influences an upward or downward trend in the level of poverty level among single males within an area, or if Whites/Caucasians simply ended up residing in those areas with higher or lower levels of poverty level among single males due to other factors.
Demographics Similar to Whites/Caucasians by Single Male Poverty
In terms of single male poverty, the demographic groups most similar to Whites/Caucasians are Iroquois (14.5%, a difference of 0.0%), Immigrants from Dominica (14.5%, a difference of 0.090%), Celtic (14.5%, a difference of 0.13%), U.S. Virgin Islander (14.5%, a difference of 0.31%), and French (14.4%, a difference of 0.45%).
| Demographics | Rating | Rank | Single Male Poverty |
| Hispanics or Latinos | 0.0 /100 | #281 | Tragic 14.2% |
| Spanish Americans | 0.0 /100 | #282 | Tragic 14.2% |
| Yaqui | 0.0 /100 | #283 | Tragic 14.2% |
| Immigrants from Bahamas | 0.0 /100 | #284 | Tragic 14.4% |
| French | 0.0 /100 | #285 | Tragic 14.4% |
| Celtics | 0.0 /100 | #286 | Tragic 14.5% |
| Iroquois | 0.0 /100 | #287 | Tragic 14.5% |
| Whites/Caucasians | 0.0 /100 | #288 | Tragic 14.5% |
| Immigrants from Dominica | 0.0 /100 | #289 | Tragic 14.5% |
| U.S. Virgin Islanders | 0.0 /100 | #290 | Tragic 14.5% |
| Bahamians | 0.0 /100 | #291 | Tragic 14.6% |
| Nonimmigrants | 0.0 /100 | #292 | Tragic 14.6% |
| French Canadians | 0.0 /100 | #293 | Tragic 14.6% |
| Ottawa | 0.0 /100 | #294 | Tragic 14.6% |
| Scotch-Irish | 0.0 /100 | #295 | Tragic 14.7% |
White/Caucasian Single Male Poverty Correlation Summary
| Measurement | White/Caucasian Data | Single Male Poverty Data |
| Minimum | 1.3% | 11.1% |
| Maximum | 98.3% | 30.0% |
| Range | 97.0% | 19.0% |
| Mean | 49.8% | 15.6% |
| Median | 49.7% | 14.8% |
| Interquartile 25% (IQ1) | 25.2% | 13.6% |
| Interquartile 75% (IQ3) | 74.2% | 16.8% |
| Interquartile Range (IQR) | 49.0% | 3.2% |
| Standard Deviation (Sample) | 28.2% | 3.2% |
| Standard Deviation (Population) | 28.1% | 3.2% |
Correlation Details
| White/Caucasian Percentile | Sample Size | Single Male Poverty |
[ 1.0% - 1.5% ] 1.26% | 168,622 | 30.0% |
[ 1.5% - 2.0% ] 1.77% | 434,067 | 22.2% |
[ 2.0% - 2.5% ] 2.21% | 301,774 | 19.3% |
[ 2.5% - 3.0% ] 2.76% | 517,105 | 22.2% |
[ 3.0% - 3.5% ] 3.27% | 311,972 | 24.6% |
[ 3.5% - 4.0% ] 3.80% | 443,091 | 21.2% |
[ 4.0% - 4.5% ] 4.24% | 379,563 | 11.6% |
[ 4.5% - 5.0% ] 4.77% | 366,092 | 18.6% |
[ 5.0% - 5.5% ] 5.22% | 391,315 | 19.6% |
[ 5.5% - 6.0% ] 5.75% | 343,723 | 17.6% |
[ 6.0% - 6.5% ] 6.28% | 410,909 | 14.7% |
[ 6.5% - 7.0% ] 6.68% | 414,543 | 20.8% |
[ 7.0% - 7.5% ] 7.30% | 352,818 | 19.1% |
[ 7.5% - 8.0% ] 7.78% | 315,476 | 21.6% |
[ 8.0% - 8.5% ] 8.24% | 566,469 | 20.9% |
[ 8.5% - 9.0% ] 8.81% | 654,090 | 17.7% |
[ 9.0% - 9.5% ] 9.25% | 376,238 | 18.7% |
[ 9.5% - 10.0% ] 9.74% | 463,559 | 15.7% |
[ 10.0% - 10.5% ] 10.22% | 402,883 | 25.2% |
[ 10.5% - 11.0% ] 10.73% | 501,242 | 17.8% |
[ 11.0% - 11.5% ] 11.28% | 703,487 | 20.5% |
[ 11.5% - 12.0% ] 11.77% | 418,180 | 18.5% |
[ 12.0% - 12.5% ] 12.21% | 1,101,743 | 21.4% |
[ 12.5% - 13.0% ] 12.75% | 879,442 | 18.6% |
[ 13.0% - 13.5% ] 13.27% | 780,738 | 15.0% |
[ 13.5% - 14.0% ] 13.69% | 416,109 | 15.2% |
[ 14.0% - 14.5% ] 14.26% | 633,818 | 17.0% |
[ 14.5% - 15.0% ] 14.71% | 449,266 | 16.2% |
[ 15.0% - 15.5% ] 15.17% | 861,510 | 17.7% |
[ 15.5% - 16.0% ] 15.81% | 689,567 | 18.6% |
[ 16.0% - 16.5% ] 16.16% | 475,967 | 21.6% |
[ 16.5% - 17.0% ] 16.75% | 655,710 | 16.1% |
[ 17.0% - 17.5% ] 17.25% | 1,649,237 | 17.6% |
[ 17.5% - 18.0% ] 17.72% | 813,768 | 16.2% |
[ 18.0% - 18.5% ] 18.21% | 887,339 | 15.5% |
[ 18.5% - 19.0% ] 18.74% | 884,376 | 13.9% |
[ 19.0% - 19.5% ] 19.26% | 951,246 | 17.4% |
[ 19.5% - 20.0% ] 19.69% | 873,505 | 16.7% |
[ 20.0% - 20.5% ] 20.30% | 705,964 | 13.7% |
[ 20.5% - 21.0% ] 20.67% | 951,257 | 15.2% |
[ 21.0% - 21.5% ] 21.22% | 692,182 | 14.8% |
[ 21.5% - 22.0% ] 21.70% | 656,785 | 16.3% |
[ 22.0% - 22.5% ] 22.32% | 968,799 | 15.4% |
[ 22.5% - 23.0% ] 22.72% | 1,128,374 | 13.9% |
[ 23.0% - 23.5% ] 23.22% | 1,101,453 | 15.6% |
[ 23.5% - 24.0% ] 23.75% | 983,051 | 14.2% |
[ 24.0% - 24.5% ] 24.24% | 1,057,112 | 16.2% |
[ 24.5% - 25.0% ] 24.75% | 1,036,369 | 22.0% |
[ 25.0% - 25.5% ] 25.23% | 1,339,133 | 15.5% |
[ 25.5% - 26.0% ] 25.75% | 1,120,875 | 12.3% |
[ 26.0% - 26.5% ] 26.33% | 1,546,584 | 16.3% |
[ 26.5% - 27.0% ] 26.75% | 1,008,902 | 17.9% |
[ 27.0% - 27.5% ] 27.26% | 1,430,615 | 13.1% |
[ 27.5% - 28.0% ] 27.82% | 933,107 | 18.6% |
[ 28.0% - 28.5% ] 28.27% | 1,585,352 | 15.3% |
[ 28.5% - 29.0% ] 28.77% | 1,342,999 | 15.3% |
[ 29.0% - 29.5% ] 29.27% | 911,007 | 19.2% |
[ 29.5% - 30.0% ] 29.73% | 1,454,637 | 13.7% |
[ 30.0% - 30.5% ] 30.32% | 1,465,566 | 11.5% |
[ 30.5% - 31.0% ] 30.75% | 1,028,438 | 18.4% |
[ 31.0% - 31.5% ] 31.24% | 1,637,929 | 16.6% |
[ 31.5% - 32.0% ] 31.88% | 2,304,216 | 11.1% |
[ 32.0% - 32.5% ] 32.29% | 2,188,610 | 16.1% |
[ 32.5% - 33.0% ] 32.77% | 1,530,531 | 17.1% |
[ 33.0% - 33.5% ] 33.26% | 865,156 | 15.0% |
[ 33.5% - 34.0% ] 33.82% | 1,797,522 | 15.4% |
[ 34.0% - 34.5% ] 34.28% | 1,020,982 | 18.1% |
[ 34.5% - 35.0% ] 34.79% | 1,343,724 | 11.9% |
[ 35.0% - 35.5% ] 35.27% | 1,777,398 | 14.1% |
[ 35.5% - 36.0% ] 35.73% | 1,603,595 | 16.1% |
[ 36.0% - 36.5% ] 36.25% | 1,869,257 | 15.9% |
[ 36.5% - 37.0% ] 36.75% | 1,938,572 | 14.7% |
[ 37.0% - 37.5% ] 37.37% | 12,611,403 | 14.7% |
[ 37.5% - 38.0% ] 37.71% | 2,353,721 | 13.6% |
[ 38.0% - 38.5% ] 38.25% | 2,699,977 | 14.6% |
[ 38.5% - 39.0% ] 38.72% | 2,672,322 | 16.6% |
[ 39.0% - 39.5% ] 39.28% | 2,276,360 | 15.1% |
[ 39.5% - 40.0% ] 39.72% | 2,419,225 | 13.9% |
[ 40.0% - 40.5% ] 40.23% | 1,892,628 | 19.3% |
[ 40.5% - 41.0% ] 40.78% | 4,684,789 | 14.5% |
[ 41.0% - 41.5% ] 41.21% | 5,533,623 | 14.7% |
[ 41.5% - 42.0% ] 41.77% | 3,905,000 | 14.4% |
[ 42.0% - 42.5% ] 42.33% | 4,684,245 | 14.7% |
[ 42.5% - 43.0% ] 42.76% | 1,992,064 | 15.2% |
[ 43.0% - 43.5% ] 43.19% | 3,104,328 | 13.8% |
[ 43.5% - 44.0% ] 43.79% | 3,257,806 | 13.4% |
[ 44.0% - 44.5% ] 44.24% | 2,497,579 | 14.4% |
[ 44.5% - 45.0% ] 44.74% | 2,599,757 | 14.1% |
[ 45.0% - 45.5% ] 45.27% | 3,059,078 | 13.2% |
[ 45.5% - 46.0% ] 45.71% | 2,586,372 | 14.3% |
[ 46.0% - 46.5% ] 46.21% | 2,810,941 | 15.1% |
[ 46.5% - 47.0% ] 46.76% | 2,204,372 | 15.8% |
[ 47.0% - 47.5% ] 47.21% | 3,157,570 | 13.7% |
[ 47.5% - 48.0% ] 47.75% | 3,114,107 | 13.8% |
[ 48.0% - 48.5% ] 48.24% | 4,216,265 | 14.4% |
[ 48.5% - 49.0% ] 48.73% | 2,098,024 | 13.7% |
[ 49.0% - 49.5% ] 49.29% | 3,181,416 | 14.4% |
[ 49.5% - 50.0% ] 49.73% | 2,206,388 | 16.8% |
[ 50.0% - 50.5% ] 50.25% | 2,783,918 | 15.2% |
[ 50.5% - 51.0% ] 50.75% | 2,731,929 | 15.7% |
[ 51.0% - 51.5% ] 51.23% | 2,642,094 | 15.7% |
[ 51.5% - 52.0% ] 51.79% | 3,467,211 | 15.5% |
[ 52.0% - 52.5% ] 52.20% | 3,603,292 | 13.3% |
[ 52.5% - 53.0% ] 52.76% | 3,173,348 | 14.4% |
[ 53.0% - 53.5% ] 53.23% | 3,213,470 | 15.5% |
[ 53.5% - 54.0% ] 53.78% | 2,994,894 | 13.2% |
[ 54.0% - 54.5% ] 54.32% | 4,167,943 | 12.3% |
[ 54.5% - 55.0% ] 54.82% | 3,658,591 | 14.8% |
[ 55.0% - 55.5% ] 55.29% | 3,104,565 | 15.3% |
[ 55.5% - 56.0% ] 55.76% | 3,940,556 | 13.2% |
[ 56.0% - 56.5% ] 56.23% | 2,828,086 | 15.1% |
[ 56.5% - 57.0% ] 56.70% | 4,809,008 | 12.6% |
[ 57.0% - 57.5% ] 57.26% | 2,924,701 | 16.2% |
[ 57.5% - 58.0% ] 57.74% | 2,966,438 | 13.1% |
[ 58.0% - 58.5% ] 58.26% | 2,738,909 | 12.3% |
[ 58.5% - 59.0% ] 58.75% | 3,441,174 | 13.4% |
[ 59.0% - 59.5% ] 59.26% | 6,313,809 | 12.7% |
[ 59.5% - 60.0% ] 59.74% | 3,002,011 | 14.3% |
[ 60.0% - 60.5% ] 60.23% | 3,633,540 | 12.5% |
[ 60.5% - 61.0% ] 60.75% | 3,752,152 | 13.8% |
[ 61.0% - 61.5% ] 61.32% | 3,706,530 | 14.0% |
[ 61.5% - 62.0% ] 61.77% | 2,447,204 | 15.1% |
[ 62.0% - 62.5% ] 62.23% | 2,732,913 | 13.3% |
[ 62.5% - 63.0% ] 62.76% | 4,857,341 | 12.5% |
[ 63.0% - 63.5% ] 63.23% | 3,735,919 | 12.0% |
[ 63.5% - 64.0% ] 63.71% | 3,198,917 | 11.9% |
[ 64.0% - 64.5% ] 64.22% | 3,770,477 | 11.8% |
[ 64.5% - 65.0% ] 64.76% | 3,907,253 | 12.6% |
[ 65.0% - 65.5% ] 65.30% | 3,491,773 | 14.0% |
[ 65.5% - 66.0% ] 65.73% | 3,622,667 | 12.6% |
[ 66.0% - 66.5% ] 66.25% | 3,039,912 | 12.8% |
[ 66.5% - 67.0% ] 66.78% | 2,794,587 | 12.7% |
[ 67.0% - 67.5% ] 67.26% | 3,483,812 | 13.1% |
[ 67.5% - 68.0% ] 67.75% | 2,914,074 | 12.6% |
[ 68.0% - 68.5% ] 68.22% | 3,691,844 | 12.2% |
[ 68.5% - 69.0% ] 68.77% | 3,713,245 | 12.6% |
[ 69.0% - 69.5% ] 69.22% | 3,213,729 | 13.4% |
[ 69.5% - 70.0% ] 69.76% | 3,566,091 | 14.4% |
[ 70.0% - 70.5% ] 70.24% | 2,670,793 | 12.7% |
[ 70.5% - 71.0% ] 70.73% | 2,969,557 | 12.2% |
[ 71.0% - 71.5% ] 71.28% | 3,696,821 | 12.5% |
[ 71.5% - 72.0% ] 71.75% | 3,719,303 | 12.5% |
[ 72.0% - 72.5% ] 72.22% | 4,352,764 | 12.2% |
[ 72.5% - 73.0% ] 72.72% | 4,031,452 | 13.3% |
[ 73.0% - 73.5% ] 73.26% | 3,630,181 | 13.8% |
[ 73.5% - 74.0% ] 73.74% | 4,481,324 | 13.3% |
[ 74.0% - 74.5% ] 74.24% | 3,552,332 | 15.0% |
[ 74.5% - 75.0% ] 74.76% | 3,219,929 | 12.4% |
[ 75.0% - 75.5% ] 75.28% | 3,356,237 | 13.8% |
[ 75.5% - 76.0% ] 75.73% | 4,384,513 | 12.0% |
[ 76.0% - 76.5% ] 76.24% | 3,633,713 | 13.2% |
[ 76.5% - 77.0% ] 76.75% | 3,529,178 | 13.9% |
[ 77.0% - 77.5% ] 77.25% | 3,642,525 | 12.8% |
[ 77.5% - 78.0% ] 77.75% | 3,602,873 | 12.9% |
[ 78.0% - 78.5% ] 78.26% | 3,600,138 | 14.5% |
[ 78.5% - 79.0% ] 78.74% | 3,890,898 | 14.3% |
[ 79.0% - 79.5% ] 79.25% | 3,375,591 | 14.1% |
[ 79.5% - 80.0% ] 79.75% | 3,095,603 | 14.0% |
[ 80.0% - 80.5% ] 80.24% | 2,876,706 | 14.7% |
[ 80.5% - 81.0% ] 80.75% | 4,375,462 | 13.7% |
[ 81.0% - 81.5% ] 81.26% | 4,118,789 | 11.8% |
[ 81.5% - 82.0% ] 81.78% | 4,347,071 | 14.8% |
[ 82.0% - 82.5% ] 82.25% | 3,481,060 | 13.7% |
[ 82.5% - 83.0% ] 82.76% | 3,910,375 | 13.7% |
[ 83.0% - 83.5% ] 83.24% | 3,787,641 | 11.9% |
[ 83.5% - 84.0% ] 83.76% | 3,686,015 | 13.0% |
[ 84.0% - 84.5% ] 84.26% | 3,397,530 | 14.9% |
[ 84.5% - 85.0% ] 84.76% | 3,473,450 | 16.1% |
[ 85.0% - 85.5% ] 85.23% | 4,316,518 | 14.0% |
[ 85.5% - 86.0% ] 85.76% | 3,626,849 | 13.8% |
[ 86.0% - 86.5% ] 86.25% | 3,463,735 | 14.7% |
[ 86.5% - 87.0% ] 86.74% | 3,714,496 | 14.0% |
[ 87.0% - 87.5% ] 87.27% | 3,803,420 | 14.9% |
[ 87.5% - 88.0% ] 87.74% | 3,690,882 | 15.0% |
[ 88.0% - 88.5% ] 88.26% | 3,694,914 | 15.7% |
[ 88.5% - 89.0% ] 88.74% | 3,676,406 | 15.6% |
[ 89.0% - 89.5% ] 89.25% | 3,372,912 | 14.0% |
[ 89.5% - 90.0% ] 89.74% | 2,974,399 | 13.1% |
[ 90.0% - 90.5% ] 90.25% | 2,613,275 | 17.3% |
[ 90.5% - 91.0% ] 90.76% | 3,358,774 | 14.9% |
[ 91.0% - 91.5% ] 91.24% | 3,607,578 | 15.7% |
[ 91.5% - 92.0% ] 91.74% | 2,867,303 | 17.2% |
[ 92.0% - 92.5% ] 92.26% | 3,260,017 | 16.3% |
[ 92.5% - 93.0% ] 92.75% | 2,996,388 | 16.8% |
[ 93.0% - 93.5% ] 93.25% | 3,015,505 | 17.3% |
[ 93.5% - 94.0% ] 93.75% | 2,412,111 | 19.0% |
[ 94.0% - 94.5% ] 94.25% | 2,823,613 | 17.7% |
[ 94.5% - 95.0% ] 94.74% | 2,760,909 | 21.1% |
[ 95.0% - 95.5% ] 95.26% | 2,312,990 | 20.5% |
[ 95.5% - 96.0% ] 95.76% | 1,988,627 | 21.2% |
[ 96.0% - 96.5% ] 96.24% | 1,567,061 | 22.0% |
[ 96.5% - 97.0% ] 96.75% | 1,304,515 | 22.6% |
[ 97.0% - 97.5% ] 97.25% | 1,170,639 | 22.7% |
[ 97.5% - 98.0% ] 97.74% | 1,010,814 | 26.8% |
[ 98.0% - 98.5% ] 98.25% | 605,786 | 27.3% |