Immigrants from Burma/Myanmar vs Immigrants from Oceania Single Male Poverty
COMPARE
Immigrants from Burma/Myanmar
Immigrants from Oceania
Single Male Poverty
Single Male Poverty Comparison
Immigrants from Burma/Myanmar
Immigrants from Oceania
13.1%
SINGLE MALE POVERTY
12.6/ 100
METRIC RATING
219th/ 347
METRIC RANK
12.4%
SINGLE MALE POVERTY
91.1/ 100
METRIC RATING
117th/ 347
METRIC RANK
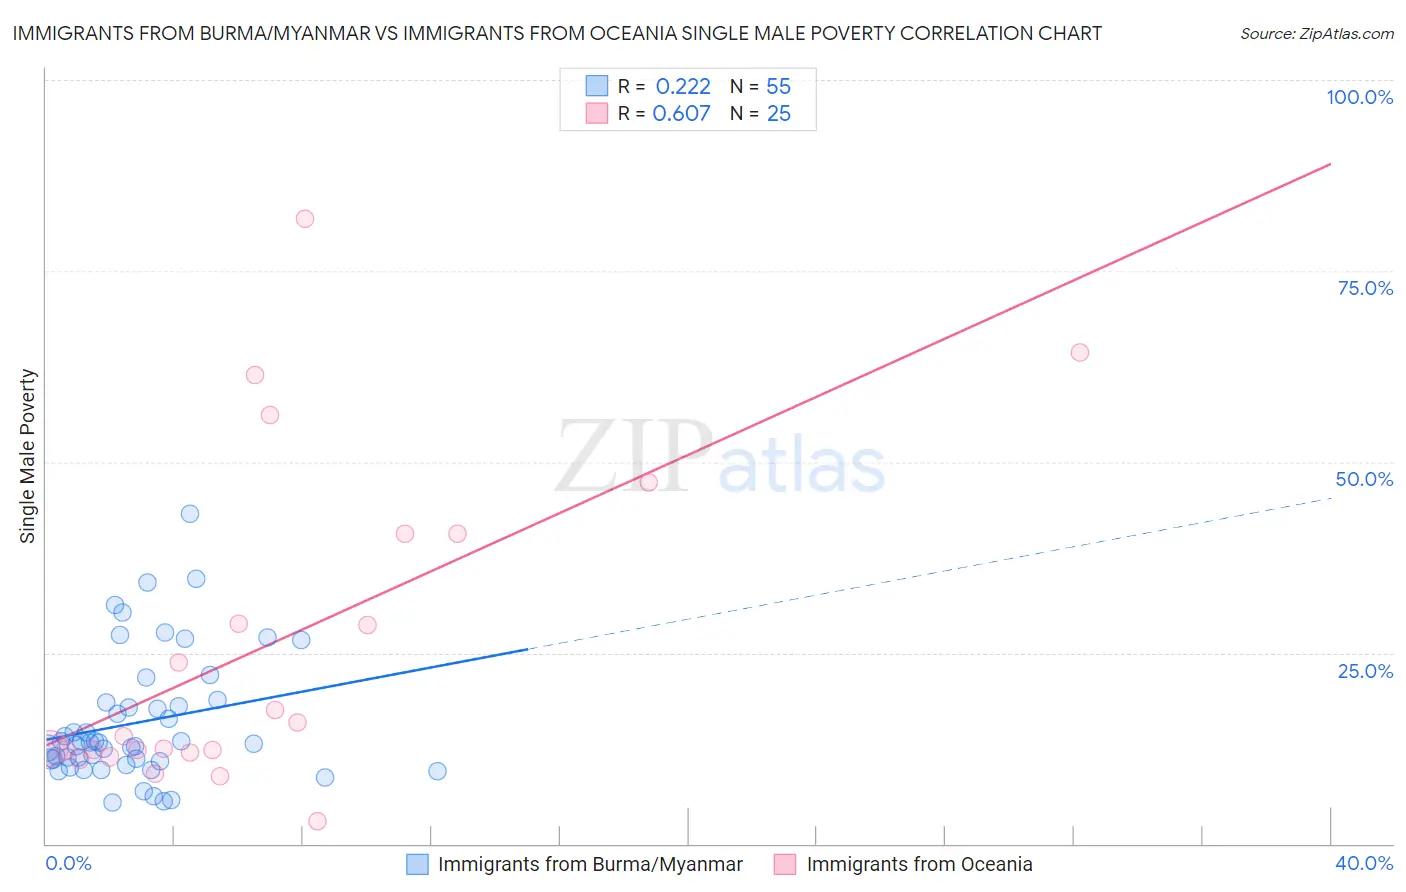
Immigrants from Burma/Myanmar vs Immigrants from Oceania Single Male Poverty Correlation Chart
The statistical analysis conducted on geographies consisting of 162,611,210 people shows a weak positive correlation between the proportion of Immigrants from Burma/Myanmar and poverty level among single males in the United States with a correlation coefficient (R) of 0.222 and weighted average of 13.1%. Similarly, the statistical analysis conducted on geographies consisting of 275,455,617 people shows a significant positive correlation between the proportion of Immigrants from Oceania and poverty level among single males in the United States with a correlation coefficient (R) of 0.607 and weighted average of 12.4%, a difference of 5.8%.
Single Male Poverty Correlation Summary
| Measurement | Immigrants from Burma/Myanmar | Immigrants from Oceania |
| Minimum | 5.4% | 3.0% |
| Maximum | 43.1% | 81.8% |
| Range | 37.7% | 78.9% |
| Mean | 15.9% | 26.0% |
| Median | 13.3% | 14.1% |
| Interquartile 25% (IQ1) | 10.8% | 12.1% |
| Interquartile 75% (IQ3) | 18.5% | 40.5% |
| Interquartile Range (IQR) | 7.8% | 28.4% |
| Standard Deviation (Sample) | 8.3% | 21.2% |
| Standard Deviation (Population) | 8.2% | 20.8% |
Similar Demographics by Single Male Poverty
Demographics Similar to Immigrants from Burma/Myanmar by Single Male Poverty
In terms of single male poverty, the demographic groups most similar to Immigrants from Burma/Myanmar are Scandinavian (13.1%, a difference of 0.030%), Bermudan (13.1%, a difference of 0.050%), Austrian (13.1%, a difference of 0.15%), Central American (13.2%, a difference of 0.22%), and Japanese (13.1%, a difference of 0.24%).
| Demographics | Rating | Rank | Single Male Poverty |
| Senegalese | 16.4 /100 | #212 | Poor 13.1% |
| Italians | 15.9 /100 | #213 | Poor 13.1% |
| Zimbabweans | 14.9 /100 | #214 | Poor 13.1% |
| Japanese | 14.8 /100 | #215 | Poor 13.1% |
| Austrians | 13.9 /100 | #216 | Poor 13.1% |
| Bermudans | 13.0 /100 | #217 | Poor 13.1% |
| Scandinavians | 12.9 /100 | #218 | Poor 13.1% |
| Immigrants | Burma/Myanmar | 12.6 /100 | #219 | Poor 13.1% |
| Central Americans | 10.9 /100 | #220 | Poor 13.2% |
| New Zealanders | 10.7 /100 | #221 | Poor 13.2% |
| Immigrants | Western Europe | 10.0 /100 | #222 | Poor 13.2% |
| Immigrants | Azores | 9.3 /100 | #223 | Tragic 13.2% |
| Somalis | 9.1 /100 | #224 | Tragic 13.2% |
| Immigrants | Denmark | 8.7 /100 | #225 | Tragic 13.2% |
| Jamaicans | 7.7 /100 | #226 | Tragic 13.2% |
Demographics Similar to Immigrants from Oceania by Single Male Poverty
In terms of single male poverty, the demographic groups most similar to Immigrants from Oceania are Immigrants from Syria (12.4%, a difference of 0.010%), Immigrants from Southern Europe (12.4%, a difference of 0.070%), Albanian (12.4%, a difference of 0.10%), Immigrants from Albania (12.4%, a difference of 0.13%), and Nicaraguan (12.4%, a difference of 0.18%).
| Demographics | Rating | Rank | Single Male Poverty |
| Immigrants | Portugal | 93.6 /100 | #110 | Exceptional 12.3% |
| Immigrants | North Macedonia | 93.6 /100 | #111 | Exceptional 12.3% |
| Kenyans | 93.3 /100 | #112 | Exceptional 12.4% |
| Pakistanis | 92.4 /100 | #113 | Exceptional 12.4% |
| Nicaraguans | 92.1 /100 | #114 | Exceptional 12.4% |
| Immigrants | Southern Europe | 91.5 /100 | #115 | Exceptional 12.4% |
| Immigrants | Syria | 91.2 /100 | #116 | Exceptional 12.4% |
| Immigrants | Oceania | 91.1 /100 | #117 | Exceptional 12.4% |
| Albanians | 90.6 /100 | #118 | Exceptional 12.4% |
| Immigrants | Albania | 90.3 /100 | #119 | Exceptional 12.4% |
| Venezuelans | 89.4 /100 | #120 | Excellent 12.4% |
| Icelanders | 88.2 /100 | #121 | Excellent 12.5% |
| Serbians | 87.9 /100 | #122 | Excellent 12.5% |
| Immigrants | Kenya | 87.6 /100 | #123 | Excellent 12.5% |
| Russians | 87.3 /100 | #124 | Excellent 12.5% |