Soviet Union vs Arapaho Married-Couple Family Poverty
COMPARE
Soviet Union
Arapaho
Married-Couple Family Poverty
Married-Couple Family Poverty Comparison
Soviet Union
Arapaho
4.9%
MARRIED-COUPLE FAMILY POVERTY
90.7/ 100
METRIC RATING
130th/ 347
METRIC RANK
6.6%
MARRIED-COUPLE FAMILY POVERTY
0.0/ 100
METRIC RATING
293rd/ 347
METRIC RANK
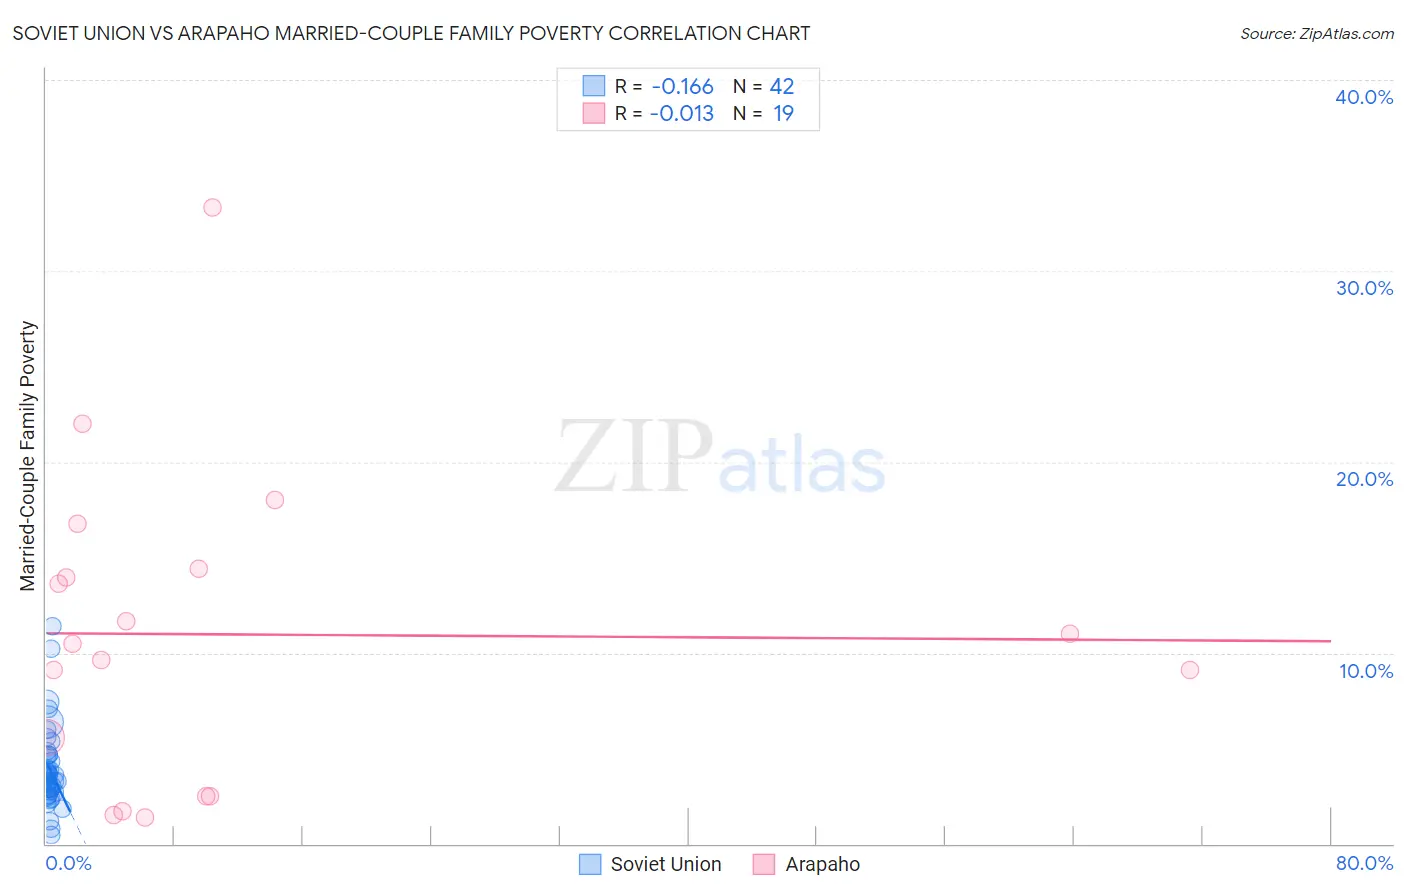
Soviet Union vs Arapaho Married-Couple Family Poverty Correlation Chart
The statistical analysis conducted on geographies consisting of 43,419,717 people shows a poor negative correlation between the proportion of Soviet Union and poverty level among married-couple families in the United States with a correlation coefficient (R) of -0.166 and weighted average of 4.9%. Similarly, the statistical analysis conducted on geographies consisting of 29,746,597 people shows no correlation between the proportion of Arapaho and poverty level among married-couple families in the United States with a correlation coefficient (R) of -0.013 and weighted average of 6.6%, a difference of 34.7%.
Married-Couple Family Poverty Correlation Summary
| Measurement | Soviet Union | Arapaho |
| Minimum | 0.48% | 1.4% |
| Maximum | 11.4% | 33.3% |
| Range | 10.9% | 31.9% |
| Mean | 3.9% | 11.0% |
| Median | 3.4% | 10.5% |
| Interquartile 25% (IQ1) | 2.7% | 2.5% |
| Interquartile 75% (IQ3) | 4.6% | 14.4% |
| Interquartile Range (IQR) | 1.9% | 11.9% |
| Standard Deviation (Sample) | 2.2% | 8.1% |
| Standard Deviation (Population) | 2.1% | 7.9% |
Similar Demographics by Married-Couple Family Poverty
Demographics Similar to Soviet Union by Married-Couple Family Poverty
In terms of married-couple family poverty, the demographic groups most similar to Soviet Union are Immigrants from Pakistan (4.9%, a difference of 0.010%), Immigrants from Eastern Europe (4.9%, a difference of 0.070%), Puget Sound Salish (4.9%, a difference of 0.080%), Immigrants from Kenya (4.9%, a difference of 0.15%), and Samoan (4.9%, a difference of 0.16%).
| Demographics | Rating | Rank | Married-Couple Family Poverty |
| Jordanians | 93.1 /100 | #123 | Exceptional 4.8% |
| Romanians | 92.5 /100 | #124 | Exceptional 4.8% |
| Immigrants | Bosnia and Herzegovina | 92.5 /100 | #125 | Exceptional 4.8% |
| Immigrants | Asia | 92.3 /100 | #126 | Exceptional 4.8% |
| Egyptians | 92.0 /100 | #127 | Exceptional 4.8% |
| Palestinians | 91.2 /100 | #128 | Exceptional 4.9% |
| Immigrants | Pakistan | 90.7 /100 | #129 | Exceptional 4.9% |
| Soviet Union | 90.7 /100 | #130 | Exceptional 4.9% |
| Immigrants | Eastern Europe | 90.5 /100 | #131 | Exceptional 4.9% |
| Puget Sound Salish | 90.4 /100 | #132 | Exceptional 4.9% |
| Immigrants | Kenya | 90.2 /100 | #133 | Exceptional 4.9% |
| Samoans | 90.2 /100 | #134 | Exceptional 4.9% |
| Assyrians/Chaldeans/Syriacs | 89.4 /100 | #135 | Excellent 4.9% |
| Immigrants | Hungary | 88.7 /100 | #136 | Excellent 4.9% |
| Guamanians/Chamorros | 86.5 /100 | #137 | Excellent 4.9% |
Demographics Similar to Arapaho by Married-Couple Family Poverty
In terms of married-couple family poverty, the demographic groups most similar to Arapaho are Immigrants from Lebanon (6.6%, a difference of 0.080%), Belizean (6.5%, a difference of 0.26%), Immigrants from Barbados (6.5%, a difference of 0.29%), Nepalese (6.5%, a difference of 0.52%), and Salvadoran (6.5%, a difference of 0.70%).
| Demographics | Rating | Rank | Married-Couple Family Poverty |
| Guyanese | 0.0 /100 | #286 | Tragic 6.5% |
| Ecuadorians | 0.0 /100 | #287 | Tragic 6.5% |
| Salvadorans | 0.0 /100 | #288 | Tragic 6.5% |
| Nepalese | 0.0 /100 | #289 | Tragic 6.5% |
| Immigrants | Barbados | 0.0 /100 | #290 | Tragic 6.5% |
| Belizeans | 0.0 /100 | #291 | Tragic 6.5% |
| Immigrants | Lebanon | 0.0 /100 | #292 | Tragic 6.6% |
| Arapaho | 0.0 /100 | #293 | Tragic 6.6% |
| Bahamians | 0.0 /100 | #294 | Tragic 6.6% |
| Immigrants | Uzbekistan | 0.0 /100 | #295 | Tragic 6.6% |
| U.S. Virgin Islanders | 0.0 /100 | #296 | Tragic 6.6% |
| Kiowa | 0.0 /100 | #297 | Tragic 6.6% |
| Immigrants | Guyana | 0.0 /100 | #298 | Tragic 6.7% |
| Nicaraguans | 0.0 /100 | #299 | Tragic 6.7% |
| Immigrants | Belize | 0.0 /100 | #300 | Tragic 6.7% |