Polish vs Immigrants from Uruguay Median Female Earnings
COMPARE
Polish
Immigrants from Uruguay
Median Female Earnings
Median Female Earnings Comparison
Poles
Immigrants from Uruguay
$40,371
MEDIAN FEMALE EARNINGS
80.2/ 100
METRIC RATING
148th/ 347
METRIC RANK
$38,945
MEDIAN FEMALE EARNINGS
17.3/ 100
METRIC RATING
204th/ 347
METRIC RANK
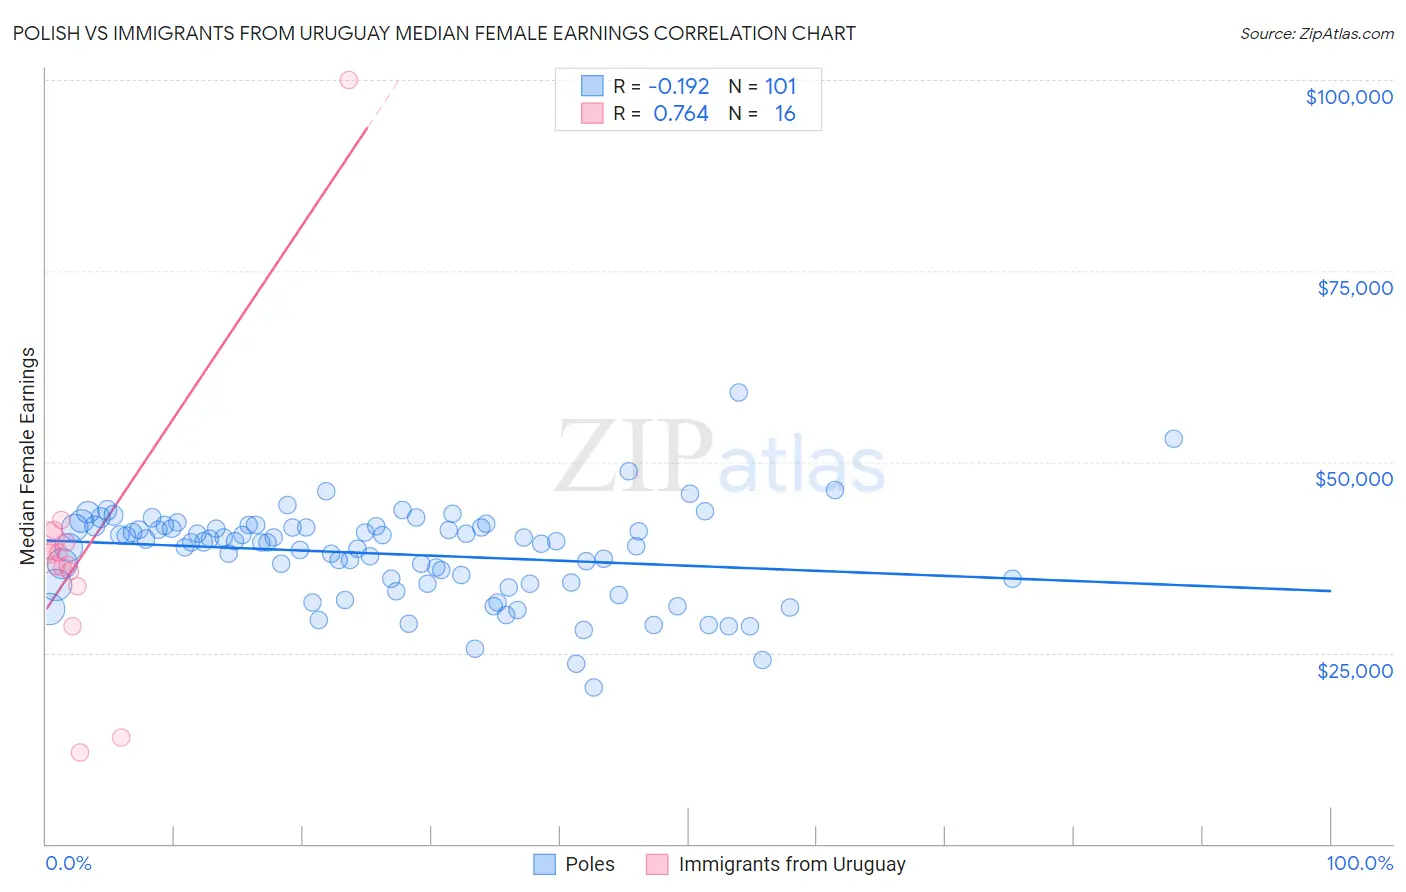
Polish vs Immigrants from Uruguay Median Female Earnings Correlation Chart
The statistical analysis conducted on geographies consisting of 559,155,660 people shows a poor negative correlation between the proportion of Poles and median female earnings in the United States with a correlation coefficient (R) of -0.192 and weighted average of $40,371. Similarly, the statistical analysis conducted on geographies consisting of 133,253,998 people shows a strong positive correlation between the proportion of Immigrants from Uruguay and median female earnings in the United States with a correlation coefficient (R) of 0.764 and weighted average of $38,945, a difference of 3.7%.
Median Female Earnings Correlation Summary
| Measurement | Polish | Immigrants from Uruguay |
| Minimum | $20,398 | $12,017 |
| Maximum | $59,044 | $100,000 |
| Range | $38,646 | $87,983 |
| Mean | $37,935 | $38,117 |
| Median | $39,430 | $37,217 |
| Interquartile 25% (IQ1) | $34,072 | $34,685 |
| Interquartile 75% (IQ3) | $41,456 | $39,605 |
| Interquartile Range (IQR) | $7,385 | $4,920 |
| Standard Deviation (Sample) | $6,072 | $18,714 |
| Standard Deviation (Population) | $6,042 | $18,119 |
Similar Demographics by Median Female Earnings
Demographics Similar to Poles by Median Female Earnings
In terms of median female earnings, the demographic groups most similar to Poles are Vietnamese ($40,377, a difference of 0.020%), Immigrants from Cameroon ($40,354, a difference of 0.040%), Immigrants from Chile ($40,353, a difference of 0.040%), Immigrants from Armenia ($40,340, a difference of 0.080%), and West Indian ($40,317, a difference of 0.13%).
| Demographics | Rating | Rank | Median Female Earnings |
| Immigrants | Syria | 84.1 /100 | #141 | Excellent $40,499 |
| Sri Lankans | 84.0 /100 | #142 | Excellent $40,496 |
| Northern Europeans | 83.9 /100 | #143 | Excellent $40,491 |
| Immigrants | North Macedonia | 83.8 /100 | #144 | Excellent $40,488 |
| Brazilians | 83.6 /100 | #145 | Excellent $40,483 |
| Ghanaians | 82.1 /100 | #146 | Excellent $40,429 |
| Vietnamese | 80.4 /100 | #147 | Excellent $40,377 |
| Poles | 80.2 /100 | #148 | Excellent $40,371 |
| Immigrants | Cameroon | 79.7 /100 | #149 | Good $40,354 |
| Immigrants | Chile | 79.6 /100 | #150 | Good $40,353 |
| Immigrants | Armenia | 79.2 /100 | #151 | Good $40,340 |
| West Indians | 78.4 /100 | #152 | Good $40,317 |
| British West Indians | 77.7 /100 | #153 | Good $40,299 |
| Immigrants | Oceania | 77.6 /100 | #154 | Good $40,297 |
| Immigrants | Africa | 76.2 /100 | #155 | Good $40,257 |
Demographics Similar to Immigrants from Uruguay by Median Female Earnings
In terms of median female earnings, the demographic groups most similar to Immigrants from Uruguay are Immigrants from Colombia ($38,913, a difference of 0.080%), Czech ($38,992, a difference of 0.12%), Immigrants from Bosnia and Herzegovina ($38,886, a difference of 0.15%), Slovak ($39,029, a difference of 0.22%), and Immigrants from Panama ($39,049, a difference of 0.27%).
| Demographics | Rating | Rank | Median Female Earnings |
| Assyrians/Chaldeans/Syriacs | 24.6 /100 | #197 | Fair $39,159 |
| Ecuadorians | 23.0 /100 | #198 | Fair $39,117 |
| Icelanders | 22.7 /100 | #199 | Fair $39,109 |
| Immigrants | Panama | 20.6 /100 | #200 | Fair $39,049 |
| Panamanians | 20.6 /100 | #201 | Fair $39,049 |
| Slovaks | 19.9 /100 | #202 | Poor $39,029 |
| Czechs | 18.7 /100 | #203 | Poor $38,992 |
| Immigrants | Uruguay | 17.3 /100 | #204 | Poor $38,945 |
| Immigrants | Colombia | 16.3 /100 | #205 | Poor $38,913 |
| Immigrants | Bosnia and Herzegovina | 15.6 /100 | #206 | Poor $38,886 |
| Immigrants | Cambodia | 14.2 /100 | #207 | Poor $38,833 |
| Immigrants | Thailand | 13.6 /100 | #208 | Poor $38,810 |
| Norwegians | 13.4 /100 | #209 | Poor $38,802 |
| Czechoslovakians | 12.0 /100 | #210 | Poor $38,738 |
| Aleuts | 11.6 /100 | #211 | Poor $38,719 |