Polish vs Immigrants from Uruguay Family Households with Children
COMPARE
Polish
Immigrants from Uruguay
Family Households with Children
Family Households with Children Comparison
Poles
Immigrants from Uruguay
26.5%
FAMILY HOUSEHOLDS WITH CHILDREN
0.2/ 100
METRIC RATING
292nd/ 347
METRIC RANK
27.4%
FAMILY HOUSEHOLDS WITH CHILDREN
37.7/ 100
METRIC RATING
190th/ 347
METRIC RANK
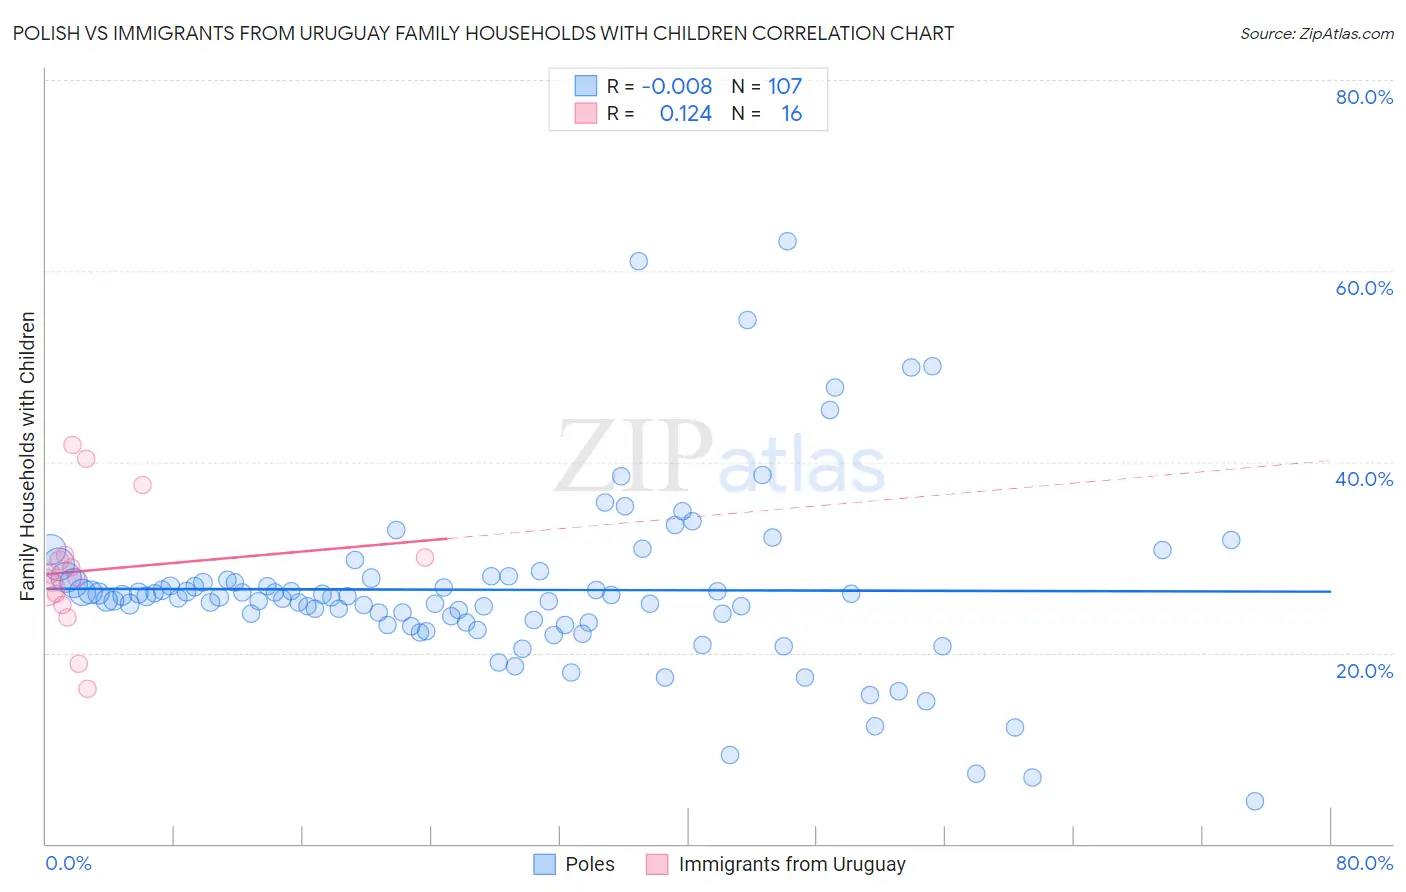
Polish vs Immigrants from Uruguay Family Households with Children Correlation Chart
The statistical analysis conducted on geographies consisting of 559,563,318 people shows no correlation between the proportion of Poles and percentage of family households with children in the United States with a correlation coefficient (R) of -0.008 and weighted average of 26.5%. Similarly, the statistical analysis conducted on geographies consisting of 133,231,566 people shows a poor positive correlation between the proportion of Immigrants from Uruguay and percentage of family households with children in the United States with a correlation coefficient (R) of 0.124 and weighted average of 27.4%, a difference of 3.4%.
Family Households with Children Correlation Summary
| Measurement | Polish | Immigrants from Uruguay |
| Minimum | 4.5% | 16.2% |
| Maximum | 63.2% | 41.7% |
| Range | 58.7% | 25.5% |
| Mean | 26.6% | 28.7% |
| Median | 25.8% | 28.1% |
| Interquartile 25% (IQ1) | 23.1% | 25.6% |
| Interquartile 75% (IQ3) | 27.8% | 30.1% |
| Interquartile Range (IQR) | 4.7% | 4.5% |
| Standard Deviation (Sample) | 9.3% | 6.8% |
| Standard Deviation (Population) | 9.2% | 6.6% |
Similar Demographics by Family Households with Children
Demographics Similar to Poles by Family Households with Children
In terms of family households with children, the demographic groups most similar to Poles are Albanian (26.5%, a difference of 0.010%), Bahamian (26.5%, a difference of 0.010%), Black/African American (26.5%, a difference of 0.050%), Latvian (26.4%, a difference of 0.11%), and Immigrants from Sweden (26.5%, a difference of 0.13%).
| Demographics | Rating | Rank | Family Households with Children |
| Cambodians | 0.2 /100 | #285 | Tragic 26.5% |
| Immigrants | Senegal | 0.2 /100 | #286 | Tragic 26.5% |
| Shoshone | 0.2 /100 | #287 | Tragic 26.5% |
| Russians | 0.2 /100 | #288 | Tragic 26.5% |
| Immigrants | Sweden | 0.2 /100 | #289 | Tragic 26.5% |
| Albanians | 0.2 /100 | #290 | Tragic 26.5% |
| Bahamians | 0.2 /100 | #291 | Tragic 26.5% |
| Poles | 0.2 /100 | #292 | Tragic 26.5% |
| Blacks/African Americans | 0.1 /100 | #293 | Tragic 26.5% |
| Latvians | 0.1 /100 | #294 | Tragic 26.4% |
| Macedonians | 0.1 /100 | #295 | Tragic 26.4% |
| Croatians | 0.1 /100 | #296 | Tragic 26.4% |
| Armenians | 0.1 /100 | #297 | Tragic 26.4% |
| Immigrants | Western Europe | 0.1 /100 | #298 | Tragic 26.4% |
| Trinidadians and Tobagonians | 0.1 /100 | #299 | Tragic 26.4% |
Demographics Similar to Immigrants from Uruguay by Family Households with Children
In terms of family households with children, the demographic groups most similar to Immigrants from Uruguay are Sudanese (27.4%, a difference of 0.0%), Pennsylvania German (27.4%, a difference of 0.0%), Immigrants from Israel (27.4%, a difference of 0.010%), Swedish (27.4%, a difference of 0.020%), and Dutch (27.4%, a difference of 0.030%).
| Demographics | Rating | Rank | Family Households with Children |
| South Africans | 44.9 /100 | #183 | Average 27.4% |
| Native Hawaiians | 44.6 /100 | #184 | Average 27.4% |
| Delaware | 42.0 /100 | #185 | Average 27.4% |
| Immigrants | Brazil | 40.6 /100 | #186 | Average 27.4% |
| Creek | 39.8 /100 | #187 | Fair 27.4% |
| Dutch | 38.8 /100 | #188 | Fair 27.4% |
| Immigrants | Israel | 37.9 /100 | #189 | Fair 27.4% |
| Immigrants | Uruguay | 37.7 /100 | #190 | Fair 27.4% |
| Sudanese | 37.6 /100 | #191 | Fair 27.4% |
| Pennsylvania Germans | 37.5 /100 | #192 | Fair 27.4% |
| Swedes | 36.9 /100 | #193 | Fair 27.4% |
| Immigrants | Iran | 36.1 /100 | #194 | Fair 27.4% |
| Crow | 35.7 /100 | #195 | Fair 27.4% |
| Cheyenne | 35.1 /100 | #196 | Fair 27.4% |
| Norwegians | 35.0 /100 | #197 | Fair 27.4% |