Immigrants from China vs Nonimmigrants Married-Couple Family Poverty

COMPARE

Immigrants from China
Race
Ancestry
AfghanAfricanAlaska NativeAlaskan AthabascanAlbanianAleutAlsatianAmericanApacheArabArapahoArgentineanArmenianAssyrian/Chaldean/SyriacAustralianAustrianBahamianBangladeshiBarbadianBasqueBelgianBelizeanBermudanBhutaneseBlackfeetBolivianBrazilianBritishBritish West IndianBulgarianBurmeseCajunCambodianCanadianCape VerdeanCarpatho RusynCelticCentral AmericanCentral American IndianCherokeeCheyenneChickasawChileanChineseChippewaChoctawColombianColvilleComancheCosta RicanCreeCreekCroatianCrowCubanCypriotCzechCzechoslovakianDanishDelawareDominicanDutchDutch West IndianEastern EuropeanEcuadorianEgyptianEnglishEstonianEthiopianEuropeanFijianFilipinoFinnishFrenchFrench American IndianFrench CanadianGermanGerman RussianGhanaianGreekGuamanian/ChamorroGuatemalanGuyaneseHaitianHmongHonduranHopiHoumaHungarianIcelanderIndian (Asian)IndonesianInupiatIranianIraqiIrishIroquoisIsraeliItalianJamaicanJapaneseJordanianKenyanKiowaKoreanLaotianLatvianLebaneseLiberianLithuanianLumbeeLuxembourgerMacedonianMalaysianMalteseMarshalleseMenomineeMexicanMexican American IndianMongolianMoroccanNative HawaiianNavajoNepaleseNew ZealanderNicaraguanNigerianNorthern EuropeanNorwegianOkinawanOsageOttawaPaiutePakistaniPalestinianPanamanianParaguayanPennsylvania GermanPeruvianPimaPolishPortuguesePotawatomiPuebloPuerto RicanPuget Sound SalishRomanianRussianSalvadoranSamoanScandinavianScotch-IrishScottishSeminoleSenegaleseSerbianShoshoneSierra LeoneanSiouxSlavicSlovakSloveneSomaliSouth AfricanSouth AmericanSouth American IndianSoviet UnionSpaniardSpanishSpanish AmericanSpanish American IndianSri LankanSubsaharan AfricanSudaneseSwedishSwissSyrianTaiwaneseThaiTlingit-HaidaTohono O'OdhamTonganTrinidadian and TobagonianTsimshianTurkishU.S. Virgin IslanderUgandanUkrainianUruguayanUteVenezuelanVietnameseWelshWest IndianYakamaYaquiYugoslavianYumanYup'ikZimbabwean
Immigration
ImmigrantsAfghanistanAfricaAlbaniaArgentinaArmeniaAsiaAustraliaAustriaBahamasBangladeshBarbadosBelarusBelgiumBelizeBoliviaBosnia and HerzegovinaBrazilBulgariaBurma/MyanmarCabo VerdeCambodiaCameroonCanadaCaribbeanCentral AmericaChileChinaColombiaCongoCosta RicaCroatiaCubaCzechoslovakiaDenmarkDominicaDominican RepublicEastern AfricaEastern AsiaEastern EuropeEcuadorEgyptEl SalvadorEnglandEritreaEthiopiaEuropeFijiFranceGermanyGhanaGreeceGrenadaGuatemalaGuyanaHaitiHondurasHong KongHungaryIndiaIndonesiaIranIraqIrelandIsraelItalyJamaicaJapanJordanKazakhstanKenyaKoreaKuwaitLaosLatin AmericaLatviaLebanonLiberiaLithuaniaMalaysiaMexicoMicronesiaMiddle AfricaMoldovaMoroccoNepalNetherlandsNicaraguaNigeriaNorth AmericaNorth MacedoniaNorthern AfricaNorthern EuropeNorwayOceaniaPakistanPanamaPeruPhilippinesPolandPortugalRomaniaRussiaSaudi ArabiaScotlandSenegalSerbiaSierra LeoneSingaporeSomaliaSouth AfricaSouth AmericaSouth Central AsiaSouth Eastern AsiaSouthern EuropeSpainSri LankaSt. Vincent and the GrenadinesSudanSwedenSwitzerlandSyriaTaiwanThailandTrinidad and TobagoTurkeyUgandaUkraineUruguayUzbekistanVenezuelaVietnamWest IndiesWestern AfricaWestern AsiaWestern EuropeYemenZaireZimbabweAzores
Nonimmigrants
Race
Ancestry
AfghanAfricanAlaska NativeAlaskan AthabascanAlbanianAleutAlsatianAmericanApacheArabArapahoArgentineanArmenianAssyrian/Chaldean/SyriacAustralianAustrianBahamianBangladeshiBarbadianBasqueBelgianBelizeanBermudanBhutaneseBlackfeetBolivianBrazilianBritishBritish West IndianBulgarianBurmeseCajunCambodianCanadianCape VerdeanCarpatho RusynCelticCentral AmericanCentral American IndianCherokeeCheyenneChickasawChileanChineseChippewaChoctawColombianColvilleComancheCosta RicanCreeCreekCroatianCrowCubanCypriotCzechCzechoslovakianDanishDelawareDominicanDutchDutch West IndianEastern EuropeanEcuadorianEgyptianEnglishEstonianEthiopianEuropeanFijianFilipinoFinnishFrenchFrench American IndianFrench CanadianGermanGerman RussianGhanaianGreekGuamanian/ChamorroGuatemalanGuyaneseHaitianHmongHonduranHopiHoumaHungarianIcelanderIndian (Asian)IndonesianInupiatIranianIraqiIrishIroquoisIsraeliItalianJamaicanJapaneseJordanianKenyanKiowaKoreanLaotianLatvianLebaneseLiberianLithuanianLumbeeLuxembourgerMacedonianMalaysianMalteseMarshalleseMenomineeMexicanMexican American IndianMongolianMoroccanNative HawaiianNavajoNepaleseNew ZealanderNicaraguanNigerianNorthern EuropeanNorwegianOkinawanOsageOttawaPaiutePakistaniPalestinianPanamanianParaguayanPennsylvania GermanPeruvianPimaPolishPortuguesePotawatomiPuebloPuerto RicanPuget Sound SalishRomanianRussianSalvadoranSamoanScandinavianScotch-IrishScottishSeminoleSenegaleseSerbianShoshoneSierra LeoneanSiouxSlavicSlovakSloveneSomaliSouth AfricanSouth AmericanSouth American IndianSoviet UnionSpaniardSpanishSpanish AmericanSpanish American IndianSri LankanSubsaharan AfricanSudaneseSwedishSwissSyrianTaiwaneseThaiTlingit-HaidaTohono O'OdhamTonganTrinidadian and TobagonianTsimshianTurkishU.S. Virgin IslanderUgandanUkrainianUruguayanUteVenezuelanVietnameseWelshWest IndianYakamaYaquiYugoslavianYumanYup'ikZimbabwean
Immigration
NonimmigrantsImmigrantsAfghanistanAfricaAlbaniaArgentinaArmeniaAsiaAustraliaAustriaBahamasBangladeshBarbadosBelarusBelgiumBelizeBoliviaBosnia and HerzegovinaBrazilBulgariaBurma/MyanmarCabo VerdeCambodiaCameroonCanadaCaribbeanCentral AmericaChileColombiaCongoCosta RicaCroatiaCubaCzechoslovakiaDenmarkDominicaDominican RepublicEastern AfricaEastern AsiaEastern EuropeEcuadorEgyptEl SalvadorEnglandEritreaEthiopiaEuropeFijiFranceGermanyGhanaGreeceGrenadaGuatemalaGuyanaHaitiHondurasHong KongHungaryIndiaIndonesiaIranIraqIrelandIsraelItalyJamaicaJapanJordanKazakhstanKenyaKoreaKuwaitLaosLatin AmericaLatviaLebanonLiberiaLithuaniaMalaysiaMexicoMicronesiaMiddle AfricaMoldovaMoroccoNepalNetherlandsNicaraguaNigeriaNorth AmericaNorth MacedoniaNorthern AfricaNorthern EuropeNorwayOceaniaPakistanPanamaPeruPhilippinesPolandPortugalRomaniaRussiaSaudi ArabiaScotlandSenegalSerbiaSierra LeoneSingaporeSomaliaSouth AfricaSouth AmericaSouth Central AsiaSouth Eastern AsiaSouthern EuropeSpainSri LankaSt. Vincent and the GrenadinesSudanSwedenSwitzerlandSyriaTaiwanThailandTrinidad and TobagoTurkeyUgandaUkraineUruguayUzbekistanVenezuelaVietnamWest IndiesWestern AfricaWestern AsiaWestern EuropeYemenZaireZimbabweAzores
Married-Couple Family Poverty
Income
Poverty
Unemployment
Labor Participation
Family Structure
Vehicle Availability
Education Level
Disability

Married-Couple Family Poverty Comparison

Immigrants from China

Nonimmigrants

Excellent
Fair
5.0%
MARRIED-COUPLE FAMILY POVERTY
84.6/ 100
METRIC RATING
142nd/ 347
METRIC RANK
5.3%
MARRIED-COUPLE FAMILY POVERTY
35.8/ 100
METRIC RATING
184th/ 347
METRIC RANK

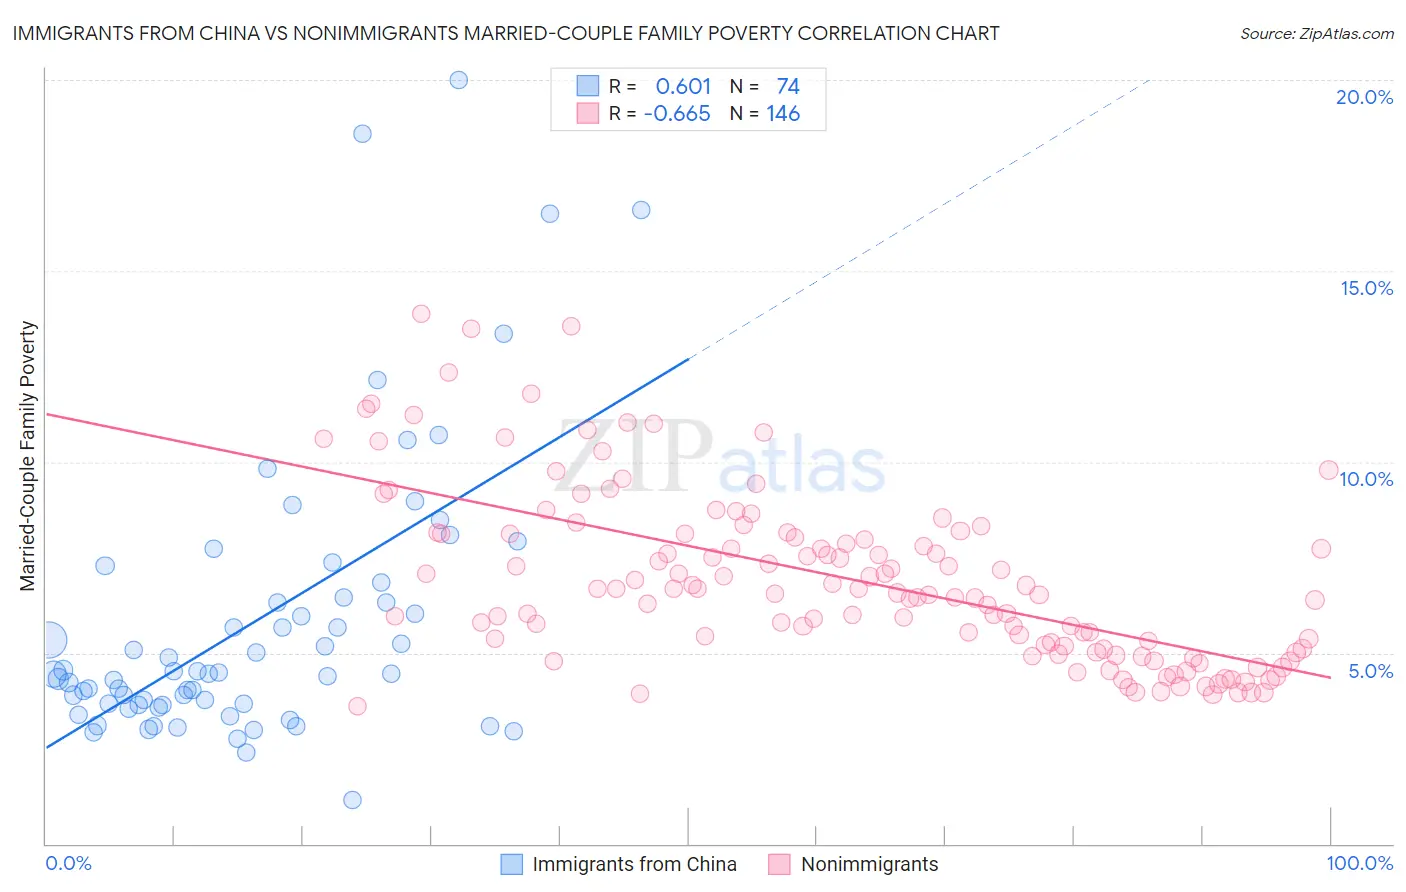
Immigrants from China vs Nonimmigrants Married-Couple Family Poverty Correlation Chart

The statistical analysis conducted on geographies consisting of 451,197,331 people shows a significant positive correlation between the proportion of Immigrants from China and poverty level among married-couple families in the United States with a correlation coefficient (R) of 0.601 and weighted average of 5.0%. Similarly, the statistical analysis conducted on geographies consisting of 567,493,090 people shows a significant negative correlation between the proportion of Nonimmigrants and poverty level among married-couple families in the United States with a correlation coefficient (R) of -0.665 and weighted average of 5.3%, a difference of 7.0%.
Immigrants from China vs Nonimmigrants Married-Couple Family Poverty

Married-Couple Family Poverty Correlation Summary

MeasurementImmigrants from ChinaNonimmigrants
Minimum1.1%3.6%
Maximum20.0%13.9%
Range18.9%10.3%
Mean5.8%6.9%
Median4.5%6.6%
Interquartile 25% (IQ1)3.6%5.1%
Interquartile 75% (IQ3)6.5%8.1%
Interquartile Range (IQR)2.8%3.0%
Standard Deviation (Sample)3.7%2.3%
Standard Deviation (Population)3.7%2.2%

Similar Demographics by Married-Couple Family Poverty

Demographics Similar to Immigrants from China by Married-Couple Family Poverty

In terms of married-couple family poverty, the demographic groups most similar to Immigrants from China are Immigrants from Brazil (5.0%, a difference of 0.0%), Immigrants from Portugal (5.0%, a difference of 0.050%), German Russian (5.0%, a difference of 0.11%), Immigrants from Egypt (5.0%, a difference of 0.27%), and Hmong (5.0%, a difference of 0.32%).
DemographicsRating | RankMarried-Couple Family Poverty
Assyrians/Chaldeans/Syriacs
89.4
/100
|
#135
Excellent
4.9%
Immigrants | Hungary
88.7
/100
|
#136
Excellent
4.9%
Guamanians/Chamorros
86.5
/100
|
#137
Excellent
4.9%
Chileans
86.0
/100
|
#138
Excellent
4.9%
German Russians
85.1
/100
|
#139
Excellent
5.0%
Immigrants | Portugal
84.8
/100
|
#140
Excellent
5.0%
Immigrants | Brazil
84.6
/100
|
#141
Excellent
5.0%
Immigrants | China
84.6
/100
|
#142
Excellent
5.0%
Immigrants | Egypt
83.4
/100
|
#143
Excellent
5.0%
Hmong
83.2
/100
|
#144
Excellent
5.0%
Immigrants | Spain
79.9
/100
|
#145
Good
5.0%
Mongolians
79.8
/100
|
#146
Good
5.0%
Syrians
78.7
/100
|
#147
Good
5.0%
Immigrants | Russia
78.7
/100
|
#148
Good
5.0%
Immigrants | Oceania
78.6
/100
|
#149
Good
5.0%

Demographics Similar to Nonimmigrants by Married-Couple Family Poverty

In terms of married-couple family poverty, the demographic groups most similar to Nonimmigrants are American (5.3%, a difference of 0.060%), Hungarian (5.3%, a difference of 0.13%), Peruvian (5.3%, a difference of 0.22%), Immigrants from Vietnam (5.3%, a difference of 0.24%), and Immigrants from Albania (5.3%, a difference of 0.25%).
DemographicsRating | RankMarried-Couple Family Poverty
Immigrants | Kazakhstan
45.1
/100
|
#177
Average
5.2%
Immigrants | Ukraine
44.9
/100
|
#178
Average
5.2%
Spanish
41.4
/100
|
#179
Average
5.3%
Immigrants | Sierra Leone
39.3
/100
|
#180
Fair
5.3%
Immigrants | Chile
38.8
/100
|
#181
Fair
5.3%
Immigrants | Vietnam
37.7
/100
|
#182
Fair
5.3%
Peruvians
37.6
/100
|
#183
Fair
5.3%
Immigrants | Nonimmigrants
35.8
/100
|
#184
Fair
5.3%
Americans
35.4
/100
|
#185
Fair
5.3%
Hungarians
34.7
/100
|
#186
Fair
5.3%
Immigrants | Albania
33.8
/100
|
#187
Fair
5.3%
Israelis
33.1
/100
|
#188
Fair
5.3%
South American Indians
32.5
/100
|
#189
Fair
5.3%
Ugandans
31.6
/100
|
#190
Fair
5.3%
Immigrants | Cabo Verde
30.9
/100
|
#191
Fair
5.3%