Arab vs Immigrants Married-Couple Family Poverty
COMPARE
Arab
Immigrants
Married-Couple Family Poverty
Married-Couple Family Poverty Comparison
Arabs
Immigrants
5.7%
MARRIED-COUPLE FAMILY POVERTY
5.4/ 100
METRIC RATING
228th/ 347
METRIC RANK
6.0%
MARRIED-COUPLE FAMILY POVERTY
0.5/ 100
METRIC RATING
258th/ 347
METRIC RANK
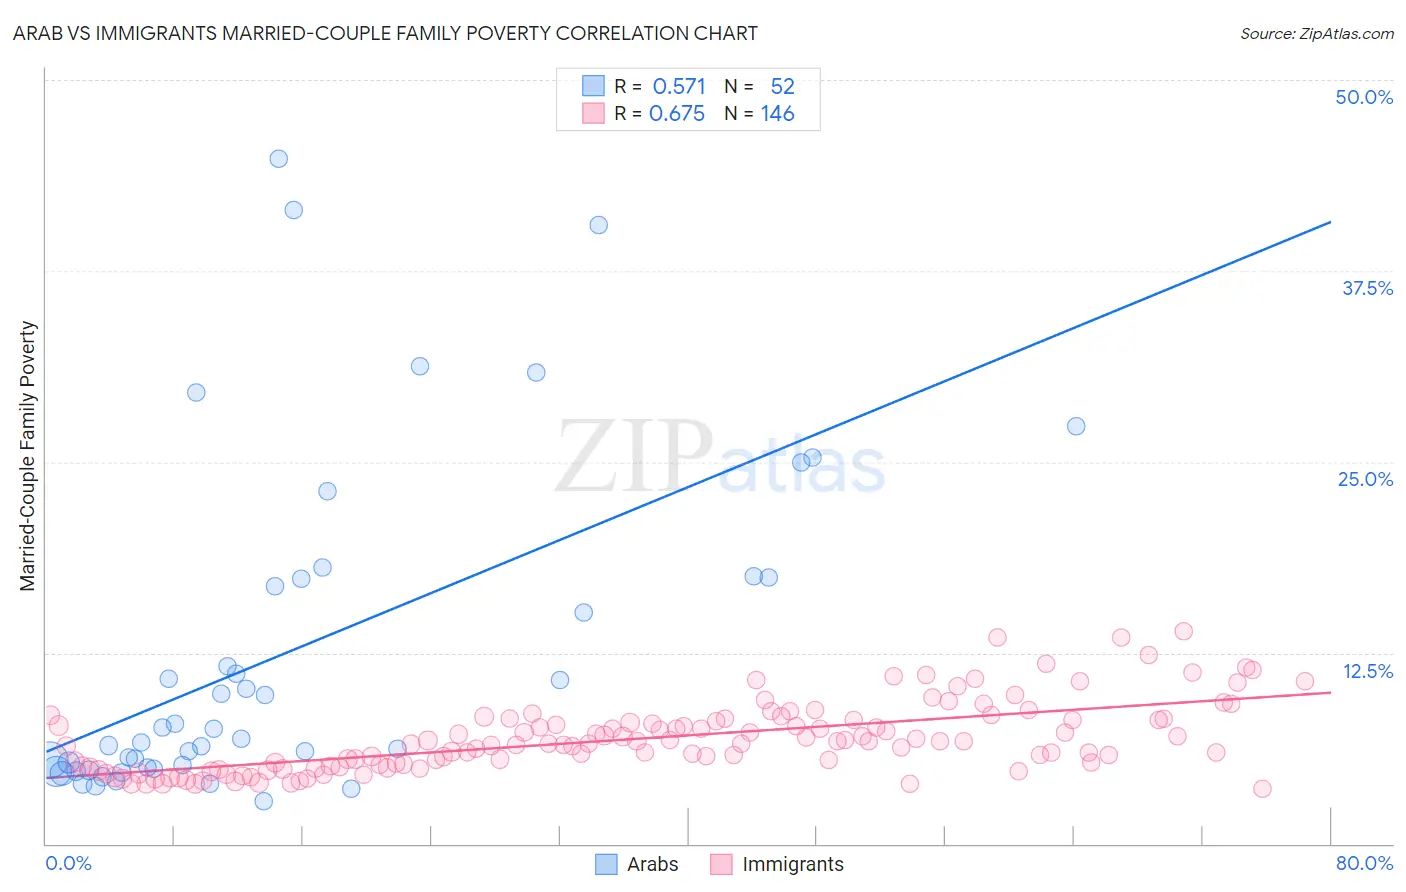
Arab vs Immigrants Married-Couple Family Poverty Correlation Chart
The statistical analysis conducted on geographies consisting of 480,161,401 people shows a substantial positive correlation between the proportion of Arabs and poverty level among married-couple families in the United States with a correlation coefficient (R) of 0.571 and weighted average of 5.7%. Similarly, the statistical analysis conducted on geographies consisting of 562,504,380 people shows a significant positive correlation between the proportion of Immigrants and poverty level among married-couple families in the United States with a correlation coefficient (R) of 0.675 and weighted average of 6.0%, a difference of 6.7%.
Married-Couple Family Poverty Correlation Summary
| Measurement | Arab | Immigrants |
| Minimum | 2.8% | 3.6% |
| Maximum | 44.8% | 13.9% |
| Range | 42.1% | 10.3% |
| Mean | 12.5% | 6.9% |
| Median | 7.2% | 6.6% |
| Interquartile 25% (IQ1) | 5.0% | 5.1% |
| Interquartile 75% (IQ3) | 17.4% | 8.1% |
| Interquartile Range (IQR) | 12.4% | 3.0% |
| Standard Deviation (Sample) | 10.8% | 2.2% |
| Standard Deviation (Population) | 10.7% | 2.2% |
Similar Demographics by Married-Couple Family Poverty
Demographics Similar to Arabs by Married-Couple Family Poverty
In terms of married-couple family poverty, the demographic groups most similar to Arabs are Immigrants from Zaire (5.6%, a difference of 0.13%), South American (5.6%, a difference of 0.15%), Subsaharan African (5.7%, a difference of 0.25%), Moroccan (5.7%, a difference of 0.28%), and Immigrants from Cambodia (5.6%, a difference of 0.37%).
| Demographics | Rating | Rank | Married-Couple Family Poverty |
| Panamanians | 9.2 /100 | #221 | Tragic 5.6% |
| Cajuns | 6.9 /100 | #222 | Tragic 5.6% |
| Immigrants | Fiji | 6.7 /100 | #223 | Tragic 5.6% |
| Sudanese | 6.4 /100 | #224 | Tragic 5.6% |
| Immigrants | Cambodia | 6.1 /100 | #225 | Tragic 5.6% |
| South Americans | 5.7 /100 | #226 | Tragic 5.6% |
| Immigrants | Zaire | 5.6 /100 | #227 | Tragic 5.6% |
| Arabs | 5.4 /100 | #228 | Tragic 5.7% |
| Sub-Saharan Africans | 4.9 /100 | #229 | Tragic 5.7% |
| Moroccans | 4.9 /100 | #230 | Tragic 5.7% |
| Immigrants | Iraq | 4.4 /100 | #231 | Tragic 5.7% |
| Immigrants | Laos | 4.4 /100 | #232 | Tragic 5.7% |
| Immigrants | Colombia | 3.7 /100 | #233 | Tragic 5.7% |
| Immigrants | Uruguay | 3.7 /100 | #234 | Tragic 5.7% |
| Immigrants | Sudan | 3.5 /100 | #235 | Tragic 5.7% |
Demographics Similar to Immigrants by Married-Couple Family Poverty
In terms of married-couple family poverty, the demographic groups most similar to Immigrants are Immigrants from Burma/Myanmar (6.0%, a difference of 0.13%), Bangladeshi (6.0%, a difference of 0.37%), Alaskan Athabascan (6.1%, a difference of 0.58%), Jamaican (6.1%, a difference of 0.79%), and Comanche (6.0%, a difference of 0.87%).
| Demographics | Rating | Rank | Married-Couple Family Poverty |
| Immigrants | Ghana | 1.0 /100 | #251 | Tragic 5.9% |
| Immigrants | Western Asia | 0.7 /100 | #252 | Tragic 6.0% |
| Africans | 0.7 /100 | #253 | Tragic 6.0% |
| Immigrants | Somalia | 0.7 /100 | #254 | Tragic 6.0% |
| Comanche | 0.7 /100 | #255 | Tragic 6.0% |
| Bangladeshis | 0.5 /100 | #256 | Tragic 6.0% |
| Immigrants | Burma/Myanmar | 0.5 /100 | #257 | Tragic 6.0% |
| Immigrants | Immigrants | 0.5 /100 | #258 | Tragic 6.0% |
| Alaskan Athabascans | 0.4 /100 | #259 | Tragic 6.1% |
| Jamaicans | 0.3 /100 | #260 | Tragic 6.1% |
| Senegalese | 0.3 /100 | #261 | Tragic 6.1% |
| Shoshone | 0.3 /100 | #262 | Tragic 6.1% |
| Immigrants | Senegal | 0.3 /100 | #263 | Tragic 6.1% |
| Immigrants | Congo | 0.2 /100 | #264 | Tragic 6.1% |
| Blackfeet | 0.2 /100 | #265 | Tragic 6.2% |