Guatemalan vs Dutch West Indian Married-Couple Family Poverty
COMPARE
Guatemalan
Dutch West Indian
Married-Couple Family Poverty
Married-Couple Family Poverty Comparison
Guatemalans
Dutch West Indians
7.0%
MARRIED-COUPLE FAMILY POVERTY
0.0/ 100
METRIC RATING
307th/ 347
METRIC RANK
6.4%
MARRIED-COUPLE FAMILY POVERTY
0.0/ 100
METRIC RATING
284th/ 347
METRIC RANK
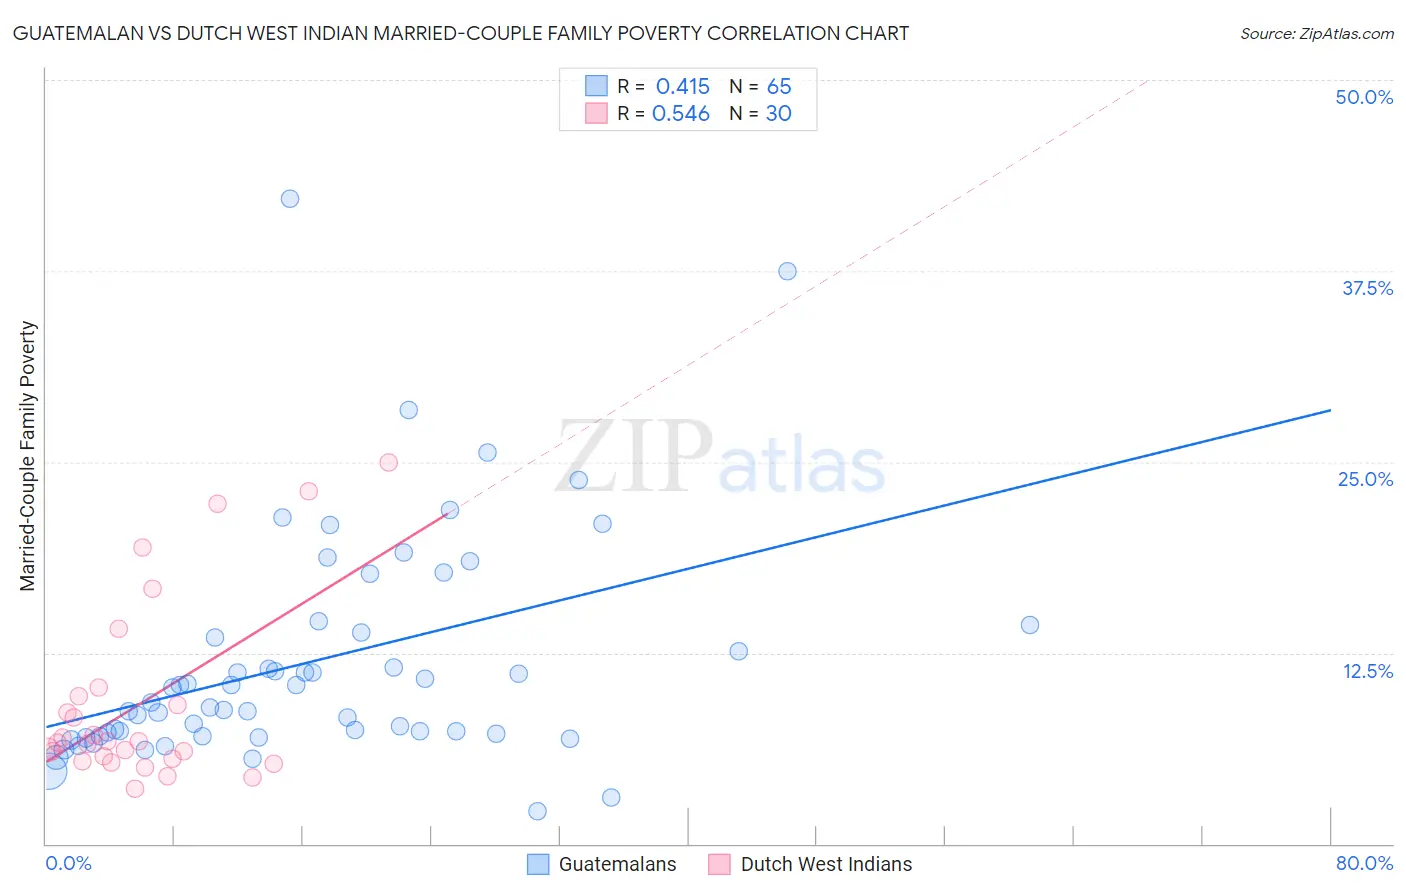
Guatemalan vs Dutch West Indian Married-Couple Family Poverty Correlation Chart
The statistical analysis conducted on geographies consisting of 406,520,979 people shows a moderate positive correlation between the proportion of Guatemalans and poverty level among married-couple families in the United States with a correlation coefficient (R) of 0.415 and weighted average of 7.0%. Similarly, the statistical analysis conducted on geographies consisting of 85,614,682 people shows a substantial positive correlation between the proportion of Dutch West Indians and poverty level among married-couple families in the United States with a correlation coefficient (R) of 0.546 and weighted average of 6.4%, a difference of 9.2%.
Married-Couple Family Poverty Correlation Summary
| Measurement | Guatemalan | Dutch West Indian |
| Minimum | 2.1% | 3.6% |
| Maximum | 42.2% | 25.0% |
| Range | 40.1% | 21.4% |
| Mean | 11.9% | 9.2% |
| Median | 9.3% | 6.7% |
| Interquartile 25% (IQ1) | 7.1% | 5.6% |
| Interquartile 75% (IQ3) | 14.1% | 9.6% |
| Interquartile Range (IQR) | 7.0% | 4.0% |
| Standard Deviation (Sample) | 7.5% | 6.0% |
| Standard Deviation (Population) | 7.5% | 5.9% |
Similar Demographics by Married-Couple Family Poverty
Demographics Similar to Guatemalans by Married-Couple Family Poverty
In terms of married-couple family poverty, the demographic groups most similar to Guatemalans are Spanish American Indian (7.1%, a difference of 0.18%), Hopi (7.1%, a difference of 0.78%), Immigrants from Nicaragua (7.1%, a difference of 0.81%), Immigrants from Dominica (7.1%, a difference of 0.86%), and Immigrants from Armenia (7.1%, a difference of 0.86%).
| Demographics | Rating | Rank | Married-Couple Family Poverty |
| Immigrants | Belize | 0.0 /100 | #300 | Tragic 6.7% |
| Central Americans | 0.0 /100 | #301 | Tragic 6.7% |
| Immigrants | Ecuador | 0.0 /100 | #302 | Tragic 6.7% |
| Immigrants | El Salvador | 0.0 /100 | #303 | Tragic 6.8% |
| Cubans | 0.0 /100 | #304 | Tragic 6.8% |
| Haitians | 0.0 /100 | #305 | Tragic 6.8% |
| Immigrants | Haiti | 0.0 /100 | #306 | Tragic 7.0% |
| Guatemalans | 0.0 /100 | #307 | Tragic 7.0% |
| Spanish American Indians | 0.0 /100 | #308 | Tragic 7.1% |
| Hopi | 0.0 /100 | #309 | Tragic 7.1% |
| Immigrants | Nicaragua | 0.0 /100 | #310 | Tragic 7.1% |
| Immigrants | Dominica | 0.0 /100 | #311 | Tragic 7.1% |
| Immigrants | Armenia | 0.0 /100 | #312 | Tragic 7.1% |
| Immigrants | St. Vincent and the Grenadines | 0.0 /100 | #313 | Tragic 7.1% |
| British West Indians | 0.0 /100 | #314 | Tragic 7.1% |
Demographics Similar to Dutch West Indians by Married-Couple Family Poverty
In terms of married-couple family poverty, the demographic groups most similar to Dutch West Indians are Ute (6.4%, a difference of 0.12%), Mexican American Indian (6.4%, a difference of 0.50%), Seminole (6.4%, a difference of 0.50%), Black/African American (6.5%, a difference of 0.51%), and Guyanese (6.5%, a difference of 0.61%).
| Demographics | Rating | Rank | Married-Couple Family Poverty |
| Indonesians | 0.1 /100 | #277 | Tragic 6.3% |
| Immigrants | Trinidad and Tobago | 0.1 /100 | #278 | Tragic 6.4% |
| Houma | 0.0 /100 | #279 | Tragic 6.4% |
| West Indians | 0.0 /100 | #280 | Tragic 6.4% |
| Mexican American Indians | 0.0 /100 | #281 | Tragic 6.4% |
| Seminole | 0.0 /100 | #282 | Tragic 6.4% |
| Ute | 0.0 /100 | #283 | Tragic 6.4% |
| Dutch West Indians | 0.0 /100 | #284 | Tragic 6.4% |
| Blacks/African Americans | 0.0 /100 | #285 | Tragic 6.5% |
| Guyanese | 0.0 /100 | #286 | Tragic 6.5% |
| Ecuadorians | 0.0 /100 | #287 | Tragic 6.5% |
| Salvadorans | 0.0 /100 | #288 | Tragic 6.5% |
| Nepalese | 0.0 /100 | #289 | Tragic 6.5% |
| Immigrants | Barbados | 0.0 /100 | #290 | Tragic 6.5% |
| Belizeans | 0.0 /100 | #291 | Tragic 6.5% |