Zip Codes with the Highest Percentage of Households with Income Above $200,000 in Brooklyn, NY
RELATED REPORTS & OPTIONS
Household Income | $200k+
Brooklyn
Compare Zip Codes
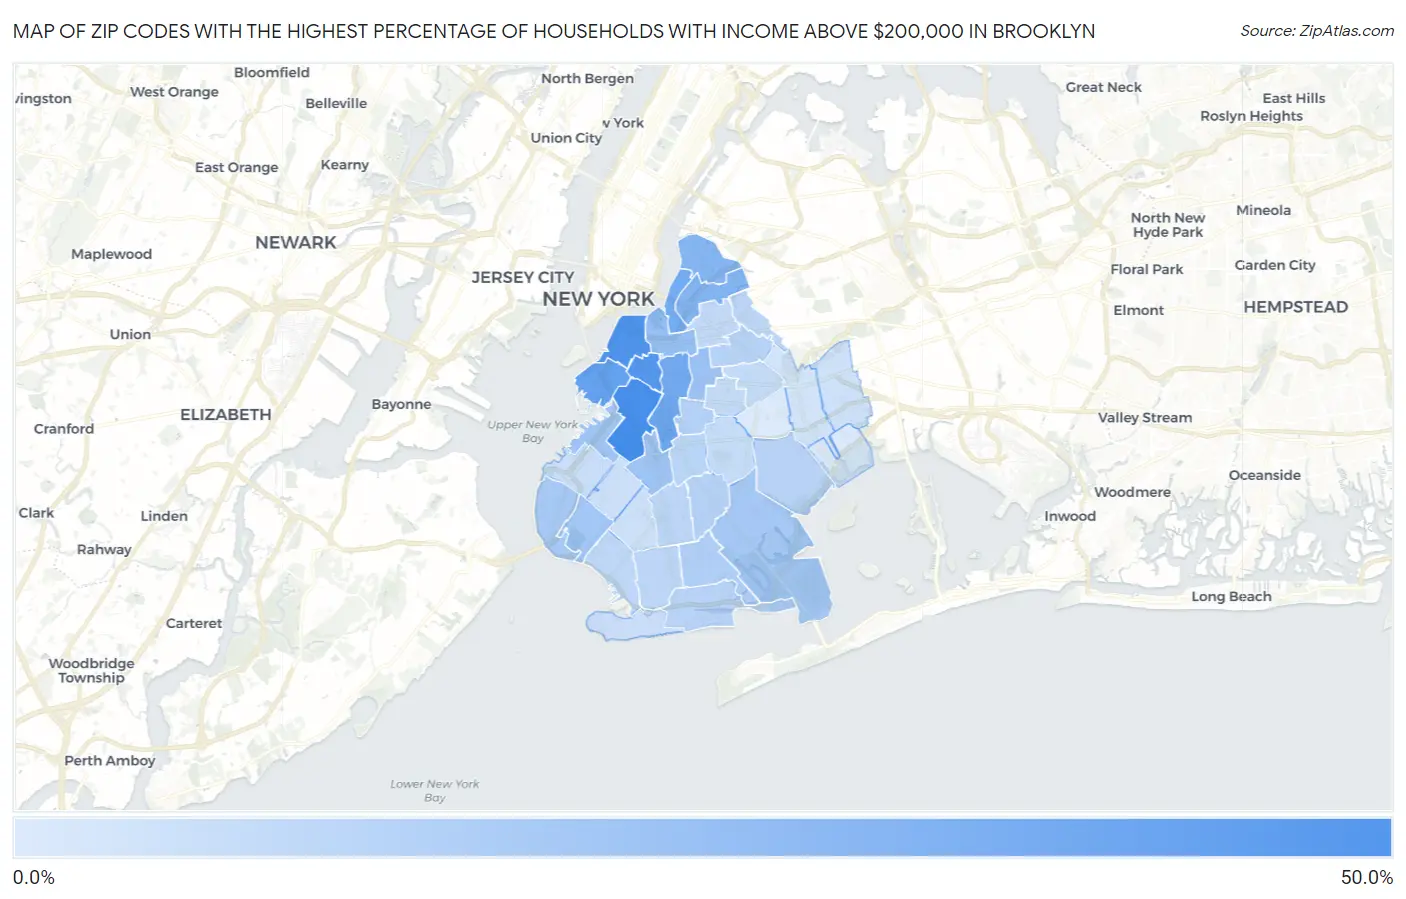
Map of Zip Codes with the Highest Percentage of Households with Income Above $200,000 in Brooklyn
2.5%
43.1%
Zip Codes with the Highest Percentage of Households with Income Above $200,000 in Brooklyn, NY
| Zip Code | Households with Income > $200k | vs State | vs National | |
| 1. | 11215 | 43.1% | 15.2%(+27.9)#59 | 11.4%(+31.7)#499 |
| 2. | 11201 | 40.7% | 15.2%(+25.5)#77 | 11.4%(+29.3)#613 |
| 3. | 11217 | 39.0% | 15.2%(+23.8)#93 | 11.4%(+27.6)#706 |
| 4. | 11231 | 33.6% | 15.2%(+18.4)#133 | 11.4%(+22.2)#1,100 |
| 5. | 11238 | 29.8% | 15.2%(+14.6)#179 | 11.4%(+18.4)#1,477 |
| 6. | 11249 | 29.3% | 15.2%(+14.1)#191 | 11.4%(+17.9)#1,545 |
| 7. | 11211 | 25.4% | 15.2%(+10.2)#248 | 11.4%(+14.0)#2,111 |
| 8. | 11222 | 24.3% | 15.2%(+9.10)#267 | 11.4%(+12.9)#2,313 |
| 9. | 11205 | 19.9% | 15.2%(+4.70)#353 | 11.4%(+8.50)#3,304 |
| 10. | 11216 | 18.4% | 15.2%(+3.20)#386 | 11.4%(+7.00)#3,720 |
| 11. | 11218 | 18.0% | 15.2%(+2.80)#391 | 11.4%(+6.60)#3,836 |
| 12. | 11232 | 17.0% | 15.2%(+1.80)#417 | 11.4%(+5.60)#4,184 |
| 13. | 11228 | 16.8% | 15.2%(+1.60)#419 | 11.4%(+5.40)#4,246 |
| 14. | 11209 | 16.2% | 15.2%(+1.00)#437 | 11.4%(+4.80)#4,476 |
| 15. | 11234 | 16.1% | 15.2%(+0.900)#441 | 11.4%(+4.70)#4,508 |
| 16. | 11229 | 12.8% | 15.2%(-2.40)#577 | 11.4%(+1.40)#6,113 |
| 17. | 11225 | 12.5% | 15.2%(-2.70)#590 | 11.4%(+1.10)#6,321 |
| 18. | 11210 | 12.1% | 15.2%(-3.10)#610 | 11.4%(+0.700)#6,586 |
| 19. | 11221 | 11.7% | 15.2%(-3.50)#623 | 11.4%(+0.300)#6,843 |
| 20. | 11235 | 11.5% | 15.2%(-3.70)#636 | 11.4%(+0.100)#7,002 |
| 21. | 11236 | 11.2% | 15.2%(-4.00)#646 | 11.4%(-0.200)#7,214 |
| 22. | 11226 | 10.8% | 15.2%(-4.40)#672 | 11.4%(-0.600)#7,525 |
| 23. | 11230 | 10.4% | 15.2%(-4.80)#691 | 11.4%(-1.000)#7,855 |
| 24. | 11223 | 10.0% | 15.2%(-5.20)#712 | 11.4%(-1.40)#8,230 |
| 25. | 11237 | 10.0% | 15.2%(-5.20)#713 | 11.4%(-1.40)#8,238 |
| 26. | 11214 | 9.4% | 15.2%(-5.80)#749 | 11.4%(-2.00)#8,815 |
| 27. | 11206 | 8.9% | 15.2%(-6.30)#782 | 11.4%(-2.50)#9,304 |
| 28. | 11233 | 8.4% | 15.2%(-6.80)#815 | 11.4%(-3.00)#9,847 |
| 29. | 11213 | 8.2% | 15.2%(-7.00)#823 | 11.4%(-3.20)#10,098 |
| 30. | 11203 | 7.9% | 15.2%(-7.30)#843 | 11.4%(-3.50)#10,470 |
| 31. | 11220 | 7.1% | 15.2%(-8.10)#906 | 11.4%(-4.30)#11,614 |
| 32. | 11224 | 7.0% | 15.2%(-8.20)#915 | 11.4%(-4.40)#11,744 |
| 33. | 11219 | 6.1% | 15.2%(-9.10)#991 | 11.4%(-5.30)#13,229 |
| 34. | 11204 | 6.1% | 15.2%(-9.10)#992 | 11.4%(-5.30)#13,230 |
| 35. | 11208 | 5.9% | 15.2%(-9.30)#1,013 | 11.4%(-5.50)#13,613 |
| 36. | 11207 | 5.2% | 15.2%(-10.00)#1,073 | 11.4%(-6.20)#15,057 |
| 37. | 11239 | 2.9% | 15.2%(-12.3)#1,342 | 11.4%(-8.50)#21,181 |
| 38. | 11212 | 2.5% | 15.2%(-12.7)#1,378 | 11.4%(-8.90)#22,302 |
1
Common Questions
What are the Top 10 Zip Codes with the Highest Percentage of Households with Income Above $200,000 in Brooklyn, NY?
Top 10 Zip Codes with the Highest Percentage of Households with Income Above $200,000 in Brooklyn, NY are:
What zip code has the Highest Percentage of Households with Income Above $200,000 in Brooklyn, NY?
11215 has the Highest Percentage of Households with Income Above $200,000 in Brooklyn, NY with 43.1%.
What is the Percentage of Households with Income Above $200,000 in New York?
Percentage of Households with Income Above $200,000 in New York is 15.2%.
What is the Percentage of Households with Income Above $200,000 in the United States?
Percentage of Households with Income Above $200,000 in the United States is 11.4%.