Zip Codes with the Highest Percentage of Population Employed in Architecture & Engineering in Pahrump, NV
RELATED REPORTS & OPTIONS
Architecture & Engineering
Pahrump
Compare Zip Codes
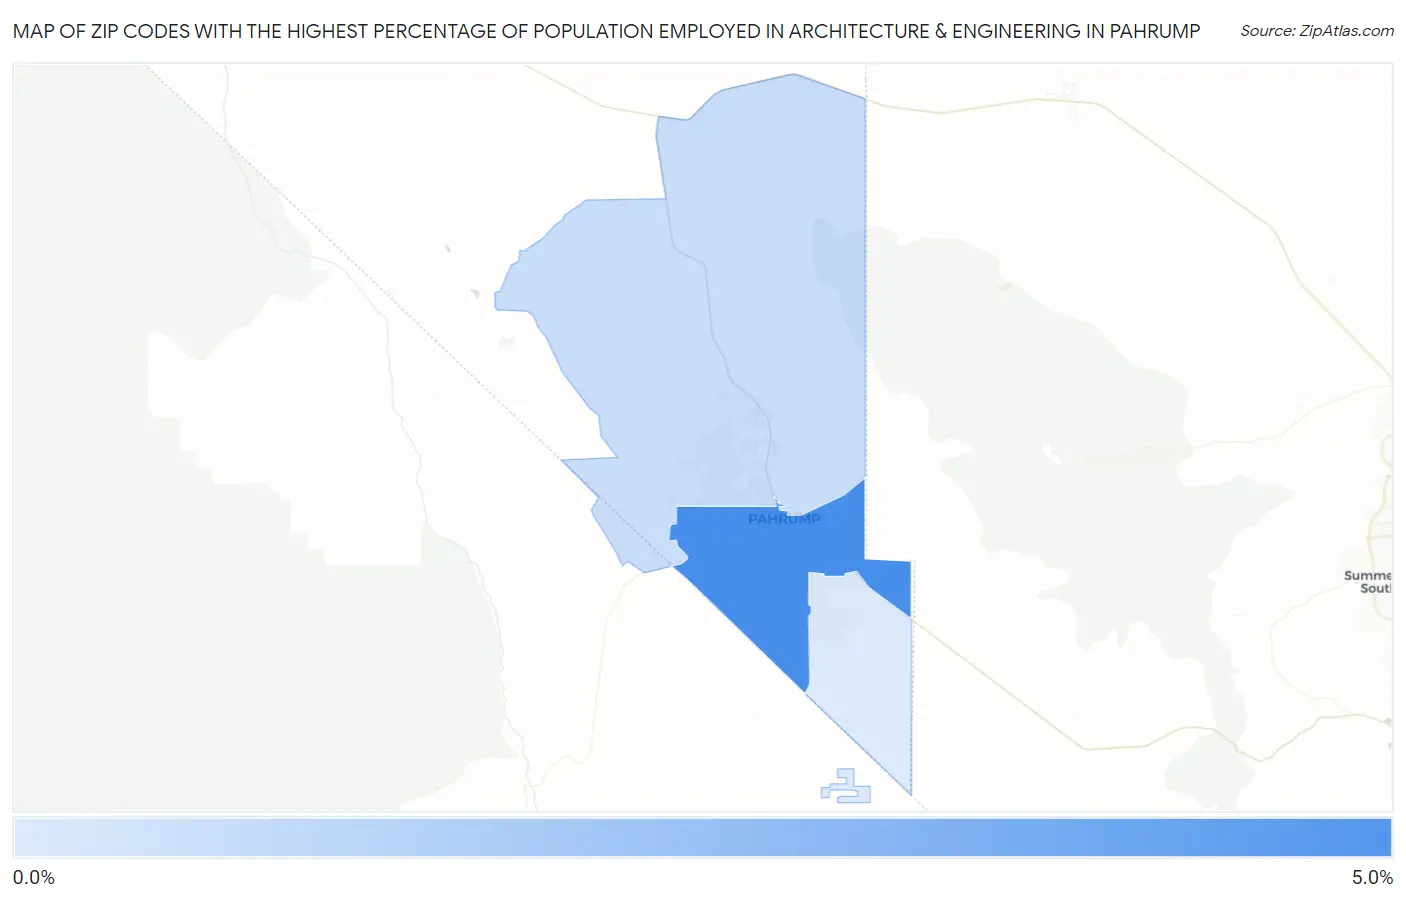
Map of Zip Codes with the Highest Percentage of Population Employed in Architecture & Engineering in Pahrump
0.71%
5.0%
Zip Codes with the Highest Percentage of Population Employed in Architecture & Engineering in Pahrump, NV
| Zip Code | % Employed | vs State | vs National | |
| 1. | 89048 | 5.0% | 1.5%(+3.47)#10 | 2.1%(+2.80)#1,694 |
| 2. | 89060 | 1.3% | 1.5%(-0.193)#62 | 2.1%(-0.857)#14,368 |
| 3. | 89061 | 0.71% | 1.5%(-0.771)#87 | 2.1%(-1.43)#18,791 |
1
Common Questions
What are the Top Zip Codes with the Highest Percentage of Population Employed in Architecture & Engineering in Pahrump, NV?
Top Zip Codes with the Highest Percentage of Population Employed in Architecture & Engineering in Pahrump, NV are:
What zip code has the Highest Percentage of Population Employed in Architecture & Engineering in Pahrump, NV?
89048 has the Highest Percentage of Population Employed in Architecture & Engineering in Pahrump, NV with 5.0%.
What is the Percentage of Population Employed in Architecture & Engineering in Pahrump, NV?
Percentage of Population Employed in Architecture & Engineering in Pahrump is 3.3%.
What is the Percentage of Population Employed in Architecture & Engineering in Nevada?
Percentage of Population Employed in Architecture & Engineering in Nevada is 1.5%.
What is the Percentage of Population Employed in Architecture & Engineering in the United States?
Percentage of Population Employed in Architecture & Engineering in the United States is 2.1%.