Zip Codes with the Highest Percentage of Households with Income Above $100,000 in O Fallon, MO
RELATED REPORTS & OPTIONS
Household Income | $100k+
O Fallon
Compare Zip Codes
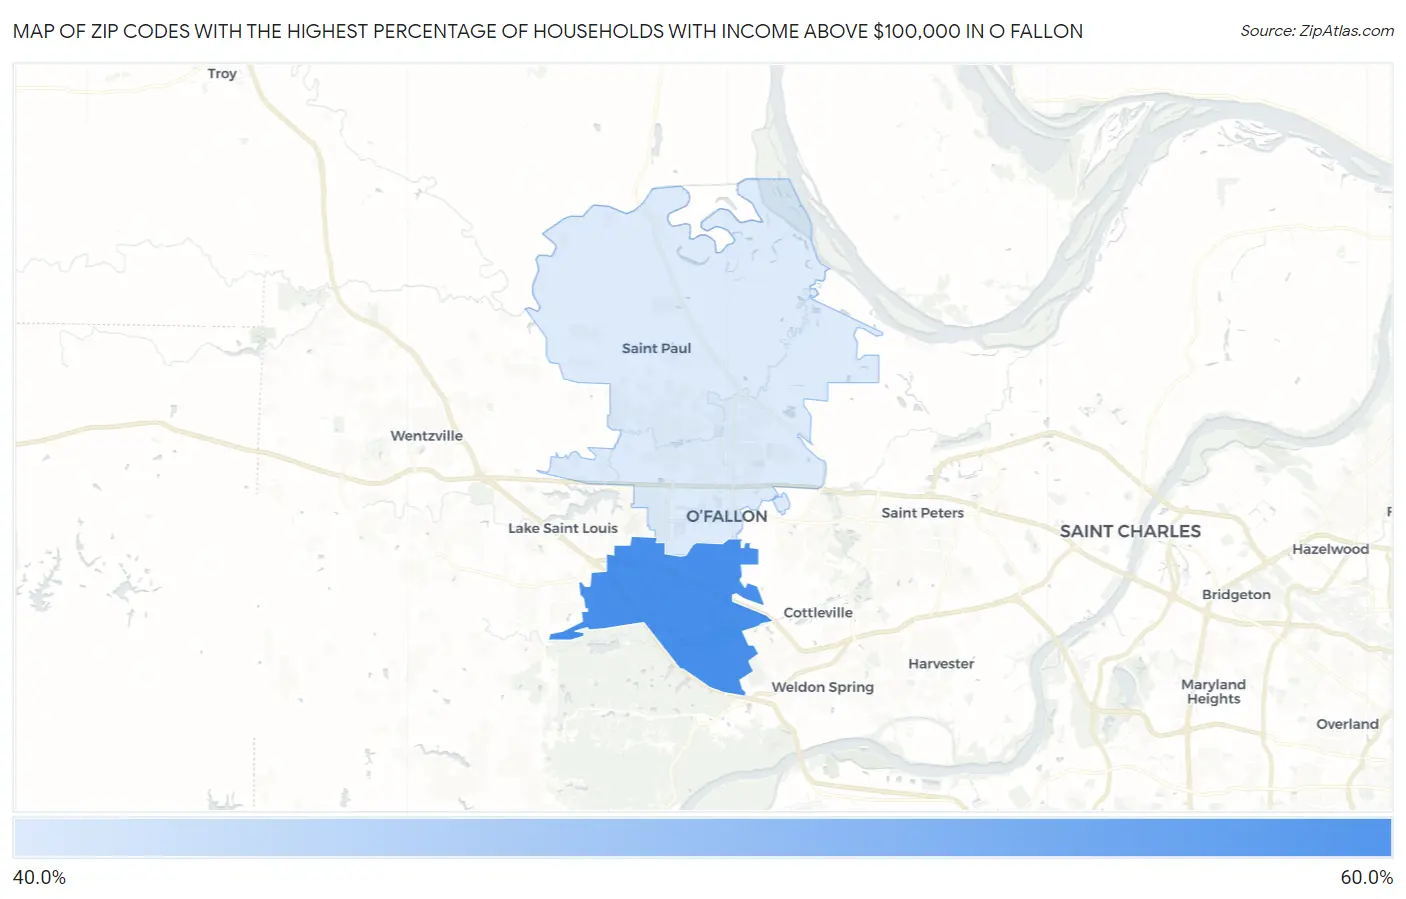
Map of Zip Codes with the Highest Percentage of Households with Income Above $100,000 in O Fallon
45.1%
57.4%
Zip Codes with the Highest Percentage of Households with Income Above $100,000 in O Fallon, MO
| Zip Code | Households with Income > $100k | vs State | vs National | |
| 1. | 63368 | 57.4% | 30.6%(+26.8)#32 | 37.3%(+20.1)#2,886 |
| 2. | 63366 | 45.1% | 30.6%(+14.5)#85 | 37.3%(+7.80)#6,569 |
1
Common Questions
What are the Top Zip Codes with the Highest Percentage of Households with Income Above $100,000 in O Fallon, MO?
Top Zip Codes with the Highest Percentage of Households with Income Above $100,000 in O Fallon, MO are:
What zip code has the Highest Percentage of Households with Income Above $100,000 in O Fallon, MO?
63368 has the Highest Percentage of Households with Income Above $100,000 in O Fallon, MO with 57.4%.
What is the Percentage of Households with Income Above $100,000 in O Fallon, MO?
Percentage of Households with Income Above $100,000 in O Fallon is 52.1%.
What is the Percentage of Households with Income Above $100,000 in Missouri?
Percentage of Households with Income Above $100,000 in Missouri is 30.6%.
What is the Percentage of Households with Income Above $100,000 in the United States?
Percentage of Households with Income Above $100,000 in the United States is 37.3%.