Zip Codes with the Highest Percentage of Immigrants from Northern Europe in O Fallon, MO
RELATED REPORTS & OPTIONS
Northern Europe
O Fallon
Compare Zip Codes
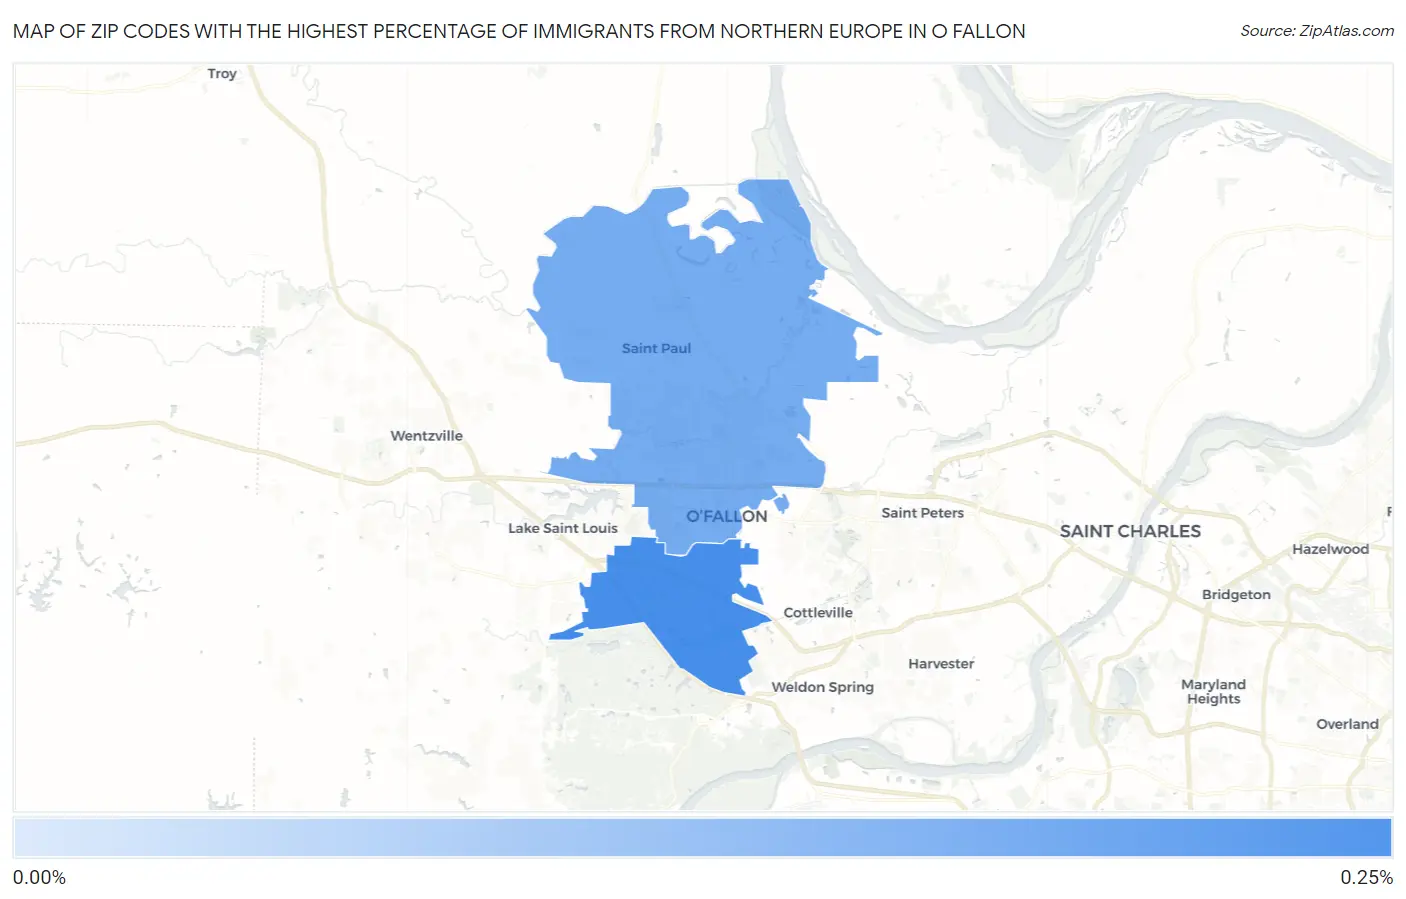
Map of Zip Codes with the Highest Percentage of Immigrants from Northern Europe in O Fallon
0.14%
0.20%
Zip Codes with the Highest Percentage of Immigrants from Northern Europe in O Fallon, MO
| Zip Code | Northern Europe | vs State | vs National | |
| 1. | 63368 | 0.20% | 0.11%(+0.098)#87 | 0.29%(-0.082)#7,729 |
| 2. | 63366 | 0.14% | 0.11%(+0.037)#117 | 0.29%(-0.143)#9,209 |
1
Common Questions
What are the Top Zip Codes with the Highest Percentage of Immigrants from Northern Europe in O Fallon, MO?
Top Zip Codes with the Highest Percentage of Immigrants from Northern Europe in O Fallon, MO are:
What zip code has the Highest Percentage of Immigrants from Northern Europe in O Fallon, MO?
63368 has the Highest Percentage of Immigrants from Northern Europe in O Fallon, MO with 0.20%.
What is the Percentage of Immigrants from Northern Europe in O Fallon, MO?
Percentage of Immigrants from Northern Europe in O Fallon is 0.17%.
What is the Percentage of Immigrants from Northern Europe in Missouri?
Percentage of Immigrants from Northern Europe in Missouri is 0.11%.
What is the Percentage of Immigrants from Northern Europe in the United States?
Percentage of Immigrants from Northern Europe in the United States is 0.29%.