Zip Codes with the Highest Percentage of Households With Two or more Vehicles in O Fallon, MO
RELATED REPORTS & OPTIONS
Households with 2 or more Cars
O Fallon
Compare Zip Codes
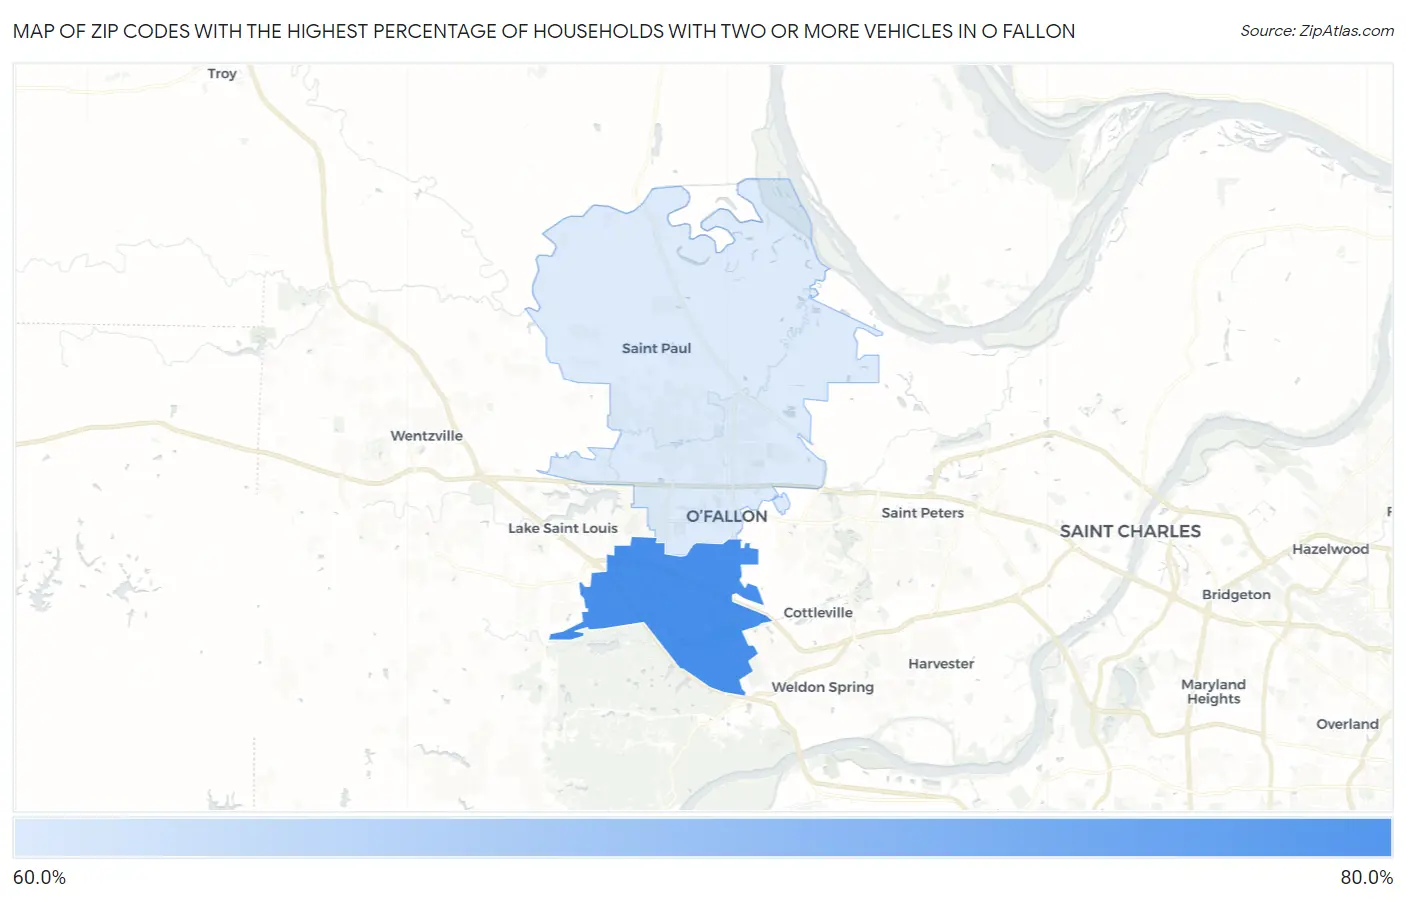
Map of Zip Codes with the Highest Percentage of Households With Two or more Vehicles in O Fallon
69.8%
73.9%
Zip Codes with the Highest Percentage of Households With Two or more Vehicles in O Fallon, MO
| Zip Code | Housholds With 2+ Cars | vs State | vs National | |
| 1. | 63368 | 73.9% | 60.8%(+13.1)#359 | 59.1%(+14.8)#9,926 |
| 2. | 63366 | 69.8% | 60.8%(+9.00)#468 | 59.1%(+10.7)#13,857 |
1
Common Questions
What are the Top Zip Codes with the Highest Percentage of Households With Two or more Vehicles in O Fallon, MO?
Top Zip Codes with the Highest Percentage of Households With Two or more Vehicles in O Fallon, MO are:
What zip code has the Highest Percentage of Households With Two or more Vehicles in O Fallon, MO?
63368 has the Highest Percentage of Households With Two or more Vehicles in O Fallon, MO with 73.9%.
What is the Percentage of Households With Two or more Vehicles in O Fallon, MO?
Percentage of Households With Two or more Vehicles in O Fallon is 71.4%.
What is the Percentage of Households With Two or more Vehicles in Missouri?
Percentage of Households With Two or more Vehicles in Missouri is 60.8%.
What is the Percentage of Households With Two or more Vehicles in the United States?
Percentage of Households With Two or more Vehicles in the United States is 59.1%.