Zip Codes with the Highest Percentage of Households Heated by Electricity in O Fallon, MO
RELATED REPORTS & OPTIONS
Electrical Heating
O Fallon
Compare Zip Codes
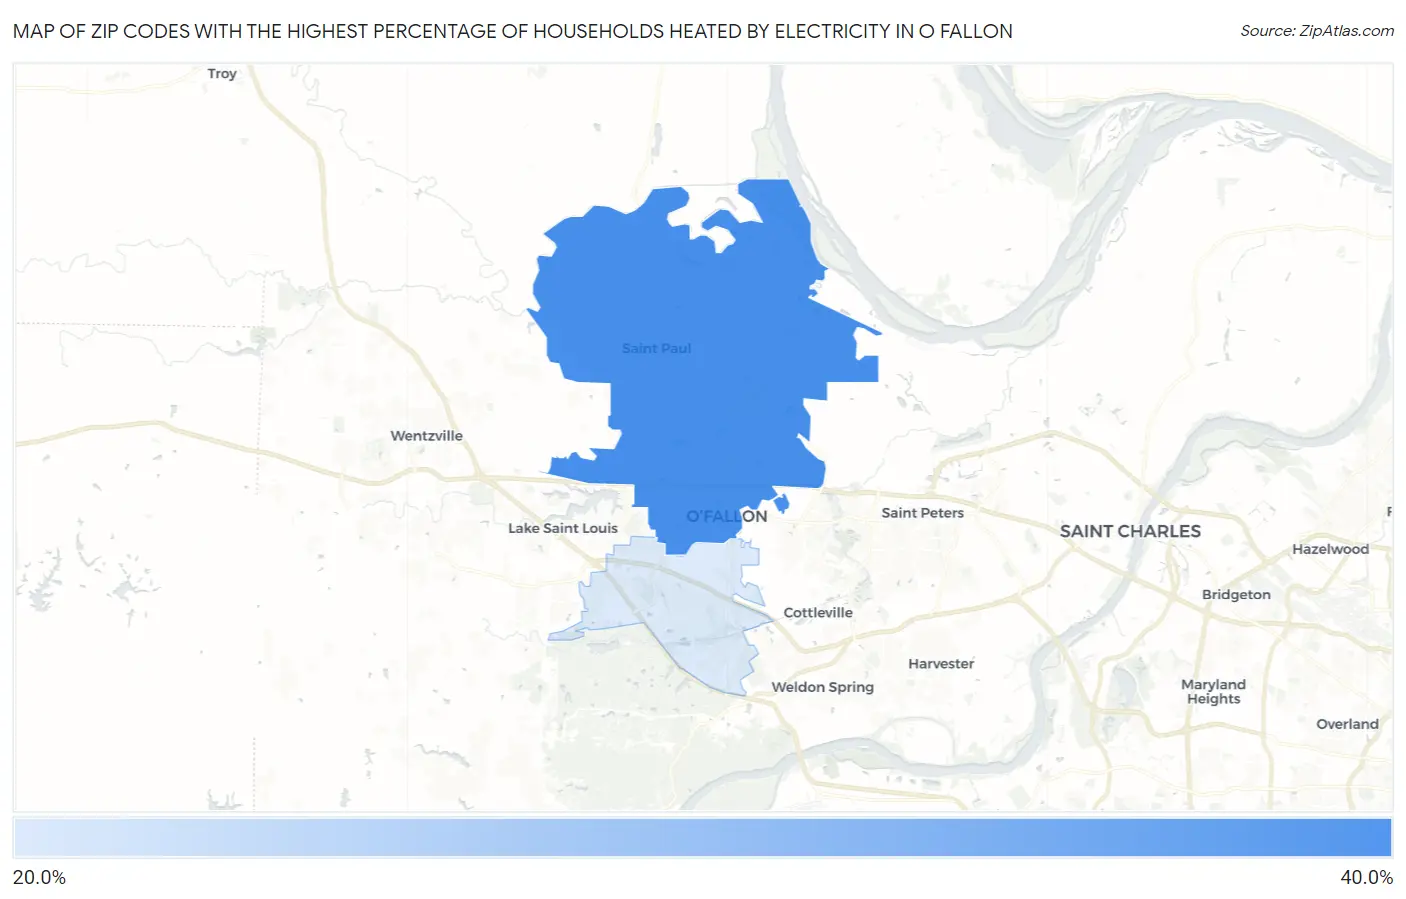
Map of Zip Codes with the Highest Percentage of Households Heated by Electricity in O Fallon
25.2%
30.5%
Zip Codes with the Highest Percentage of Households Heated by Electricity in O Fallon, MO
| Zip Code | Electrical Heating | vs State | vs National | |
| 1. | 63366 | 30.5% | 37.7%(-7.20)#689 | 40.2%(-9.70)#15,756 |
| 2. | 63368 | 25.2% | 37.7%(-12.5)#812 | 40.2%(-15.0)#17,958 |
1
Common Questions
What are the Top Zip Codes with the Highest Percentage of Households Heated by Electricity in O Fallon, MO?
Top Zip Codes with the Highest Percentage of Households Heated by Electricity in O Fallon, MO are:
What zip code has the Highest Percentage of Households Heated by Electricity in O Fallon, MO?
63366 has the Highest Percentage of Households Heated by Electricity in O Fallon, MO with 30.5%.
What is the Percentage of Households Heated by Electricity in O Fallon, MO?
Percentage of Households Heated by Electricity in O Fallon is 26.6%.
What is the Percentage of Households Heated by Electricity in Missouri?
Percentage of Households Heated by Electricity in Missouri is 37.7%.
What is the Percentage of Households Heated by Electricity in the United States?
Percentage of Households Heated by Electricity in the United States is 40.2%.