Zip Codes with the Highest Percentage of Population Employed in Agriculture, Fishing & Hunting in O Fallon, MO
RELATED REPORTS & OPTIONS
Agriculture, Fishing & Hunting
O Fallon
Compare Zip Codes
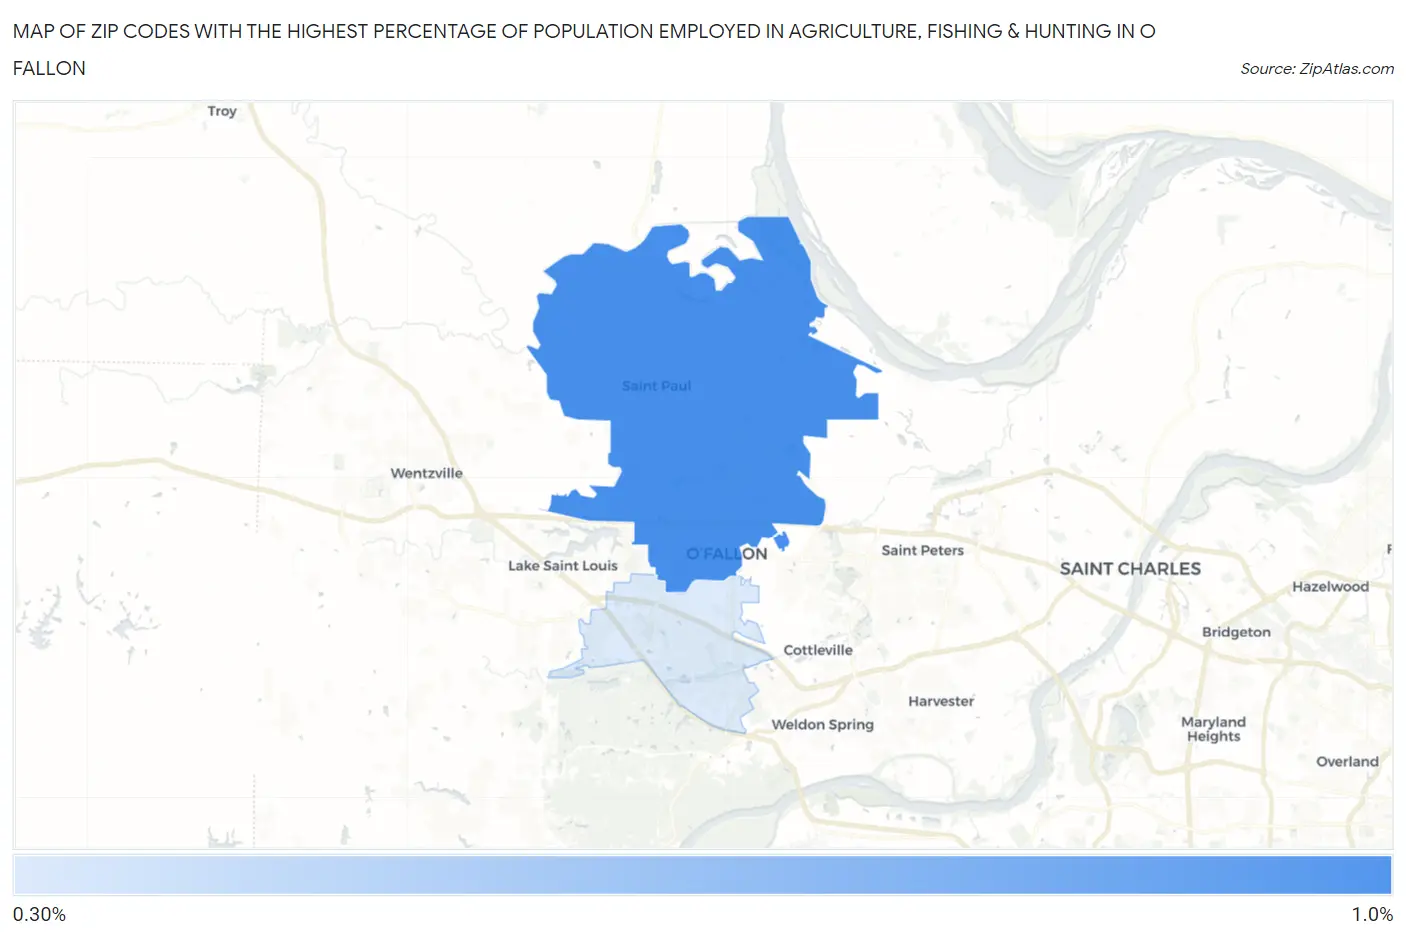
Map of Zip Codes with the Highest Percentage of Population Employed in Agriculture, Fishing & Hunting in O Fallon
0.40%
0.88%
Zip Codes with the Highest Percentage of Population Employed in Agriculture, Fishing & Hunting in O Fallon, MO
| Zip Code | % Employed | vs State | vs National | |
| 1. | 63366 | 0.88% | 1.4%(-0.560)#639 | 1.2%(-0.315)#16,795 |
| 2. | 63368 | 0.40% | 1.4%(-1.04)#729 | 1.2%(-0.800)#20,162 |
1
Common Questions
What are the Top Zip Codes with the Highest Percentage of Population Employed in Agriculture, Fishing & Hunting in O Fallon, MO?
Top Zip Codes with the Highest Percentage of Population Employed in Agriculture, Fishing & Hunting in O Fallon, MO are:
What zip code has the Highest Percentage of Population Employed in Agriculture, Fishing & Hunting in O Fallon, MO?
63366 has the Highest Percentage of Population Employed in Agriculture, Fishing & Hunting in O Fallon, MO with 0.88%.
What is the Percentage of Population Employed in Agriculture, Fishing & Hunting in O Fallon, MO?
Percentage of Population Employed in Agriculture, Fishing & Hunting in O Fallon is 0.36%.
What is the Percentage of Population Employed in Agriculture, Fishing & Hunting in Missouri?
Percentage of Population Employed in Agriculture, Fishing & Hunting in Missouri is 1.4%.
What is the Percentage of Population Employed in Agriculture, Fishing & Hunting in the United States?
Percentage of Population Employed in Agriculture, Fishing & Hunting in the United States is 1.2%.