Zip Codes with the Highest Percentage of Population Employed in Transportation & Warehousing in O Fallon, MO
RELATED REPORTS & OPTIONS
Transportation & Warehousing
O Fallon
Compare Zip Codes
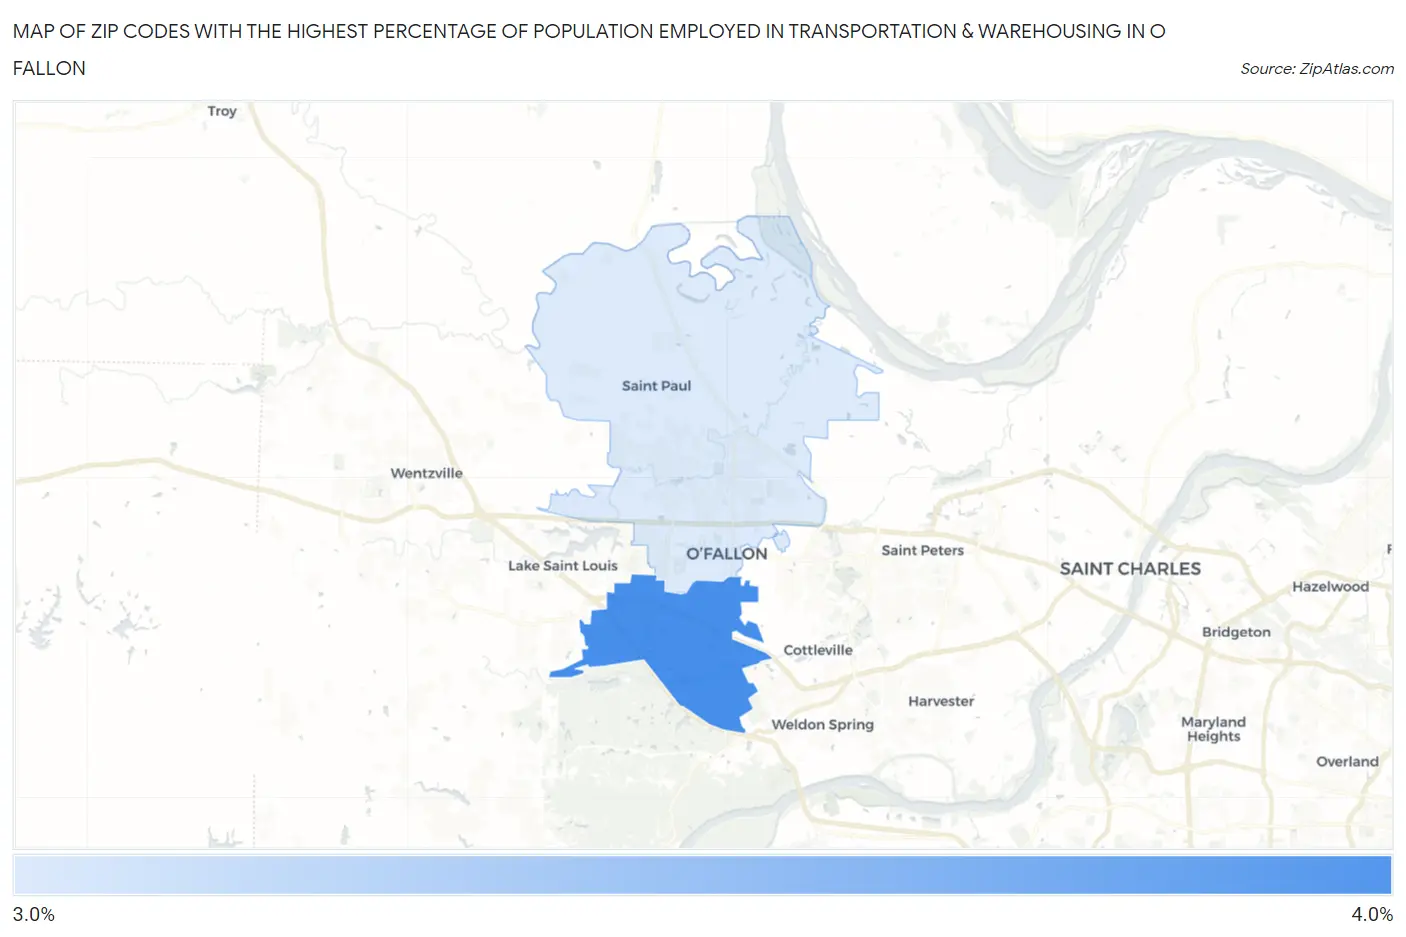
Map of Zip Codes with the Highest Percentage of Population Employed in Transportation & Warehousing in O Fallon
3.6%
3.7%
Zip Codes with the Highest Percentage of Population Employed in Transportation & Warehousing in O Fallon, MO
| Zip Code | % Employed | vs State | vs National | |
| 1. | 63368 | 3.7% | 5.0%(-1.30)#584 | 4.9%(-1.28)#17,335 |
| 2. | 63366 | 3.6% | 5.0%(-1.40)#598 | 4.9%(-1.37)#17,757 |
1
Common Questions
What are the Top Zip Codes with the Highest Percentage of Population Employed in Transportation & Warehousing in O Fallon, MO?
Top Zip Codes with the Highest Percentage of Population Employed in Transportation & Warehousing in O Fallon, MO are:
What zip code has the Highest Percentage of Population Employed in Transportation & Warehousing in O Fallon, MO?
63368 has the Highest Percentage of Population Employed in Transportation & Warehousing in O Fallon, MO with 3.7%.
What is the Percentage of Population Employed in Transportation & Warehousing in O Fallon, MO?
Percentage of Population Employed in Transportation & Warehousing in O Fallon is 3.4%.
What is the Percentage of Population Employed in Transportation & Warehousing in Missouri?
Percentage of Population Employed in Transportation & Warehousing in Missouri is 5.0%.
What is the Percentage of Population Employed in Transportation & Warehousing in the United States?
Percentage of Population Employed in Transportation & Warehousing in the United States is 4.9%.