Zip Codes with the Highest Percentage of Households With One or more Vehicles in O Fallon, MO
RELATED REPORTS & OPTIONS
Households with 1 or more Cars
O Fallon
Compare Zip Codes
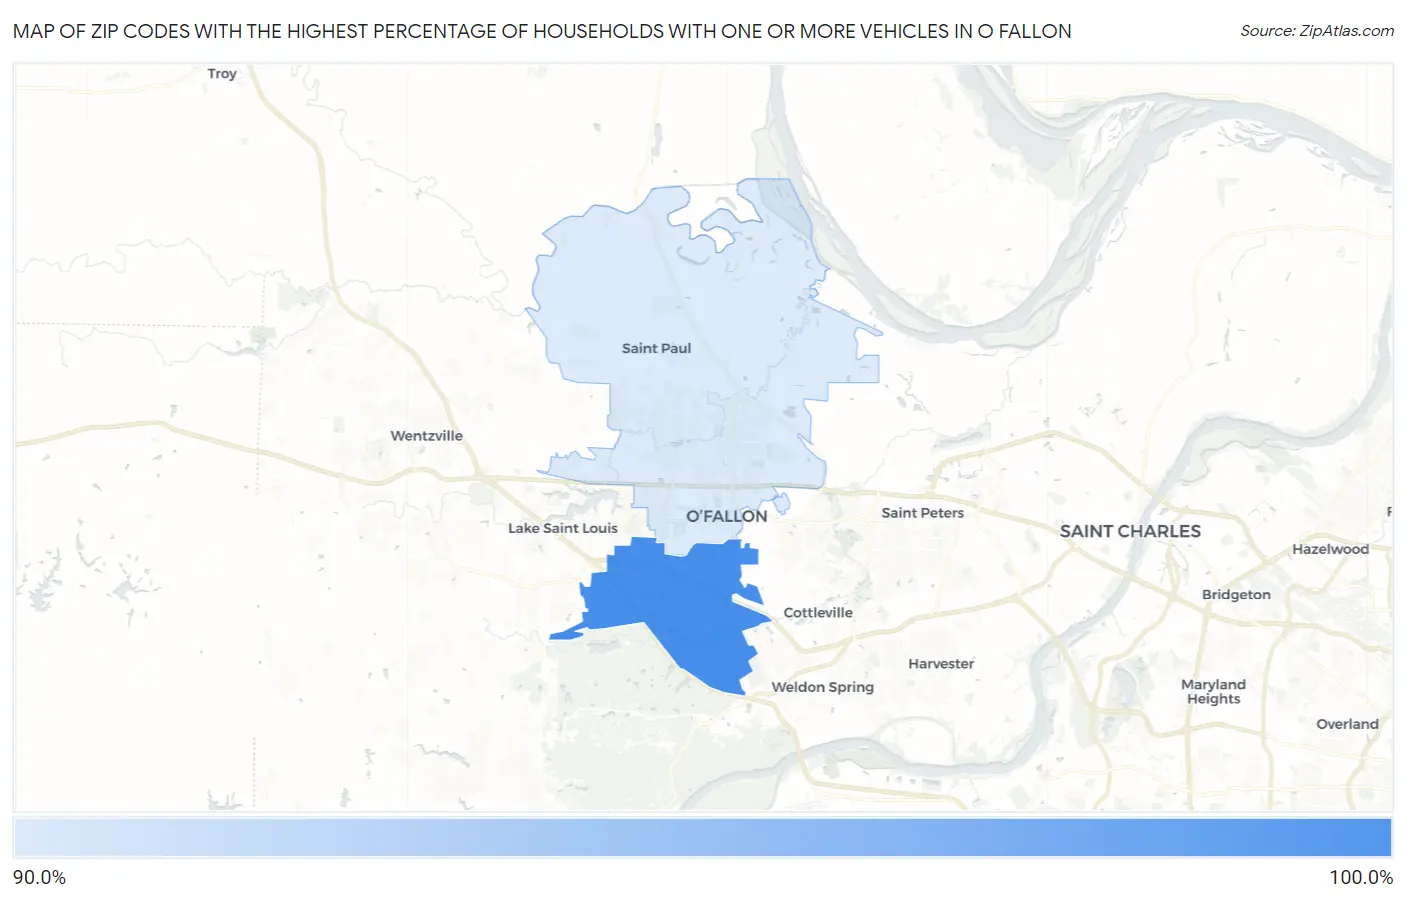
Map of Zip Codes with the Highest Percentage of Households With One or more Vehicles in O Fallon
95.9%
96.2%
Zip Codes with the Highest Percentage of Households With One or more Vehicles in O Fallon, MO
| Zip Code | Housholds With 1+ Cars | vs State | vs National | |
| 1. | 63368 | 96.2% | 93.4%(+2.80)#490 | 91.7%(+4.50)#16,225 |
| 2. | 63366 | 95.9% | 93.4%(+2.50)#520 | 91.7%(+4.20)#17,174 |
1
Common Questions
What are the Top Zip Codes with the Highest Percentage of Households With One or more Vehicles in O Fallon, MO?
Top Zip Codes with the Highest Percentage of Households With One or more Vehicles in O Fallon, MO are:
What zip code has the Highest Percentage of Households With One or more Vehicles in O Fallon, MO?
63368 has the Highest Percentage of Households With One or more Vehicles in O Fallon, MO with 96.2%.
What is the Percentage of Households With One or more Vehicles in O Fallon, MO?
Percentage of Households With One or more Vehicles in O Fallon is 95.1%.
What is the Percentage of Households With One or more Vehicles in Missouri?
Percentage of Households With One or more Vehicles in Missouri is 93.4%.
What is the Percentage of Households With One or more Vehicles in the United States?
Percentage of Households With One or more Vehicles in the United States is 91.7%.