Zip Codes with the Highest Percentage of Population Employed in Sales & Related in O Fallon, MO
RELATED REPORTS & OPTIONS
Sales & Related
O Fallon
Compare Zip Codes
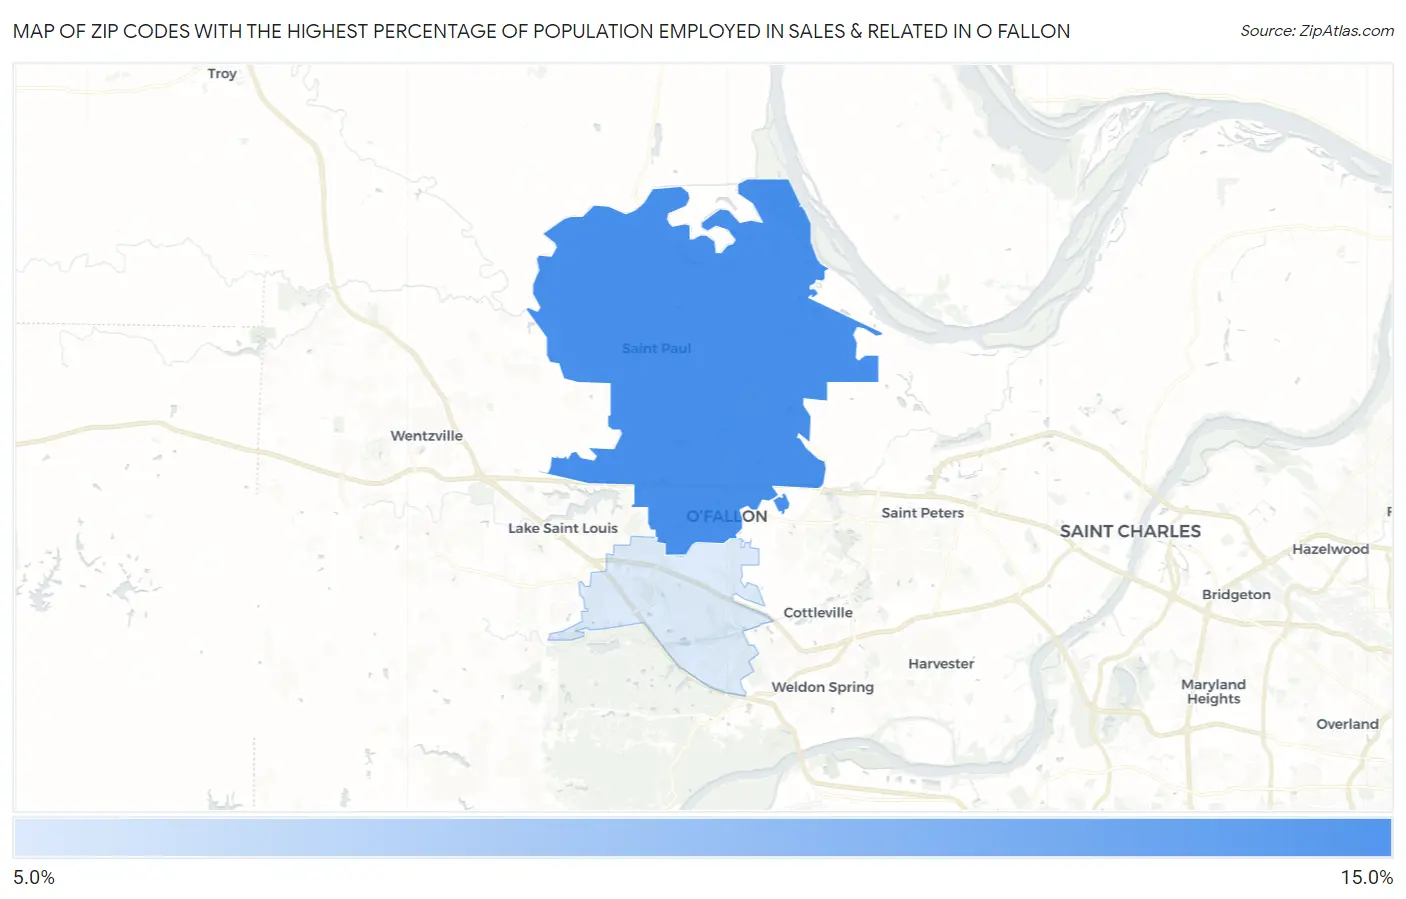
Map of Zip Codes with the Highest Percentage of Population Employed in Sales & Related in O Fallon
11.1%
12.5%
Zip Codes with the Highest Percentage of Population Employed in Sales & Related in O Fallon, MO
| Zip Code | % Employed | vs State | vs National | |
| 1. | 63366 | 12.5% | 9.7%(+2.79)#179 | 9.6%(+2.87)#5,218 |
| 2. | 63368 | 11.1% | 9.7%(+1.46)#246 | 9.6%(+1.55)#7,837 |
1
Common Questions
What are the Top Zip Codes with the Highest Percentage of Population Employed in Sales & Related in O Fallon, MO?
Top Zip Codes with the Highest Percentage of Population Employed in Sales & Related in O Fallon, MO are:
What zip code has the Highest Percentage of Population Employed in Sales & Related in O Fallon, MO?
63366 has the Highest Percentage of Population Employed in Sales & Related in O Fallon, MO with 12.5%.
What is the Percentage of Population Employed in Sales & Related in O Fallon, MO?
Percentage of Population Employed in Sales & Related in O Fallon is 11.7%.
What is the Percentage of Population Employed in Sales & Related in Missouri?
Percentage of Population Employed in Sales & Related in Missouri is 9.7%.
What is the Percentage of Population Employed in Sales & Related in the United States?
Percentage of Population Employed in Sales & Related in the United States is 9.6%.