Zip Codes with the Highest Percentage of Population Employed in Farming, Fishing & Forestry in O Fallon, MO
RELATED REPORTS & OPTIONS
Farming, Fishing & Forestry
O Fallon
Compare Zip Codes
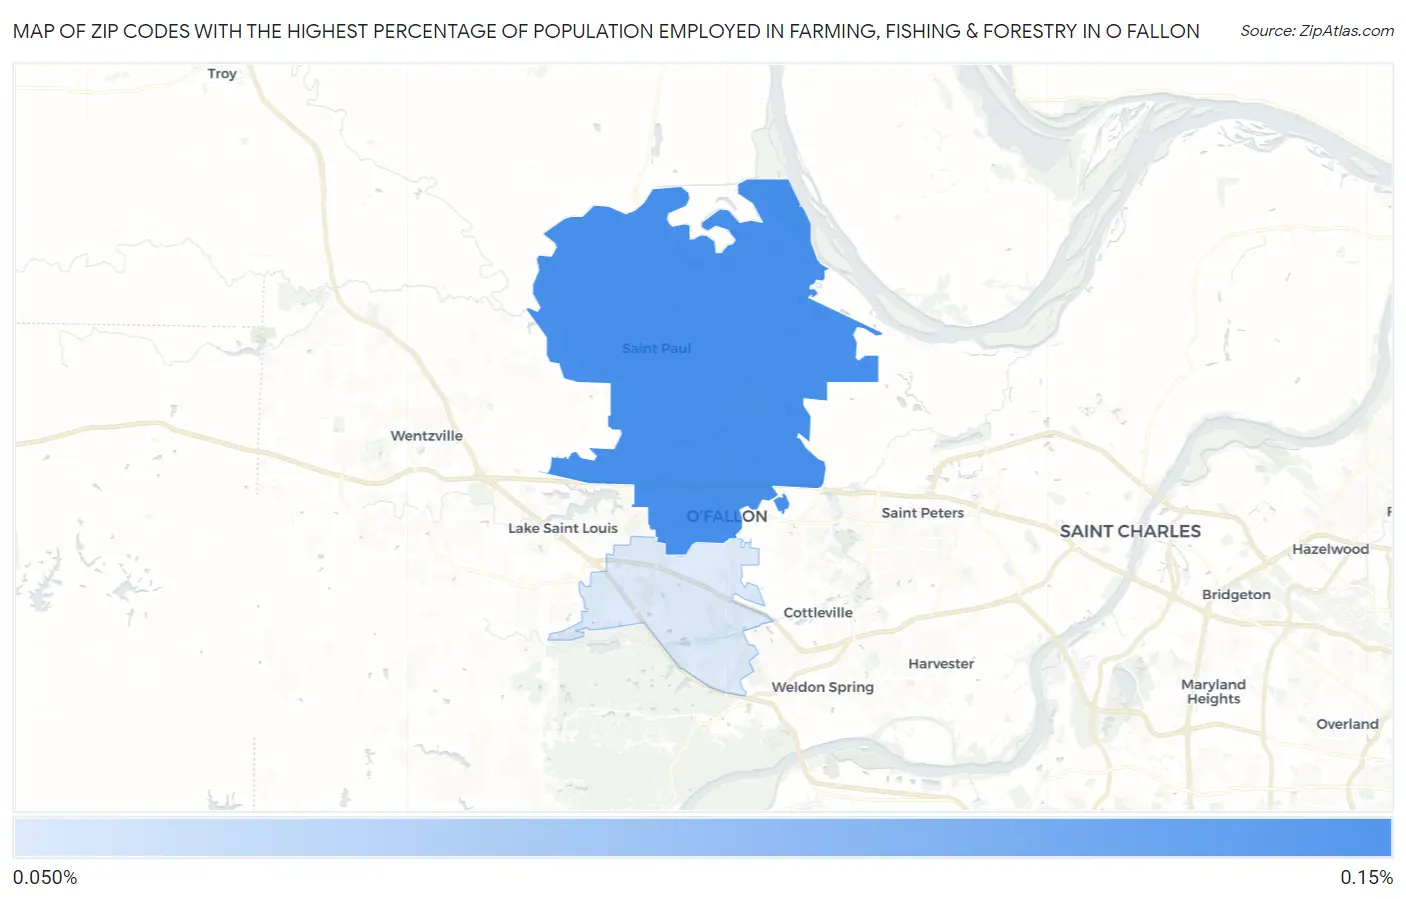
Map of Zip Codes with the Highest Percentage of Population Employed in Farming, Fishing & Forestry in O Fallon
0.070%
0.12%
Zip Codes with the Highest Percentage of Population Employed in Farming, Fishing & Forestry in O Fallon, MO
| Zip Code | % Employed | vs State | vs National | |
| 1. | 63366 | 0.12% | 0.49%(-0.368)#559 | 0.61%(-0.484)#17,401 |
| 2. | 63368 | 0.070% | 0.49%(-0.420)#584 | 0.61%(-0.536)#18,303 |
1
Common Questions
What are the Top Zip Codes with the Highest Percentage of Population Employed in Farming, Fishing & Forestry in O Fallon, MO?
Top Zip Codes with the Highest Percentage of Population Employed in Farming, Fishing & Forestry in O Fallon, MO are:
What zip code has the Highest Percentage of Population Employed in Farming, Fishing & Forestry in O Fallon, MO?
63366 has the Highest Percentage of Population Employed in Farming, Fishing & Forestry in O Fallon, MO with 0.12%.
What is the Percentage of Population Employed in Farming, Fishing & Forestry in O Fallon, MO?
Percentage of Population Employed in Farming, Fishing & Forestry in O Fallon is 0.069%.
What is the Percentage of Population Employed in Farming, Fishing & Forestry in Missouri?
Percentage of Population Employed in Farming, Fishing & Forestry in Missouri is 0.49%.
What is the Percentage of Population Employed in Farming, Fishing & Forestry in the United States?
Percentage of Population Employed in Farming, Fishing & Forestry in the United States is 0.61%.