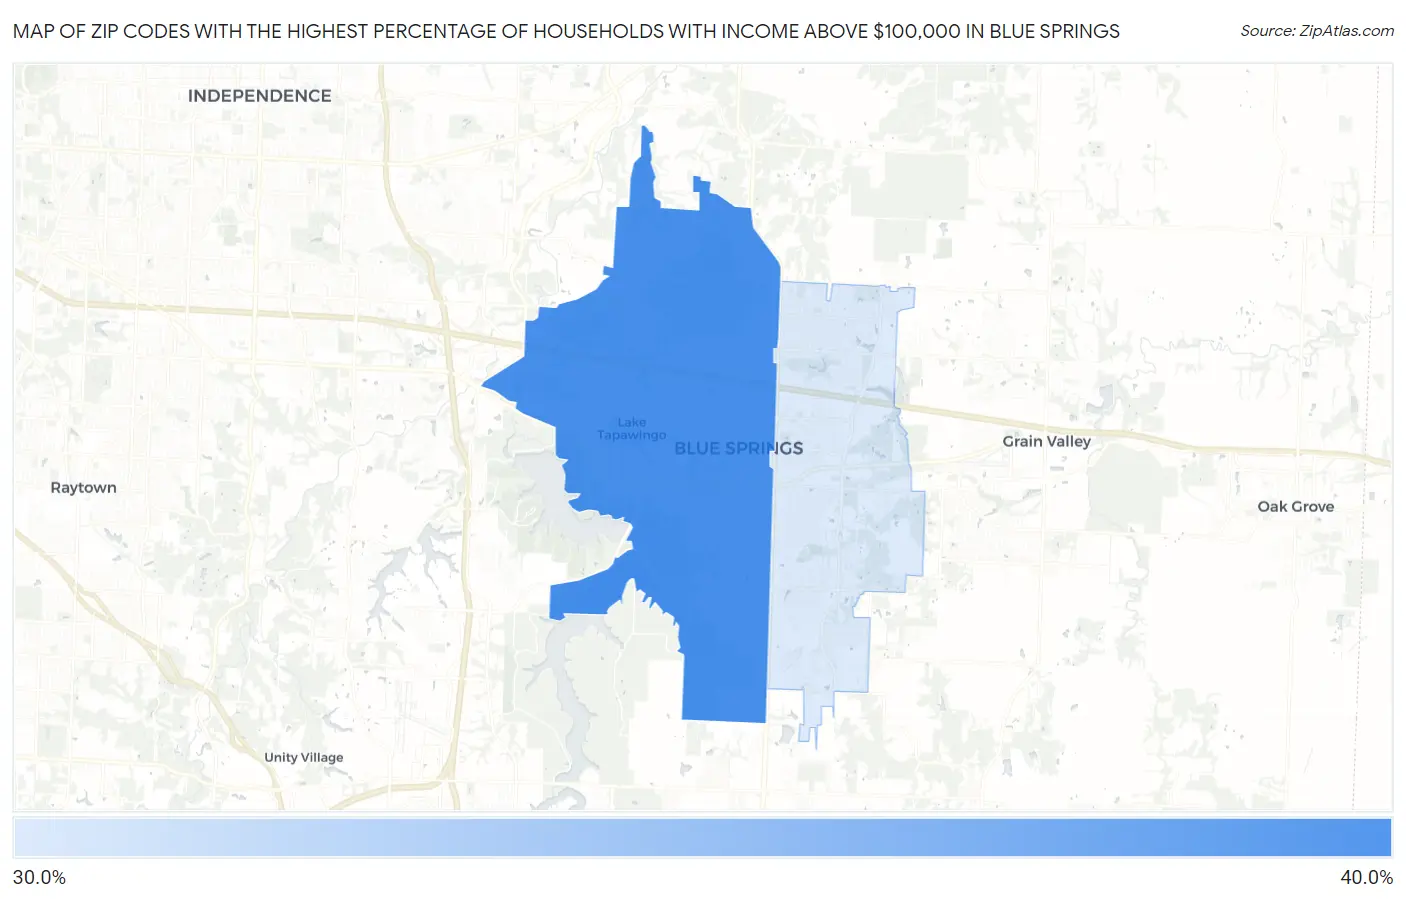
Zip Codes with the Highest Percentage of Households with Income Above $100,000 in Blue Springs, MO
RELATED REPORTS & OPTIONS
Household Income | $100k+
Blue Springs
Compare Zip Codes
Map of Zip Codes with the Highest Percentage of Households with Income Above $100,000 in Blue Springs
37.9%
39.7%
Zip Codes with the Highest Percentage of Households with Income Above $100,000 in Blue Springs, MO
| Zip Code | Households with Income > $100k | vs State | vs National | |
| 1. | 64015 | 39.7% | 30.6%(+9.10)#137 | 37.3%(+2.40)#9,063 |
| 2. | 64014 | 37.9% | 30.6%(+7.30)#161 | 37.3%(+0.600)#10,040 |
1
Common Questions
What are the Top Zip Codes with the Highest Percentage of Households with Income Above $100,000 in Blue Springs, MO?
Top Zip Codes with the Highest Percentage of Households with Income Above $100,000 in Blue Springs, MO are:
What zip code has the Highest Percentage of Households with Income Above $100,000 in Blue Springs, MO?
64015 has the Highest Percentage of Households with Income Above $100,000 in Blue Springs, MO with 39.7%.
What is the Percentage of Households with Income Above $100,000 in Blue Springs, MO?
Percentage of Households with Income Above $100,000 in Blue Springs is 39.5%.
What is the Percentage of Households with Income Above $100,000 in Missouri?
Percentage of Households with Income Above $100,000 in Missouri is 30.6%.
What is the Percentage of Households with Income Above $100,000 in the United States?
Percentage of Households with Income Above $100,000 in the United States is 37.3%.