Bethany, MO Map & Demographics
Bethany Map
Bethany Overview
$22,540
PER CAPITA INCOME
$53,974
AVG FAMILY INCOME
$46,528
AVG HOUSEHOLD INCOME
18.3%
WAGE / INCOME GAP [ % ]
81.7¢/ $1
WAGE / INCOME GAP [ $ ]
0.43
INEQUALITY / GINI INDEX
3,113
TOTAL POPULATION
1,474
MALE POPULATION
1,639
FEMALE POPULATION
89.93
MALES / 100 FEMALES
111.19
FEMALES / 100 MALES
41.6
MEDIAN AGE
3.2
AVG FAMILY SIZE
2.6
AVG HOUSEHOLD SIZE
1,234
LABOR FORCE [ PEOPLE ]
53.2%
PERCENT IN LABOR FORCE
2.1%
UNEMPLOYMENT RATE
Bethany Zip Codes
Bethany Area Codes
Income in Bethany
Income Overview in Bethany
Per Capita Income in Bethany is $22,540, while median incomes of families and households are $53,974 and $46,528 respectively.
| Characteristic | Number | Measure |
| Per Capita Income | 3,113 | $22,540 |
| Median Family Income | 686 | $53,974 |
| Mean Family Income | 686 | $66,019 |
| Median Household Income | 1,129 | $46,528 |
| Mean Household Income | 1,129 | $56,050 |
| Income Deficit | 686 | $0 |
| Wage / Income Gap (%) | 3,113 | 18.26% |
| Wage / Income Gap ($) | 3,113 | 81.74¢ per $1 |
| Gini / Inequality Index | 3,113 | 0.43 |
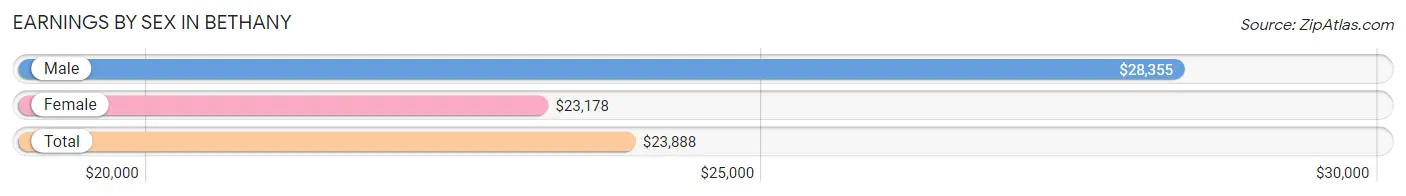
Earnings by Sex in Bethany
Average Earnings in Bethany are $23,888, $28,355 for men and $23,178 for women, a difference of 18.3%.
| Sex | Number | Average Earnings |
| Male | 661 (49.3%) | $28,355 |
| Female | 680 (50.7%) | $23,178 |
| Total | 1,341 (100.0%) | $23,888 |
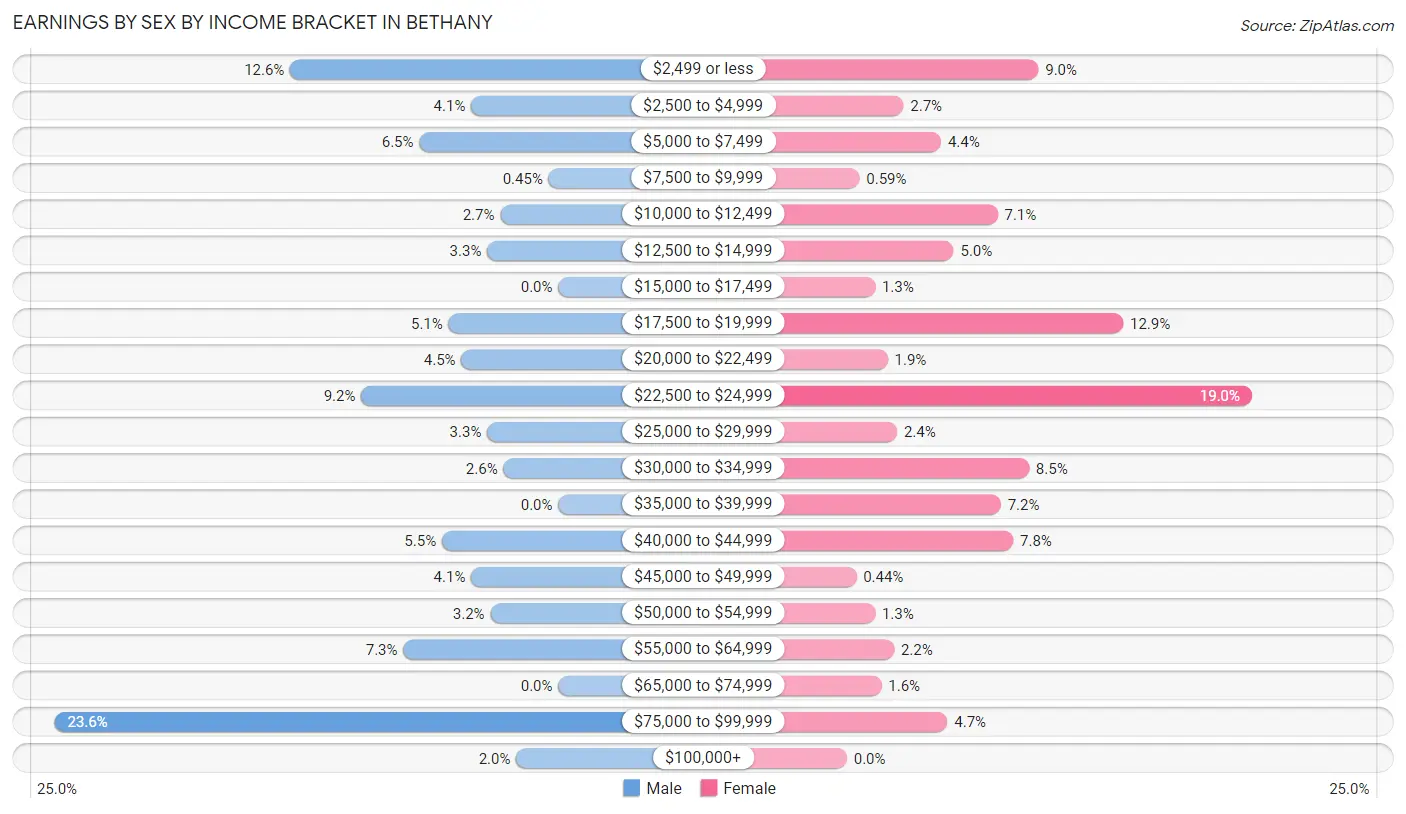
Earnings by Sex by Income Bracket in Bethany
The most common earnings brackets in Bethany are $75,000 to $99,999 for men (156 | 23.6%) and $22,500 to $24,999 for women (129 | 19.0%).
| Income | Male | Female |
| $2,499 or less | 83 (12.6%) | 61 (9.0%) |
| $2,500 to $4,999 | 27 (4.1%) | 18 (2.6%) |
| $5,000 to $7,499 | 43 (6.5%) | 30 (4.4%) |
| $7,500 to $9,999 | 3 (0.4%) | 4 (0.6%) |
| $10,000 to $12,499 | 18 (2.7%) | 48 (7.1%) |
| $12,500 to $14,999 | 22 (3.3%) | 34 (5.0%) |
| $15,000 to $17,499 | 0 (0.0%) | 9 (1.3%) |
| $17,500 to $19,999 | 34 (5.1%) | 88 (12.9%) |
| $20,000 to $22,499 | 30 (4.5%) | 13 (1.9%) |
| $22,500 to $24,999 | 61 (9.2%) | 129 (19.0%) |
| $25,000 to $29,999 | 22 (3.3%) | 16 (2.4%) |
| $30,000 to $34,999 | 17 (2.6%) | 58 (8.5%) |
| $35,000 to $39,999 | 0 (0.0%) | 49 (7.2%) |
| $40,000 to $44,999 | 36 (5.4%) | 53 (7.8%) |
| $45,000 to $49,999 | 27 (4.1%) | 3 (0.4%) |
| $50,000 to $54,999 | 21 (3.2%) | 9 (1.3%) |
| $55,000 to $64,999 | 48 (7.3%) | 15 (2.2%) |
| $65,000 to $74,999 | 0 (0.0%) | 11 (1.6%) |
| $75,000 to $99,999 | 156 (23.6%) | 32 (4.7%) |
| $100,000+ | 13 (2.0%) | 0 (0.0%) |
| Total | 661 (100.0%) | 680 (100.0%) |
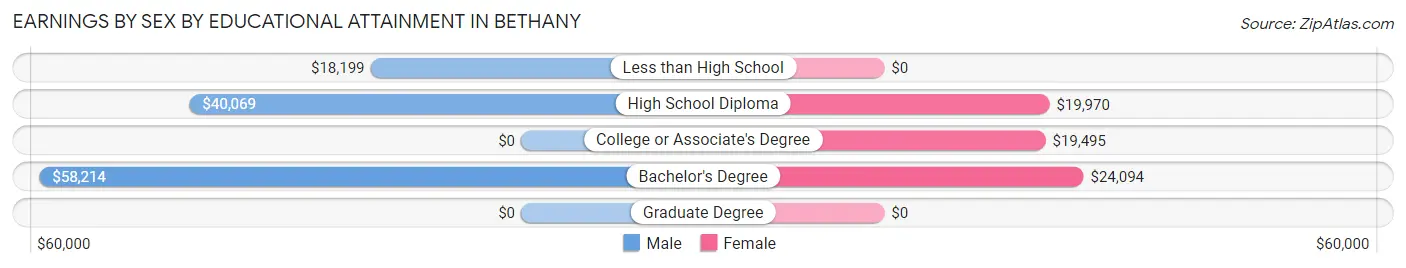
Earnings by Sex by Educational Attainment in Bethany
Average earnings in Bethany are $40,208 for men and $23,411 for women, a difference of 41.8%. Men with an educational attainment of bachelor's degree enjoy the highest average annual earnings of $58,214, while those with less than high school education earn the least with $18,199. Women with an educational attainment of bachelor's degree earn the most with the average annual earnings of $24,094, while those with college or associate's degree education have the smallest earnings of $19,495.
| Educational Attainment | Male Income | Female Income |
| Less than High School | $18,199 | $0 |
| High School Diploma | $40,069 | $19,970 |
| College or Associate's Degree | - | - |
| Bachelor's Degree | $58,214 | $24,094 |
| Graduate Degree | - | - |
| Total | $40,208 | $23,411 |
Family Income in Bethany
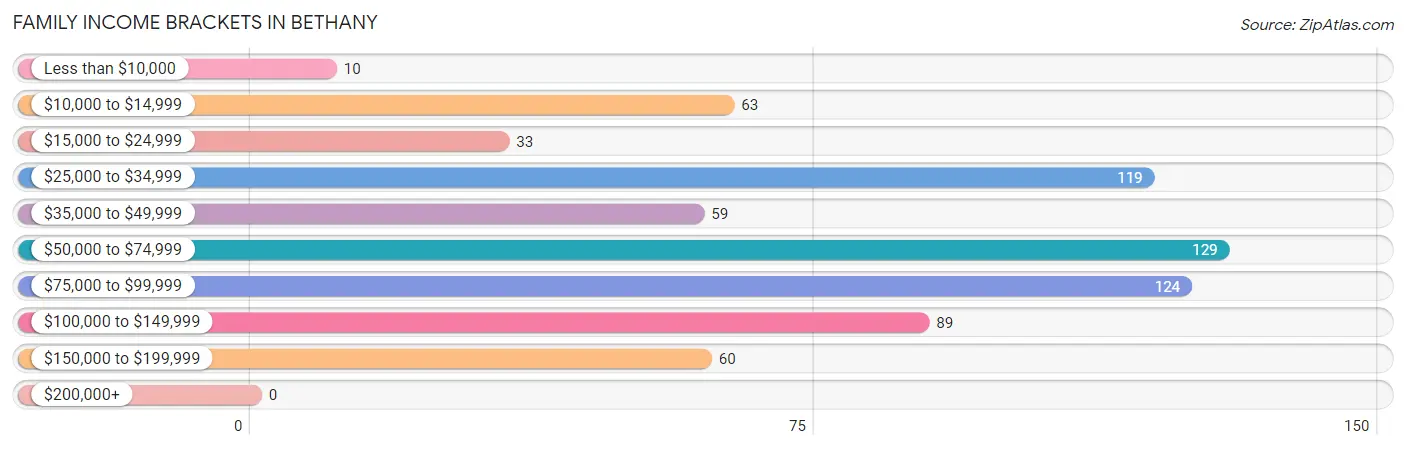
Family Income Brackets in Bethany
According to the Bethany family income data, there are 129 families falling into the $50,000 to $74,999 income range, which is the most common income bracket and makes up 18.8% of all families.
| Income Bracket | # Families | % Families |
| Less than $10,000 | 10 | 1.5% |
| $10,000 to $14,999 | 63 | 9.2% |
| $15,000 to $24,999 | 33 | 4.8% |
| $25,000 to $34,999 | 119 | 17.3% |
| $35,000 to $49,999 | 59 | 8.6% |
| $50,000 to $74,999 | 129 | 18.8% |
| $75,000 to $99,999 | 124 | 18.1% |
| $100,000 to $149,999 | 89 | 13.0% |
| $150,000 to $199,999 | 60 | 8.7% |
| $200,000+ | 0 | 0.0% |
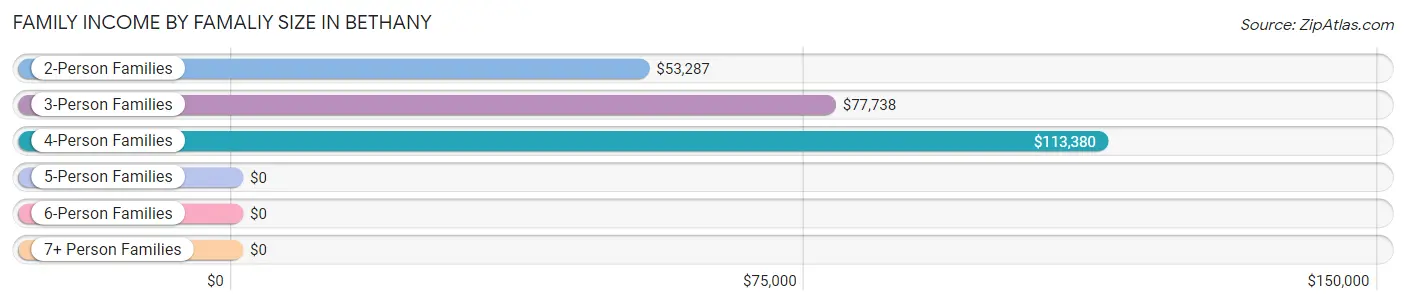
Family Income by Famaliy Size in Bethany
4-person families (113 | 16.5%) account for the highest median family income in Bethany with $113,380 per family, while 4-person families (113 | 16.5%) have the highest median income of $28,345 per family member.
| Income Bracket | # Families | Median Income |
| 2-Person Families | 387 (56.4%) | $53,287 |
| 3-Person Families | 114 (16.6%) | $77,738 |
| 4-Person Families | 113 (16.5%) | $113,380 |
| 5-Person Families | 23 (3.4%) | $0 |
| 6-Person Families | 49 (7.1%) | $0 |
| 7+ Person Families | 0 (0.0%) | $0 |
| Total | 686 (100.0%) | $53,974 |
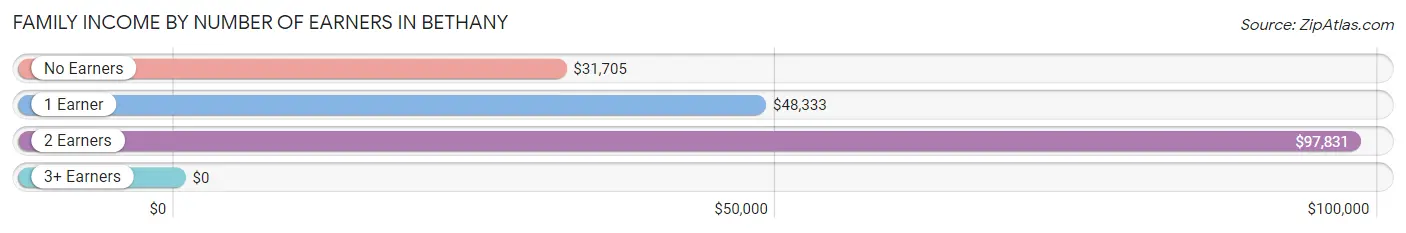
Family Income by Number of Earners in Bethany
| Number of Earners | # Families | Median Income |
| No Earners | 92 (13.4%) | $31,705 |
| 1 Earner | 348 (50.7%) | $48,333 |
| 2 Earners | 219 (31.9%) | $97,831 |
| 3+ Earners | 27 (3.9%) | $0 |
| Total | 686 (100.0%) | $53,974 |
Household Income in Bethany
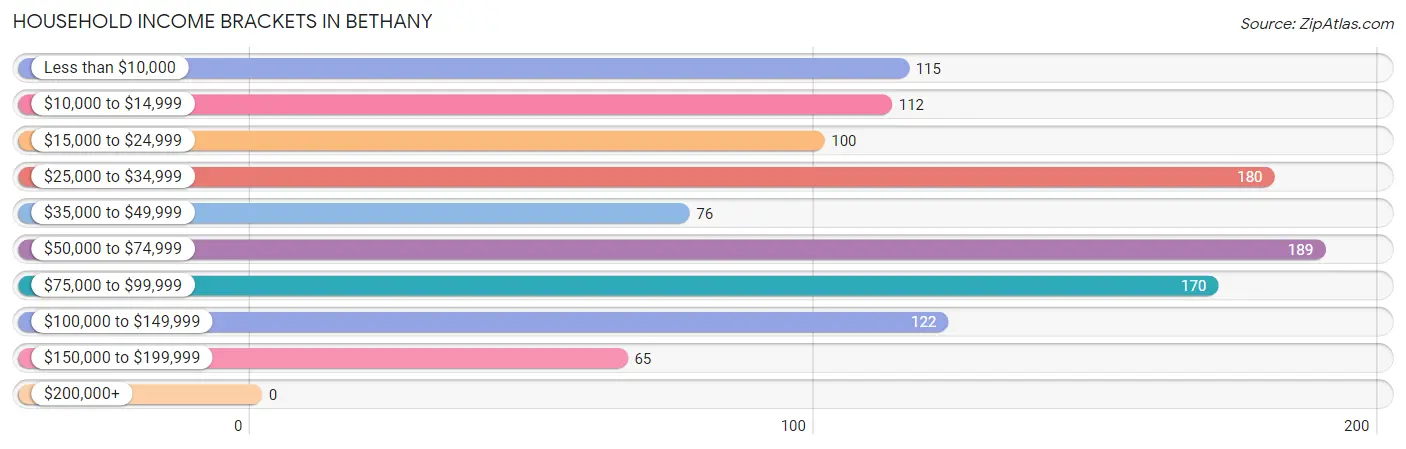
Household Income Brackets in Bethany
With 189 households falling in the category, the $50,000 to $74,999 income range is the most frequent in Bethany, accounting for 16.7% of all households.
| Income Bracket | # Households | % Households |
| Less than $10,000 | 115 | 10.2% |
| $10,000 to $14,999 | 112 | 9.9% |
| $15,000 to $24,999 | 100 | 8.9% |
| $25,000 to $34,999 | 180 | 15.9% |
| $35,000 to $49,999 | 76 | 6.7% |
| $50,000 to $74,999 | 189 | 16.7% |
| $75,000 to $99,999 | 170 | 15.1% |
| $100,000 to $149,999 | 122 | 10.8% |
| $150,000 to $199,999 | 65 | 5.8% |
| $200,000+ | 0 | 0.0% |
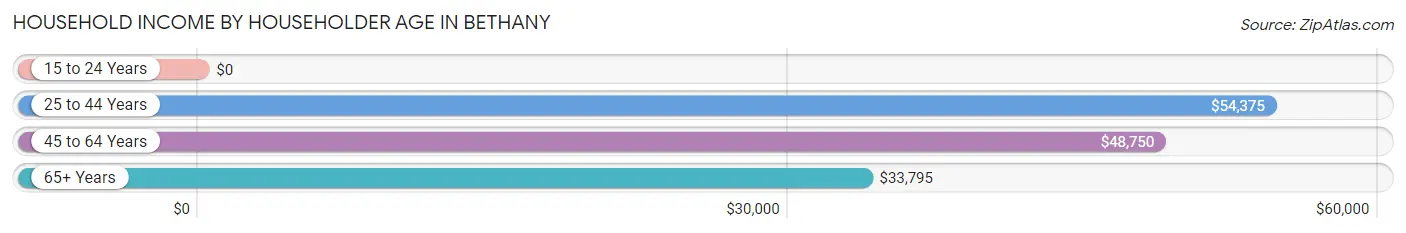
Household Income by Householder Age in Bethany
The median household income in Bethany is $46,528, with the highest median household income of $54,375 found in the 25 to 44 years age bracket for the primary householder. A total of 335 households (29.7%) fall into this category. Meanwhile, the 15 to 24 years age bracket for the primary householder has the lowest median household income of $0, with 24 households (2.1%) in this group.
| Income Bracket | # Households | Median Income |
| 15 to 24 Years | 24 (2.1%) | $0 |
| 25 to 44 Years | 335 (29.7%) | $54,375 |
| 45 to 64 Years | 373 (33.0%) | $48,750 |
| 65+ Years | 397 (35.2%) | $33,795 |
| Total | 1,129 (100.0%) | $46,528 |
Poverty in Bethany
Income Below Poverty by Sex and Age in Bethany
With 14.8% poverty level for males and 18.3% for females among the residents of Bethany, 5 year old males and 5 year old females are the most vulnerable to poverty, with 10 males (100.0%) and 22 females (46.8%) in their respective age groups living below the poverty level.
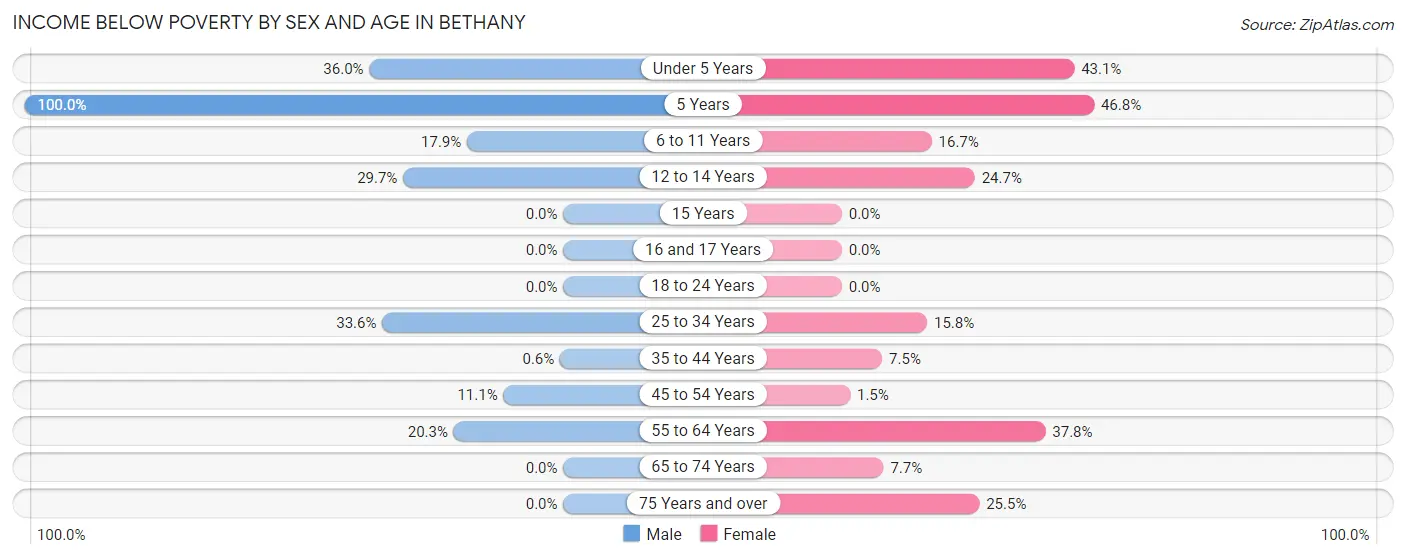
| Age Bracket | Male | Female |
| Under 5 Years | 45 (36.0%) | 22 (43.1%) |
| 5 Years | 10 (100.0%) | 22 (46.8%) |
| 6 to 11 Years | 30 (17.9%) | 25 (16.7%) |
| 12 to 14 Years | 11 (29.7%) | 19 (24.7%) |
| 15 Years | 0 (0.0%) | 0 (0.0%) |
| 16 and 17 Years | 0 (0.0%) | 0 (0.0%) |
| 18 to 24 Years | 0 (0.0%) | 0 (0.0%) |
| 25 to 34 Years | 42 (33.6%) | 22 (15.8%) |
| 35 to 44 Years | 1 (0.6%) | 14 (7.5%) |
| 45 to 54 Years | 10 (11.1%) | 2 (1.5%) |
| 55 to 64 Years | 49 (20.3%) | 82 (37.8%) |
| 65 to 74 Years | 0 (0.0%) | 13 (7.7%) |
| 75 Years and over | 0 (0.0%) | 63 (25.5%) |
| Total | 198 (14.8%) | 284 (18.3%) |
Income Above Poverty by Sex and Age in Bethany
According to the poverty statistics in Bethany, males aged 15 years and females aged 15 years are the age groups that are most secure financially, with 100.0% of males and 100.0% of females in these age groups living above the poverty line.
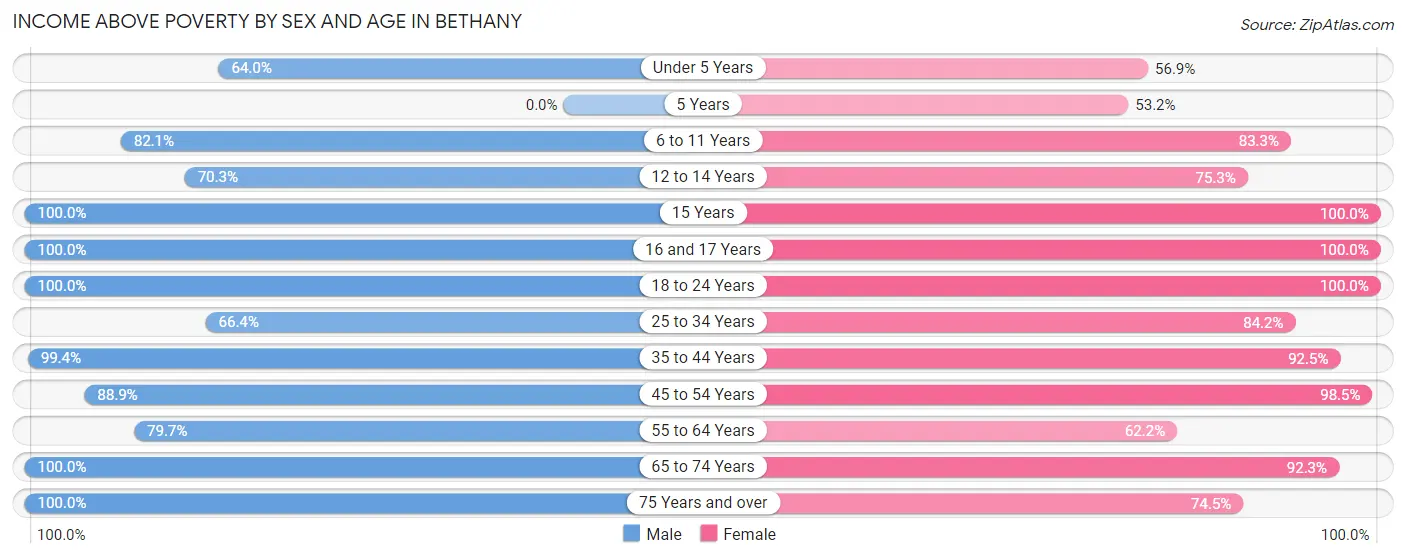
| Age Bracket | Male | Female |
| Under 5 Years | 80 (64.0%) | 29 (56.9%) |
| 5 Years | 0 (0.0%) | 25 (53.2%) |
| 6 to 11 Years | 138 (82.1%) | 125 (83.3%) |
| 12 to 14 Years | 26 (70.3%) | 58 (75.3%) |
| 15 Years | 11 (100.0%) | 26 (100.0%) |
| 16 and 17 Years | 19 (100.0%) | 30 (100.0%) |
| 18 to 24 Years | 65 (100.0%) | 85 (100.0%) |
| 25 to 34 Years | 83 (66.4%) | 117 (84.2%) |
| 35 to 44 Years | 167 (99.4%) | 173 (92.5%) |
| 45 to 54 Years | 80 (88.9%) | 129 (98.5%) |
| 55 to 64 Years | 192 (79.7%) | 135 (62.2%) |
| 65 to 74 Years | 227 (100.0%) | 155 (92.3%) |
| 75 Years and over | 55 (100.0%) | 184 (74.5%) |
| Total | 1,143 (85.2%) | 1,271 (81.7%) |
Income Below Poverty Among Married-Couple Families in Bethany
The poverty statistics for married-couple families in Bethany show that 2.0% or 10 of the total 510 families live below the poverty line. Families with 1 or 2 children have the highest poverty rate of 7.7%, comprising of 10 families. On the other hand, families with no children have the lowest poverty rate of 0.0%, which includes 0 families.
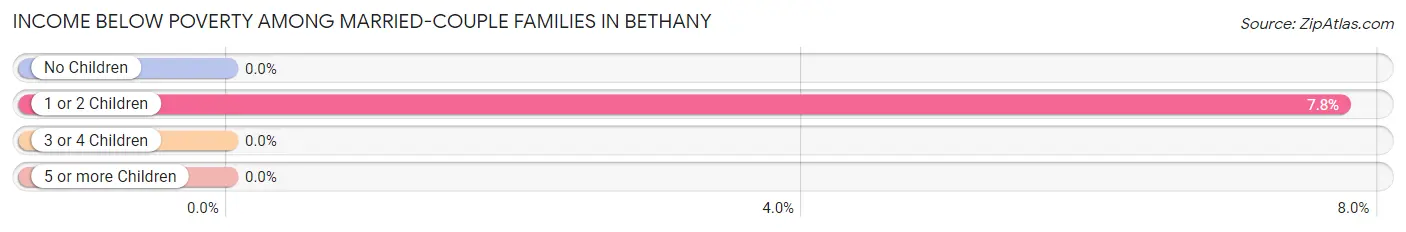
| Children | Above Poverty | Below Poverty |
| No Children | 351 (100.0%) | 0 (0.0%) |
| 1 or 2 Children | 119 (92.2%) | 10 (7.7%) |
| 3 or 4 Children | 30 (100.0%) | 0 (0.0%) |
| 5 or more Children | 0 (0.0%) | 0 (0.0%) |
| Total | 500 (98.0%) | 10 (2.0%) |
Income Below Poverty Among Single-Parent Households in Bethany
According to the poverty data in Bethany, 55.3% or 42 single-father households and 36.0% or 36 single-mother households are living below the poverty line. Among single-father households, those with 5 or more children have the highest poverty rate, with 42 households (100.0%) experiencing poverty. Likewise, among single-mother households, those with 3 or 4 children have the highest poverty rate, with 4 households (100.0%) falling below the poverty line.
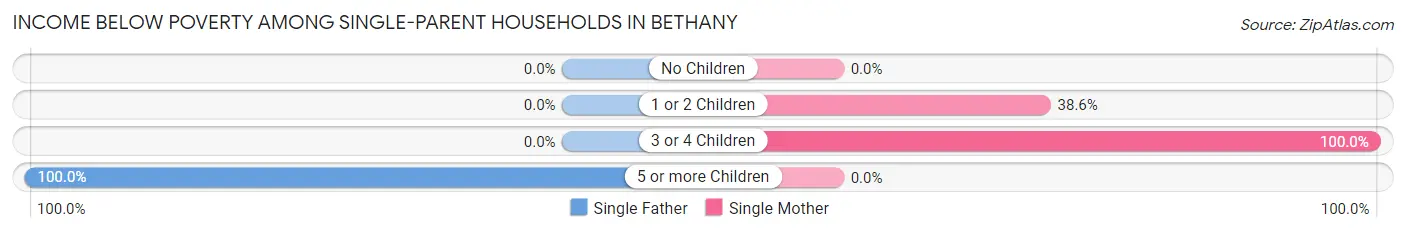
| Children | Single Father | Single Mother |
| No Children | 0 (0.0%) | 0 (0.0%) |
| 1 or 2 Children | 0 (0.0%) | 32 (38.6%) |
| 3 or 4 Children | 0 (0.0%) | 4 (100.0%) |
| 5 or more Children | 42 (100.0%) | 0 (0.0%) |
| Total | 42 (55.3%) | 36 (36.0%) |
Income Below Poverty Among Married-Couple vs Single-Parent Households in Bethany
The poverty data for Bethany shows that 10 of the married-couple family households (2.0%) and 78 of the single-parent households (44.3%) are living below the poverty level. Within the married-couple family households, those with 1 or 2 children have the highest poverty rate, with 10 households (7.7%) falling below the poverty line. Among the single-parent households, those with 3 or 4 children have the highest poverty rate, with 4 household (100.0%) living below poverty.

| Children | Married-Couple Families | Single-Parent Households |
| No Children | 0 (0.0%) | 0 (0.0%) |
| 1 or 2 Children | 10 (7.7%) | 32 (27.4%) |
| 3 or 4 Children | 0 (0.0%) | 4 (100.0%) |
| 5 or more Children | 0 (0.0%) | 42 (100.0%) |
| Total | 10 (2.0%) | 78 (44.3%) |
Race in Bethany
The most populous races in Bethany are White / Caucasian (2,946 | 94.6%), Hispanic or Latino (123 | 4.0%), and Black / African American (77 | 2.5%).
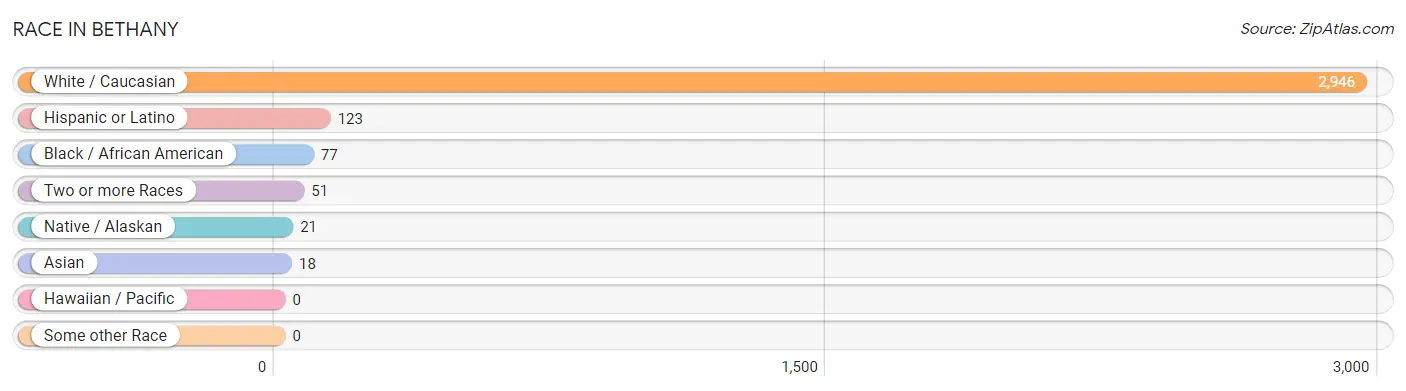
| Race | # Population | % Population |
| Asian | 18 | 0.6% |
| Black / African American | 77 | 2.5% |
| Hawaiian / Pacific | 0 | 0.0% |
| Hispanic or Latino | 123 | 4.0% |
| Native / Alaskan | 21 | 0.7% |
| White / Caucasian | 2,946 | 94.6% |
| Two or more Races | 51 | 1.6% |
| Some other Race | 0 | 0.0% |
| Total | 3,113 | 100.0% |
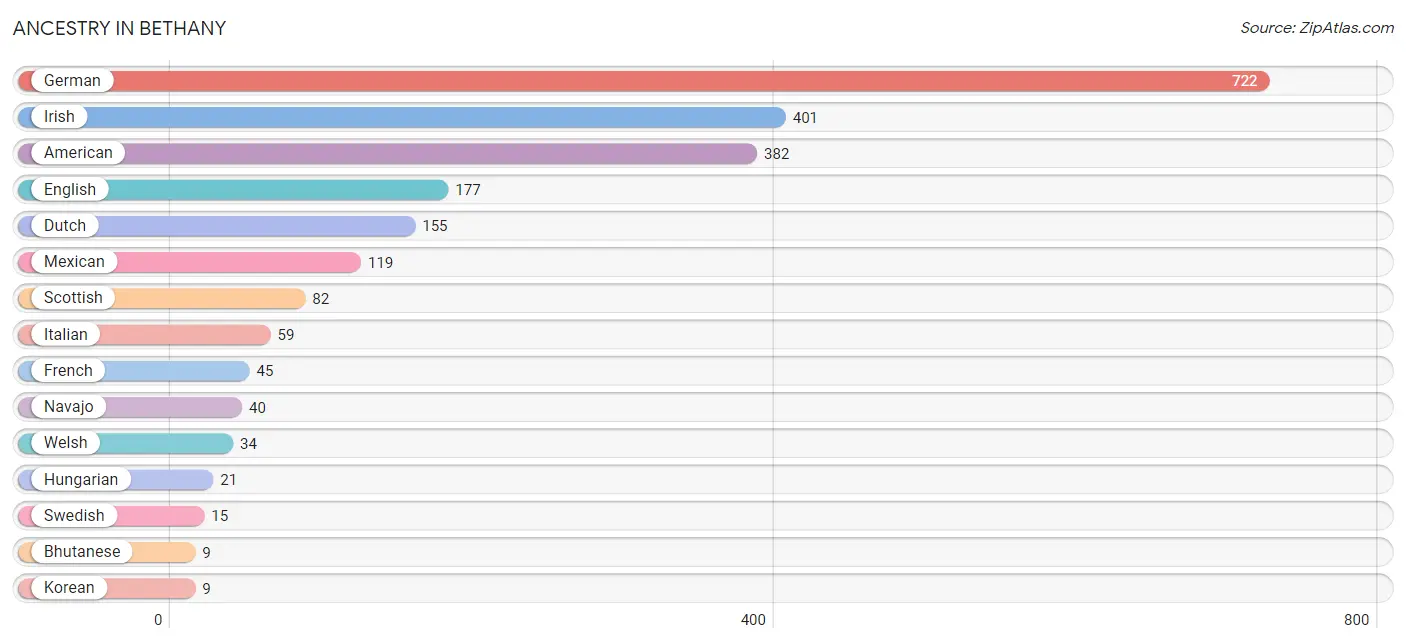
Ancestry in Bethany
The most populous ancestries reported in Bethany are German (722 | 23.2%), Irish (401 | 12.9%), American (382 | 12.3%), English (177 | 5.7%), and Dutch (155 | 5.0%), together accounting for 59.0% of all Bethany residents.
| Ancestry | # Population | % Population |
| American | 382 | 12.3% |
| Austrian | 6 | 0.2% |
| Bhutanese | 9 | 0.3% |
| Czech | 1 | 0.0% |
| Dutch | 155 | 5.0% |
| Eastern European | 7 | 0.2% |
| English | 177 | 5.7% |
| European | 5 | 0.2% |
| French | 45 | 1.5% |
| German | 722 | 23.2% |
| Hungarian | 21 | 0.7% |
| Irish | 401 | 12.9% |
| Italian | 59 | 1.9% |
| Korean | 9 | 0.3% |
| Mexican | 119 | 3.8% |
| Navajo | 40 | 1.3% |
| Scottish | 82 | 2.6% |
| Spanish | 4 | 0.1% |
| Subsaharan African | 9 | 0.3% |
| Swedish | 15 | 0.5% |
| Welsh | 34 | 1.1% | View All 21 Rows |
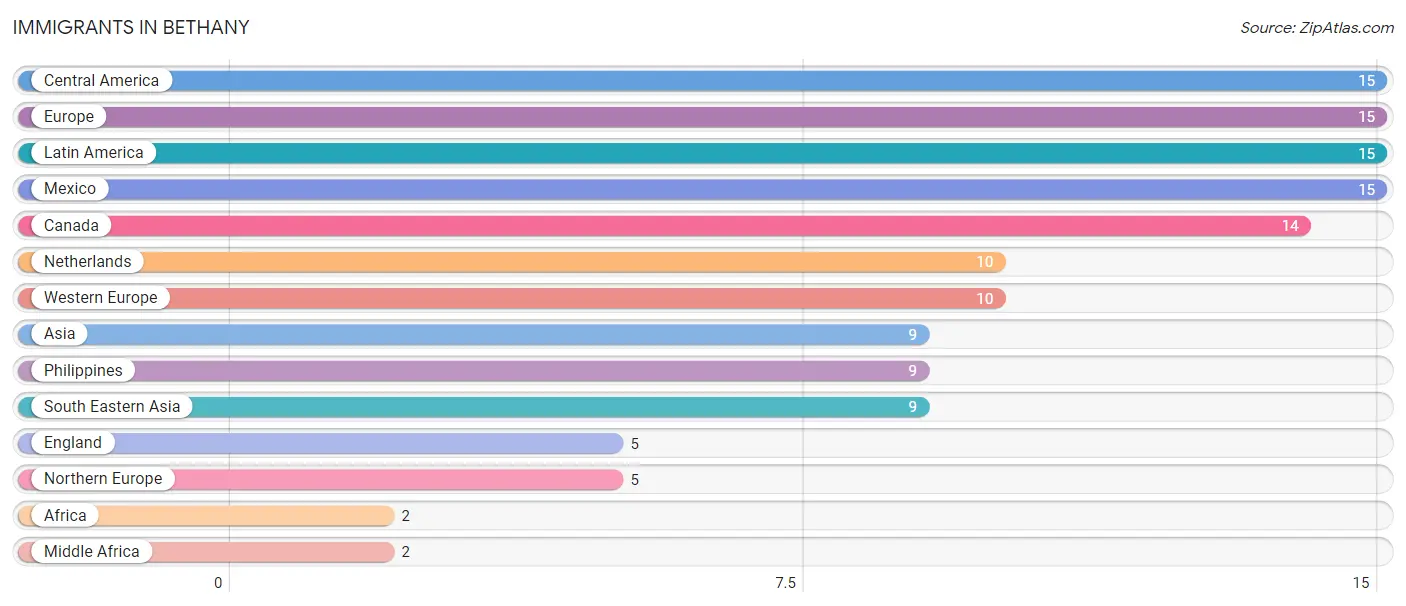
Immigrants in Bethany
The most numerous immigrant groups reported in Bethany came from Central America (15 | 0.5%), Europe (15 | 0.5%), Latin America (15 | 0.5%), Mexico (15 | 0.5%), and Canada (14 | 0.4%), together accounting for 2.4% of all Bethany residents.
| Immigration Origin | # Population | % Population |
| Africa | 2 | 0.1% |
| Asia | 9 | 0.3% |
| Canada | 14 | 0.4% |
| Central America | 15 | 0.5% |
| England | 5 | 0.2% |
| Europe | 15 | 0.5% |
| Latin America | 15 | 0.5% |
| Mexico | 15 | 0.5% |
| Middle Africa | 2 | 0.1% |
| Netherlands | 10 | 0.3% |
| Northern Europe | 5 | 0.2% |
| Philippines | 9 | 0.3% |
| South Eastern Asia | 9 | 0.3% |
| Western Europe | 10 | 0.3% | View All 14 Rows |
Sex and Age in Bethany
Sex and Age in Bethany
The most populous age groups in Bethany are 60 to 64 Years (199 | 13.5%) for men and 5 to 9 Years (204 | 12.4%) for women.
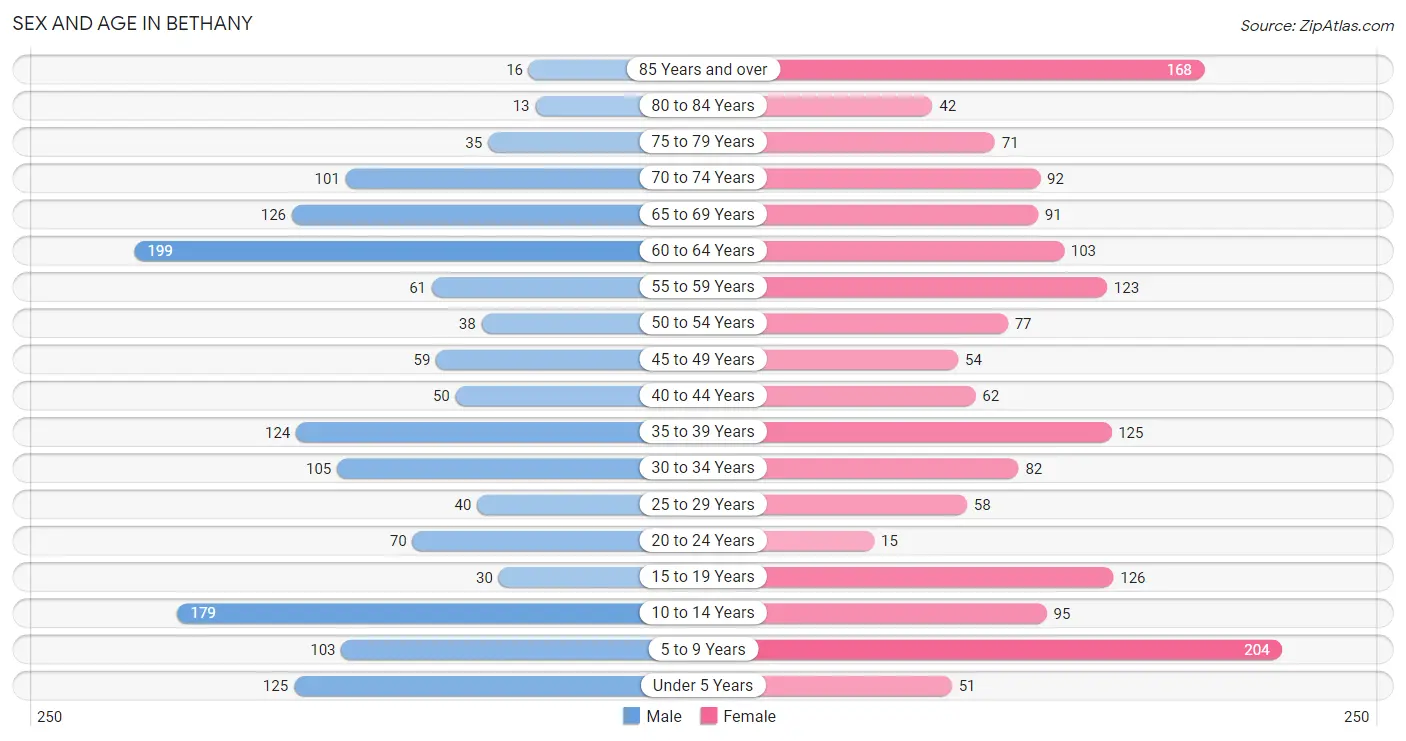
| Age Bracket | Male | Female |
| Under 5 Years | 125 (8.5%) | 51 (3.1%) |
| 5 to 9 Years | 103 (7.0%) | 204 (12.4%) |
| 10 to 14 Years | 179 (12.1%) | 95 (5.8%) |
| 15 to 19 Years | 30 (2.0%) | 126 (7.7%) |
| 20 to 24 Years | 70 (4.8%) | 15 (0.9%) |
| 25 to 29 Years | 40 (2.7%) | 58 (3.5%) |
| 30 to 34 Years | 105 (7.1%) | 82 (5.0%) |
| 35 to 39 Years | 124 (8.4%) | 125 (7.6%) |
| 40 to 44 Years | 50 (3.4%) | 62 (3.8%) |
| 45 to 49 Years | 59 (4.0%) | 54 (3.3%) |
| 50 to 54 Years | 38 (2.6%) | 77 (4.7%) |
| 55 to 59 Years | 61 (4.1%) | 123 (7.5%) |
| 60 to 64 Years | 199 (13.5%) | 103 (6.3%) |
| 65 to 69 Years | 126 (8.6%) | 91 (5.6%) |
| 70 to 74 Years | 101 (6.9%) | 92 (5.6%) |
| 75 to 79 Years | 35 (2.4%) | 71 (4.3%) |
| 80 to 84 Years | 13 (0.9%) | 42 (2.6%) |
| 85 Years and over | 16 (1.1%) | 168 (10.2%) |
| Total | 1,474 (100.0%) | 1,639 (100.0%) |
Families and Households in Bethany
Median Family Size in Bethany
The median family size in Bethany is 3.21 persons per family, with single female/mother families (100 | 14.6%) accounting for the largest median family size of 3.39 persons per family. On the other hand, single male/father families (76 | 11.1%) represent the smallest median family size with 2.72 persons per family.
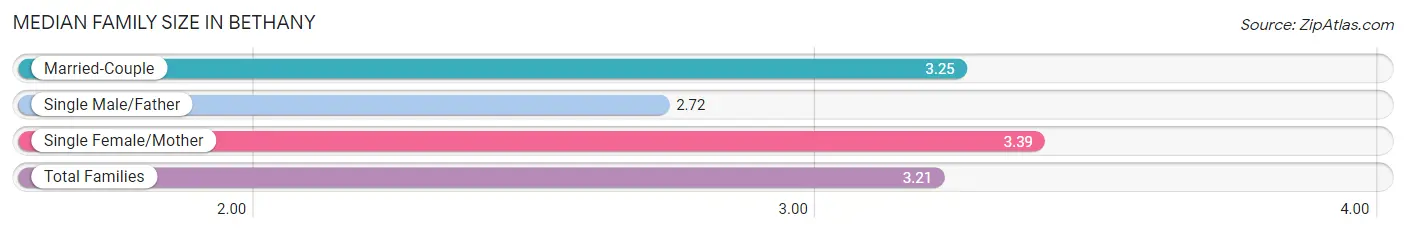
| Family Type | # Families | Family Size |
| Married-Couple | 510 (74.3%) | 3.25 |
| Single Male/Father | 76 (11.1%) | 2.72 |
| Single Female/Mother | 100 (14.6%) | 3.39 |
| Total Families | 686 (100.0%) | 3.21 |
Median Household Size in Bethany
The median household size in Bethany is 2.60 persons per household, with single male/father households (76 | 6.7%) accounting for the largest median household size of 4.83 persons per household. non-family households (443 | 39.2%) represent the smallest median household size with 1.17 persons per household.
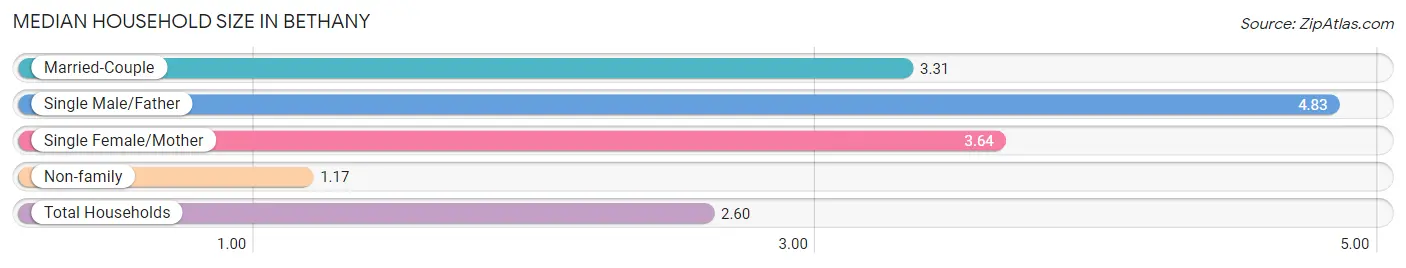
| Household Type | # Households | Household Size |
| Married-Couple | 510 (45.2%) | 3.31 |
| Single Male/Father | 76 (6.7%) | 4.83 |
| Single Female/Mother | 100 (8.9%) | 3.64 |
| Non-family | 443 (39.2%) | 1.17 |
| Total Households | 1,129 (100.0%) | 2.60 |
Household Size by Marriage Status in Bethany
Out of a total of 1,129 households in Bethany, 686 (60.8%) are family households, while 443 (39.2%) are nonfamily households. The most numerous type of family households are 2-person households, comprising 320, and the most common type of nonfamily households are 1-person households, comprising 392.
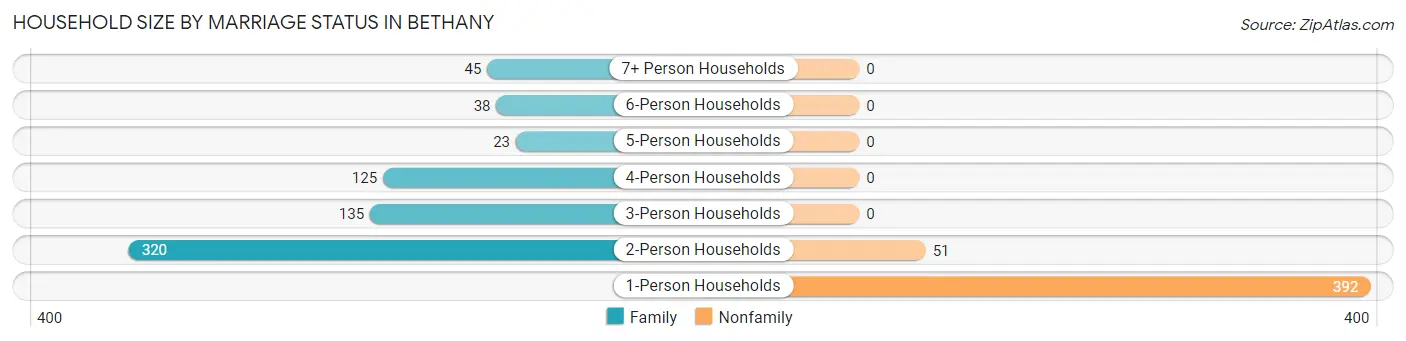
| Household Size | Family Households | Nonfamily Households |
| 1-Person Households | - | 392 (34.7%) |
| 2-Person Households | 320 (28.3%) | 51 (4.5%) |
| 3-Person Households | 135 (12.0%) | 0 (0.0%) |
| 4-Person Households | 125 (11.1%) | 0 (0.0%) |
| 5-Person Households | 23 (2.0%) | 0 (0.0%) |
| 6-Person Households | 38 (3.4%) | 0 (0.0%) |
| 7+ Person Households | 45 (4.0%) | 0 (0.0%) |
| Total | 686 (60.8%) | 443 (39.2%) |
Female Fertility in Bethany
Fertility by Age in Bethany
Average fertility rate in Bethany is 44.0 births per 1,000 women. Women in the age bracket of 20 to 34 years have the highest fertility rate with 155.0 births per 1,000 women. Women in the age bracket of 20 to 34 years acount for 100.0% of all women with births.
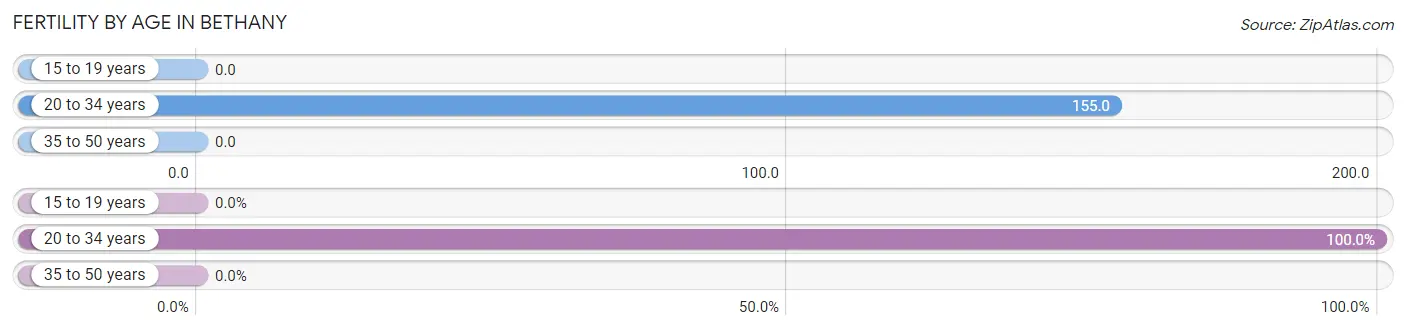
| Age Bracket | Women with Births | Births / 1,000 Women |
| 15 to 19 years | 0 (0.0%) | 0.0 |
| 20 to 34 years | 24 (100.0%) | 155.0 |
| 35 to 50 years | 0 (0.0%) | 0.0 |
| Total | 24 (100.0%) | 44.0 |
Fertility by Age by Marriage Status in Bethany
37.5% of women with births (24) in Bethany are married. The highest percentage of unmarried women with births falls into 20 to 34 years age bracket with 62.5% of them unmarried at the time of birth, while the lowest percentage of unmarried women with births belong to 20 to 34 years age bracket with 62.5% of them unmarried.
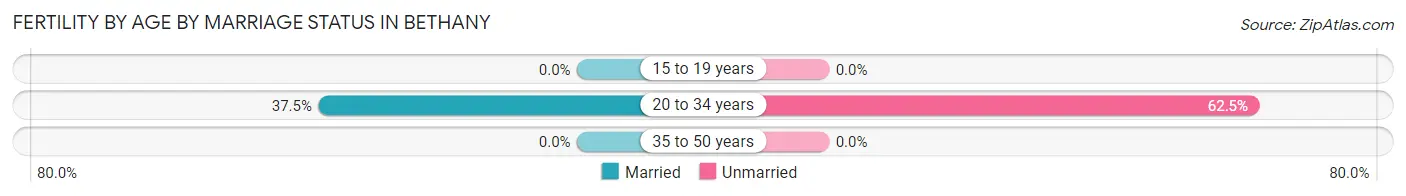
| Age Bracket | Married | Unmarried |
| 15 to 19 years | 0 (0.0%) | 0 (0.0%) |
| 20 to 34 years | 9 (37.5%) | 15 (62.5%) |
| 35 to 50 years | 0 (0.0%) | 0 (0.0%) |
| Total | 9 (37.5%) | 15 (62.5%) |
Fertility by Education in Bethany
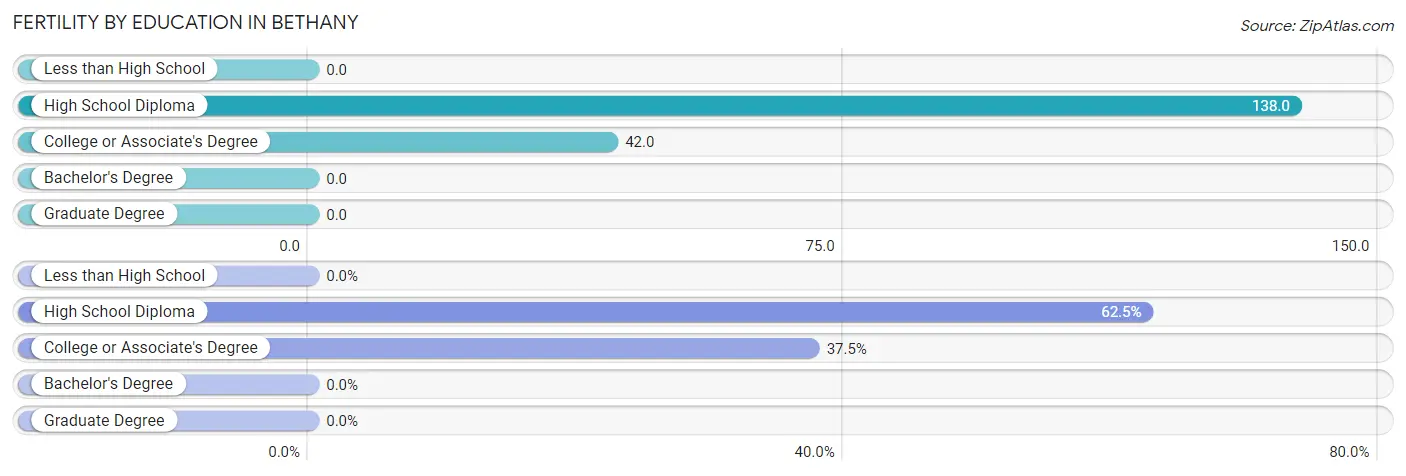
| Educational Attainment | Women with Births | Births / 1,000 Women |
| Less than High School | 0 (0.0%) | 0.0 |
| High School Diploma | 15 (62.5%) | 138.0 |
| College or Associate's Degree | 9 (37.5%) | 42.0 |
| Bachelor's Degree | 0 (0.0%) | 0.0 |
| Graduate Degree | 0 (0.0%) | 0.0 |
| Total | 24 (100.0%) | 44.0 |
Fertility by Education by Marriage Status in Bethany
62.5% of women with births in Bethany are unmarried. Women with the educational attainment of college or associate's degree are most likely to be married with 100.0% of them married at childbirth, while women with the educational attainment of high school diploma are least likely to be married with 100.0% of them unmarried at childbirth.
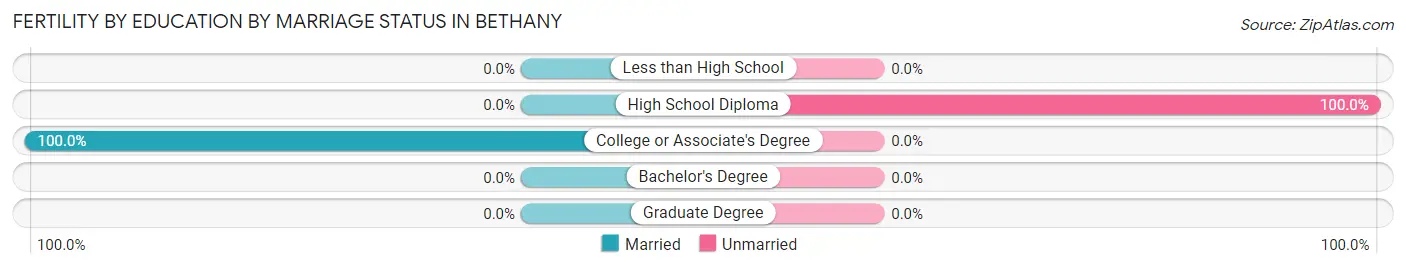
| Educational Attainment | Married | Unmarried |
| Less than High School | 0 (0.0%) | 0 (0.0%) |
| High School Diploma | 0 (0.0%) | 15 (100.0%) |
| College or Associate's Degree | 9 (100.0%) | 0 (0.0%) |
| Bachelor's Degree | 0 (0.0%) | 0 (0.0%) |
| Graduate Degree | 0 (0.0%) | 0 (0.0%) |
| Total | 9 (37.5%) | 15 (62.5%) |
Employment Characteristics in Bethany
Employment by Class of Employer in Bethany
Among the 1,173 employed individuals in Bethany, private company employees (781 | 66.6%), local government employees (133 | 11.3%), and self-employed (not incorporated) (111 | 9.5%) make up the most common classes of employment.
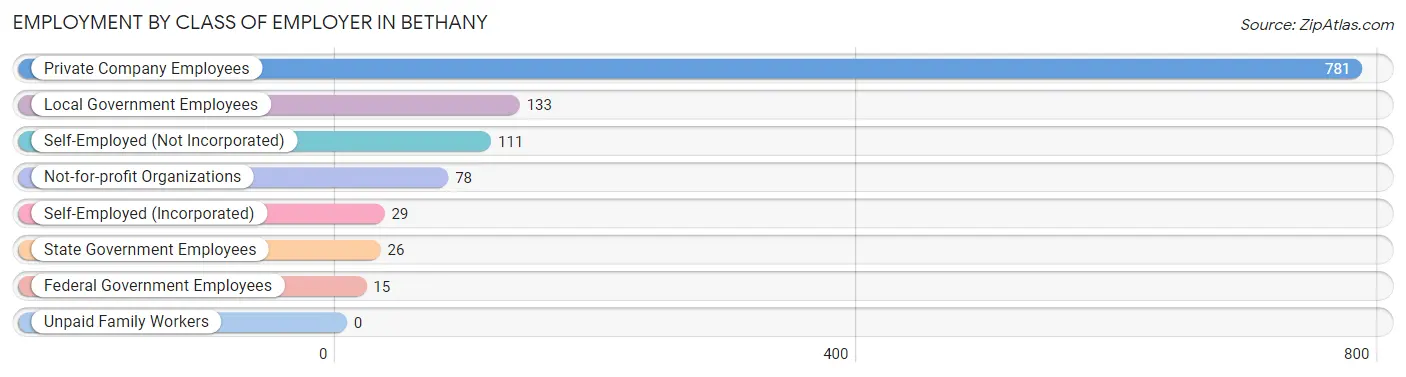
| Employer Class | # Employees | % Employees |
| Private Company Employees | 781 | 66.6% |
| Self-Employed (Incorporated) | 29 | 2.5% |
| Self-Employed (Not Incorporated) | 111 | 9.5% |
| Not-for-profit Organizations | 78 | 6.7% |
| Local Government Employees | 133 | 11.3% |
| State Government Employees | 26 | 2.2% |
| Federal Government Employees | 15 | 1.3% |
| Unpaid Family Workers | 0 | 0.0% |
| Total | 1,173 | 100.0% |
Employment Status by Age in Bethany
According to the labor force statistics for Bethany, out of the total population over 16 years of age (2,319), 53.2% or 1,234 individuals are in the labor force, with 2.1% or 26 of them unemployed. The age group with the highest labor force participation rate is 45 to 54 years, with 86.8% or 198 individuals in the labor force. Within the labor force, the 55 to 59 years age range has the highest percentage of unemployed individuals, with 17.1% or 26 of them being unemployed.
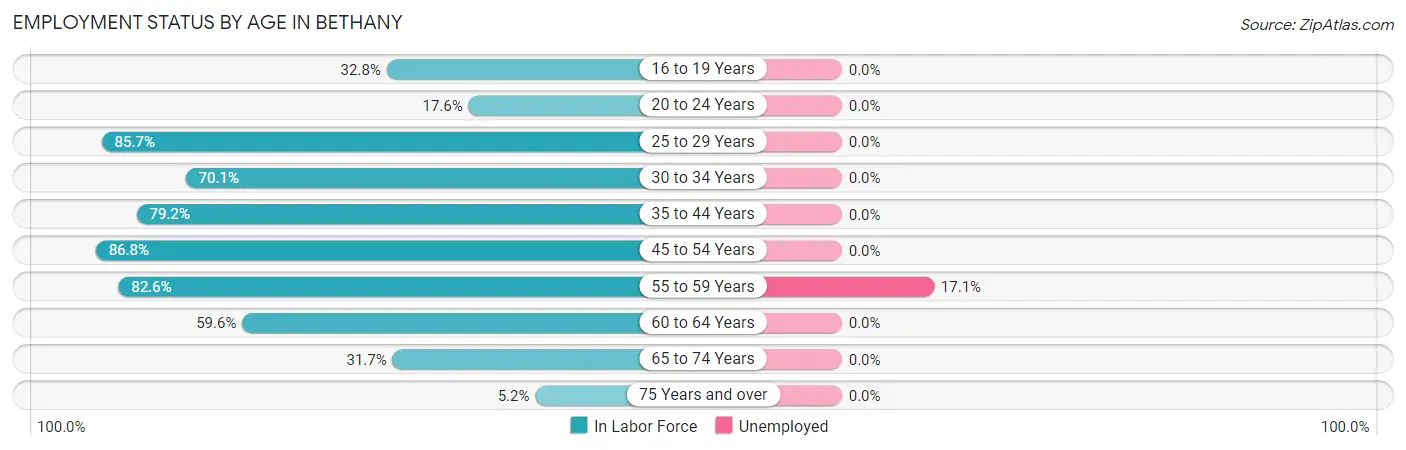
| Age Bracket | In Labor Force | Unemployed |
| 16 to 19 Years | 39 (32.8%) | 0 (0.0%) |
| 20 to 24 Years | 15 (17.6%) | 0 (0.0%) |
| 25 to 29 Years | 84 (85.7%) | 0 (0.0%) |
| 30 to 34 Years | 131 (70.1%) | 0 (0.0%) |
| 35 to 44 Years | 286 (79.2%) | 0 (0.0%) |
| 45 to 54 Years | 198 (86.8%) | 0 (0.0%) |
| 55 to 59 Years | 152 (82.6%) | 26 (17.1%) |
| 60 to 64 Years | 180 (59.6%) | 0 (0.0%) |
| 65 to 74 Years | 130 (31.7%) | 0 (0.0%) |
| 75 Years and over | 18 (5.2%) | 0 (0.0%) |
| Total | 1,234 (53.2%) | 26 (2.1%) |
Employment Status by Educational Attainment in Bethany
According to labor force statistics for Bethany, 75.8% of individuals (1,031) out of the total population between 25 and 64 years of age (1,360) are in the labor force, with 2.5% or 26 of them being unemployed. The group with the highest labor force participation rate are those with the educational attainment of bachelor's degree or higher, with 83.5% or 243 individuals in the labor force. Within the labor force, individuals with high school diploma education have the highest percentage of unemployment, with 6.0% or 26 of them being unemployed.
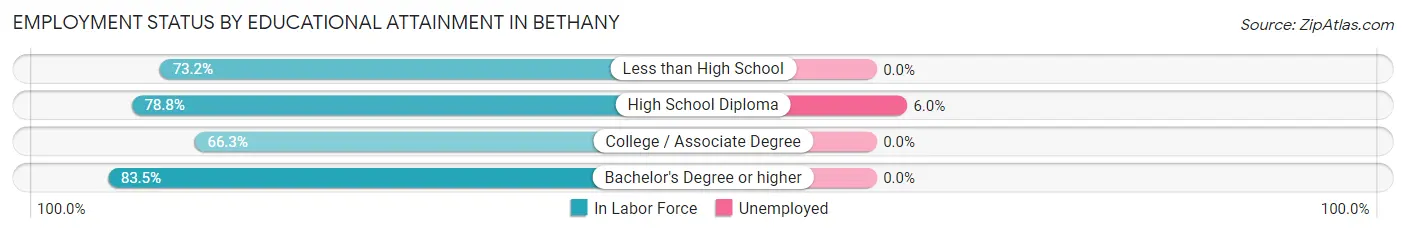
| Educational Attainment | In Labor Force | Unemployed |
| Less than High School | 115 (73.2%) | 0 (0.0%) |
| High School Diploma | 431 (78.8%) | 33 (6.0%) |
| College / Associate Degree | 242 (66.3%) | 0 (0.0%) |
| Bachelor's Degree or higher | 243 (83.5%) | 0 (0.0%) |
| Total | 1,031 (75.8%) | 34 (2.5%) |
Employment Occupations by Sex in Bethany
Management, Business, Science and Arts Occupations
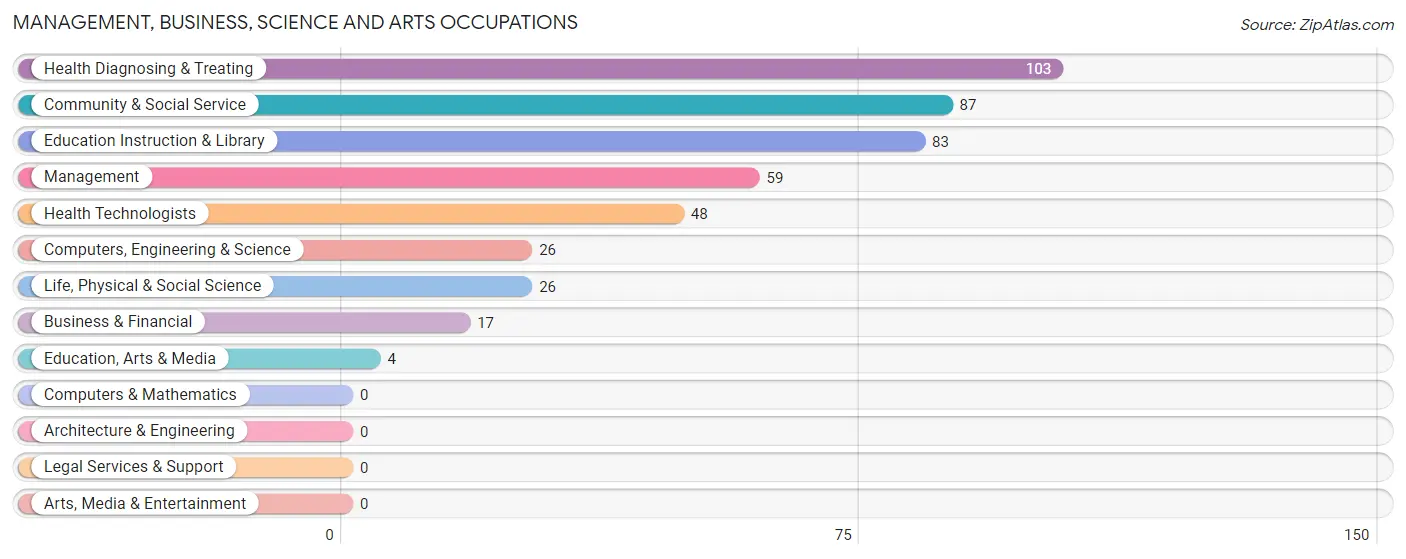
The most common Management, Business, Science and Arts occupations in Bethany are Health Diagnosing & Treating (103 | 8.5%), Community & Social Service (87 | 7.2%), Education Instruction & Library (83 | 6.9%), Management (59 | 4.9%), and Health Technologists (48 | 4.0%).
Management, Business, Science and Arts Occupations by Sex
Within the Management, Business, Science and Arts occupations in Bethany, the most male-oriented occupations are Education, Arts & Media (100.0%), Management (62.7%), and Health Diagnosing & Treating (42.7%), while the most female-oriented occupations are Business & Financial (100.0%), Computers, Engineering & Science (100.0%), and Life, Physical & Social Science (100.0%).
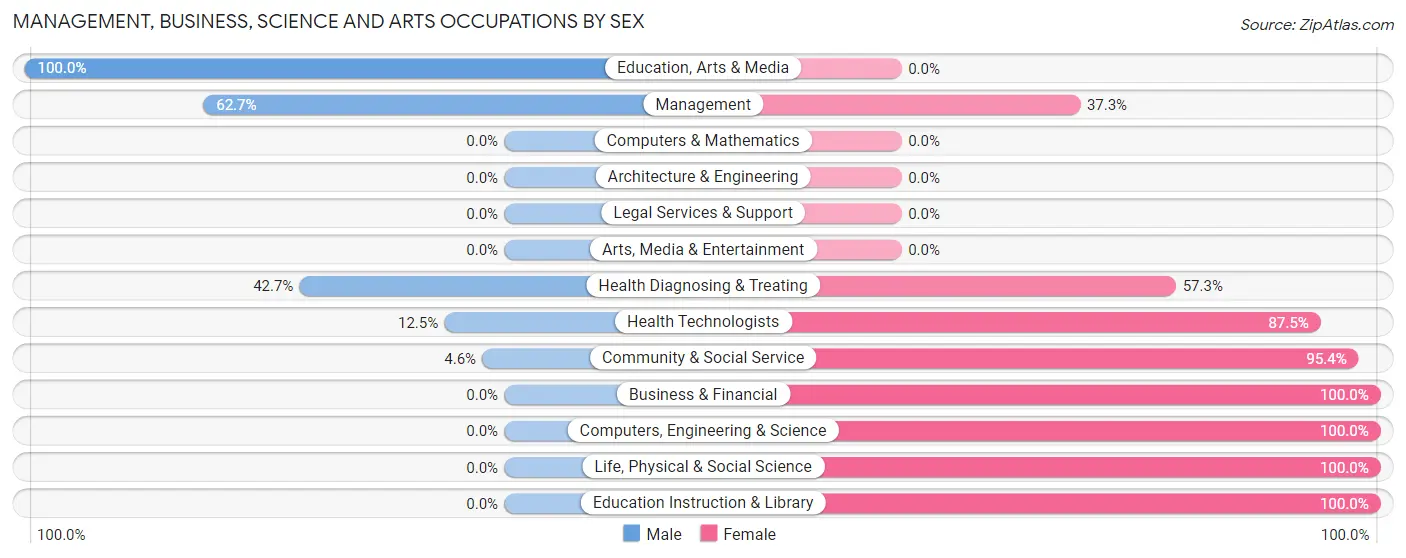
| Occupation | Male | Female |
| Management | 37 (62.7%) | 22 (37.3%) |
| Business & Financial | 0 (0.0%) | 17 (100.0%) |
| Computers, Engineering & Science | 0 (0.0%) | 26 (100.0%) |
| Computers & Mathematics | 0 (0.0%) | 0 (0.0%) |
| Architecture & Engineering | 0 (0.0%) | 0 (0.0%) |
| Life, Physical & Social Science | 0 (0.0%) | 26 (100.0%) |
| Community & Social Service | 4 (4.6%) | 83 (95.4%) |
| Education, Arts & Media | 4 (100.0%) | 0 (0.0%) |
| Legal Services & Support | 0 (0.0%) | 0 (0.0%) |
| Education Instruction & Library | 0 (0.0%) | 83 (100.0%) |
| Arts, Media & Entertainment | 0 (0.0%) | 0 (0.0%) |
| Health Diagnosing & Treating | 44 (42.7%) | 59 (57.3%) |
| Health Technologists | 6 (12.5%) | 42 (87.5%) |
| Total (Category) | 85 (29.1%) | 207 (70.9%) |
| Total (Overall) | 549 (45.5%) | 658 (54.5%) |
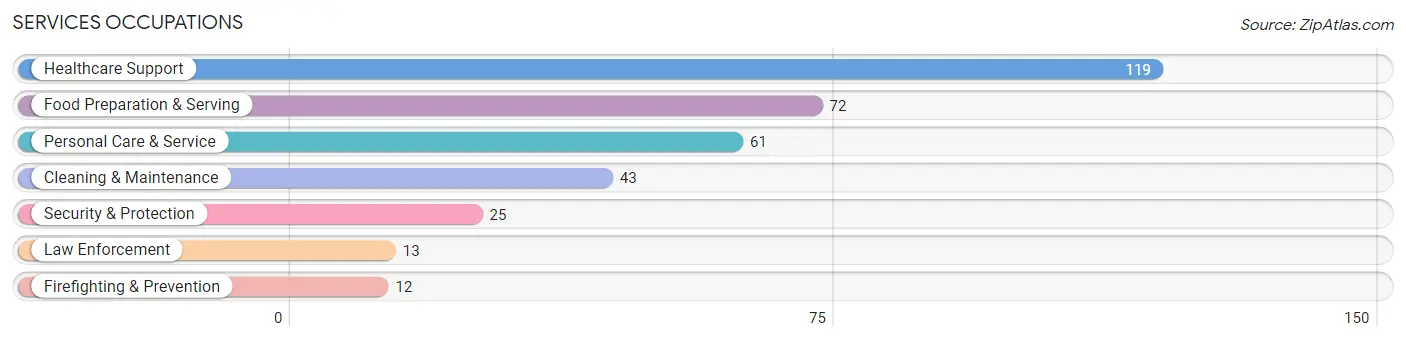
Services Occupations
The most common Services occupations in Bethany are Healthcare Support (119 | 9.9%), Food Preparation & Serving (72 | 6.0%), Personal Care & Service (61 | 5.1%), Cleaning & Maintenance (43 | 3.6%), and Security & Protection (25 | 2.1%).
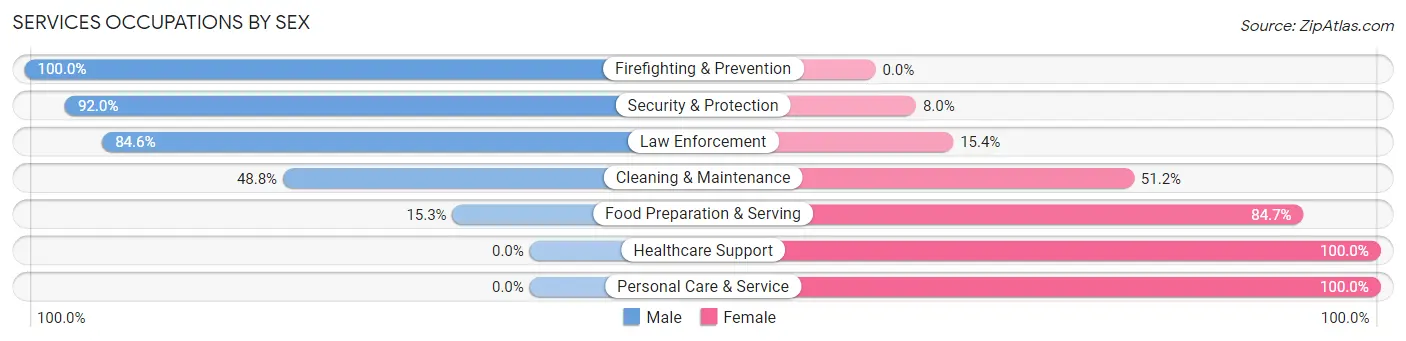
Services Occupations by Sex
Within the Services occupations in Bethany, the most male-oriented occupations are Firefighting & Prevention (100.0%), Security & Protection (92.0%), and Law Enforcement (84.6%), while the most female-oriented occupations are Healthcare Support (100.0%), Personal Care & Service (100.0%), and Food Preparation & Serving (84.7%).
| Occupation | Male | Female |
| Healthcare Support | 0 (0.0%) | 119 (100.0%) |
| Security & Protection | 23 (92.0%) | 2 (8.0%) |
| Firefighting & Prevention | 12 (100.0%) | 0 (0.0%) |
| Law Enforcement | 11 (84.6%) | 2 (15.4%) |
| Food Preparation & Serving | 11 (15.3%) | 61 (84.7%) |
| Cleaning & Maintenance | 21 (48.8%) | 22 (51.2%) |
| Personal Care & Service | 0 (0.0%) | 61 (100.0%) |
| Total (Category) | 55 (17.2%) | 265 (82.8%) |
| Total (Overall) | 549 (45.5%) | 658 (54.5%) |
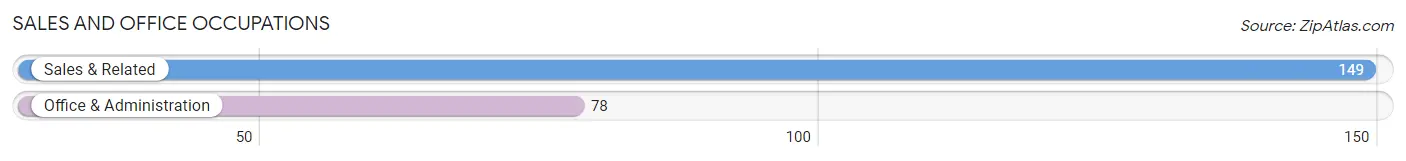
Sales and Office Occupations
The most common Sales and Office occupations in Bethany are Sales & Related (149 | 12.3%), and Office & Administration (78 | 6.5%).
Sales and Office Occupations by Sex
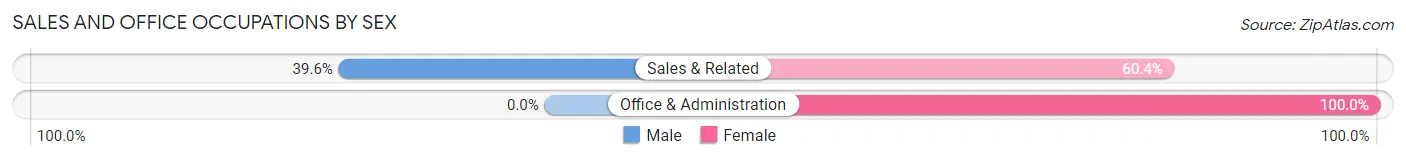
| Occupation | Male | Female |
| Sales & Related | 59 (39.6%) | 90 (60.4%) |
| Office & Administration | 0 (0.0%) | 78 (100.0%) |
| Total (Category) | 59 (26.0%) | 168 (74.0%) |
| Total (Overall) | 549 (45.5%) | 658 (54.5%) |
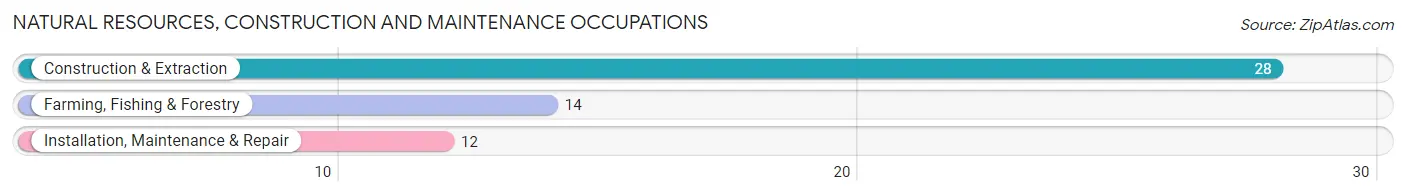
Natural Resources, Construction and Maintenance Occupations
The most common Natural Resources, Construction and Maintenance occupations in Bethany are Construction & Extraction (28 | 2.3%), Farming, Fishing & Forestry (14 | 1.2%), and Installation, Maintenance & Repair (12 | 1.0%).
Natural Resources, Construction and Maintenance Occupations by Sex
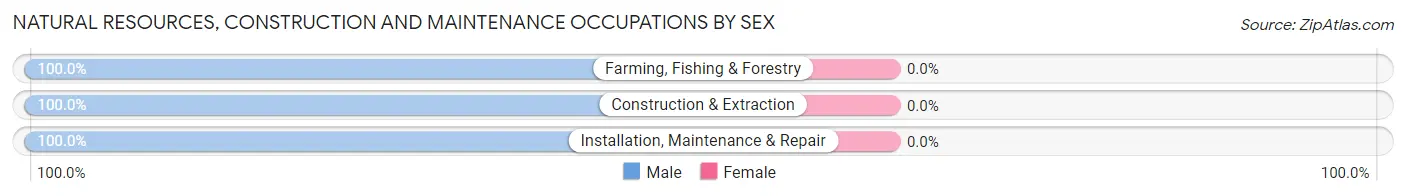
| Occupation | Male | Female |
| Farming, Fishing & Forestry | 14 (100.0%) | 0 (0.0%) |
| Construction & Extraction | 28 (100.0%) | 0 (0.0%) |
| Installation, Maintenance & Repair | 12 (100.0%) | 0 (0.0%) |
| Total (Category) | 54 (100.0%) | 0 (0.0%) |
| Total (Overall) | 549 (45.5%) | 658 (54.5%) |
Production, Transportation and Moving Occupations
The most common Production, Transportation and Moving occupations in Bethany are Transportation (181 | 15.0%), Production (68 | 5.6%), and Material Moving (65 | 5.4%).
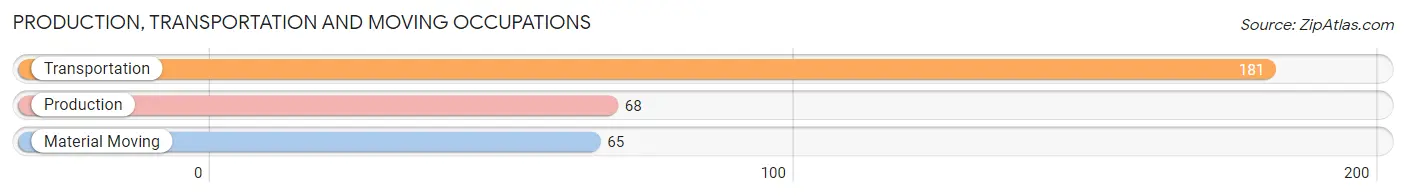
Production, Transportation and Moving Occupations by Sex
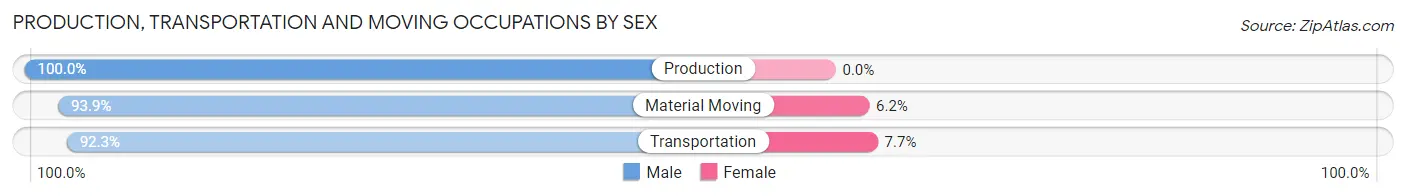
| Occupation | Male | Female |
| Production | 68 (100.0%) | 0 (0.0%) |
| Transportation | 167 (92.3%) | 14 (7.7%) |
| Material Moving | 61 (93.9%) | 4 (6.1%) |
| Total (Category) | 296 (94.3%) | 18 (5.7%) |
| Total (Overall) | 549 (45.5%) | 658 (54.5%) |
Employment Industries by Sex in Bethany
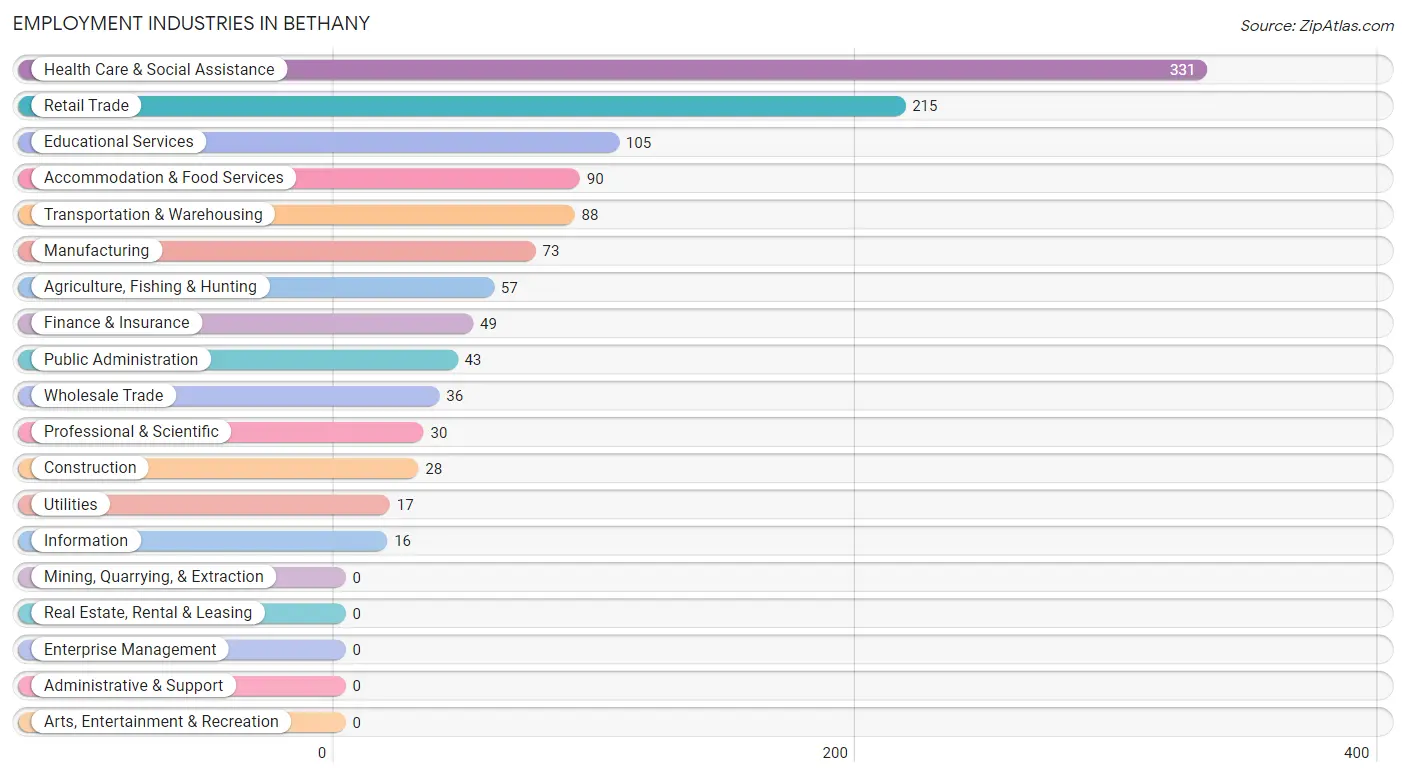
Employment Industries in Bethany
The major employment industries in Bethany include Health Care & Social Assistance (331 | 27.4%), Retail Trade (215 | 17.8%), Educational Services (105 | 8.7%), Accommodation & Food Services (90 | 7.5%), and Transportation & Warehousing (88 | 7.3%).
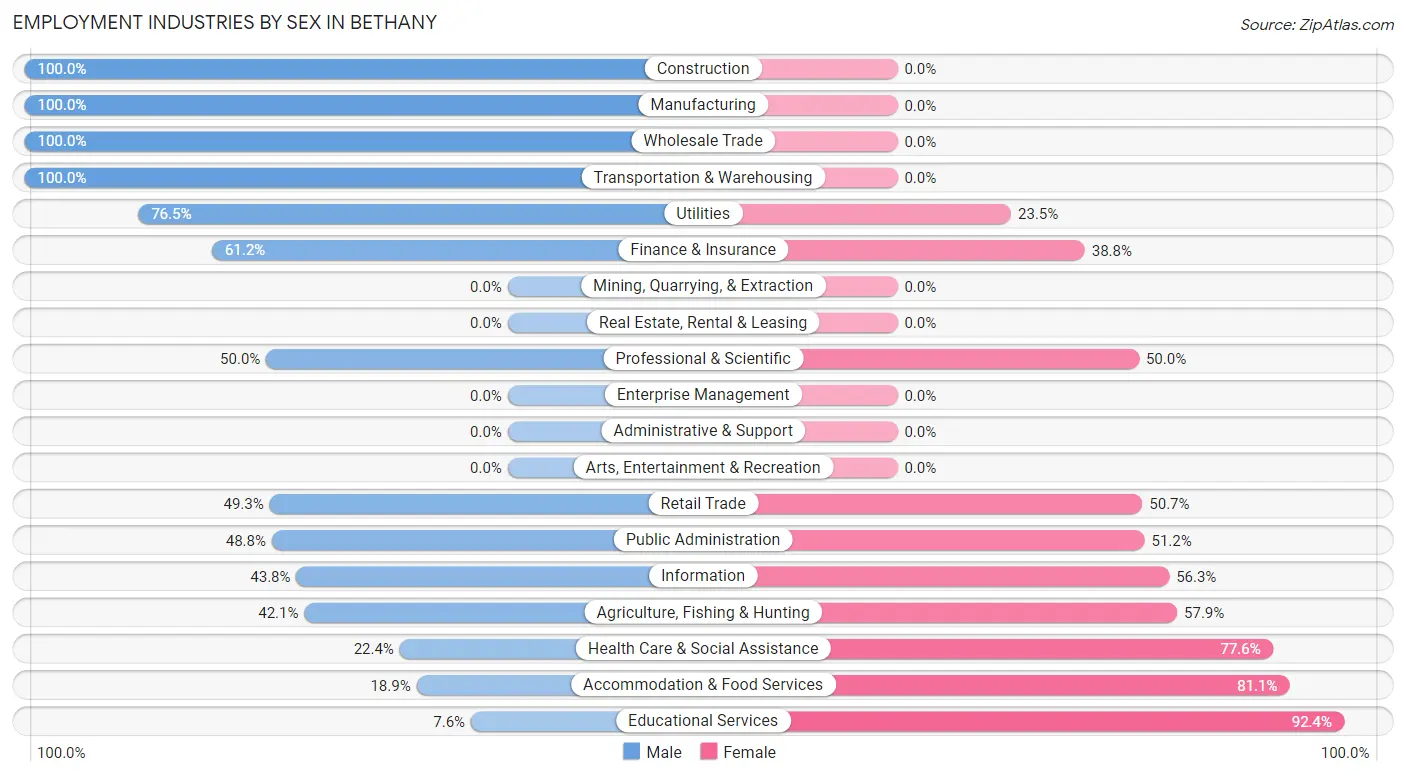
Employment Industries by Sex in Bethany
The Bethany industries that see more men than women are Construction (100.0%), Manufacturing (100.0%), and Wholesale Trade (100.0%), whereas the industries that tend to have a higher number of women are Educational Services (92.4%), Accommodation & Food Services (81.1%), and Health Care & Social Assistance (77.6%).
| Industry | Male | Female |
| Agriculture, Fishing & Hunting | 24 (42.1%) | 33 (57.9%) |
| Mining, Quarrying, & Extraction | 0 (0.0%) | 0 (0.0%) |
| Construction | 28 (100.0%) | 0 (0.0%) |
| Manufacturing | 73 (100.0%) | 0 (0.0%) |
| Wholesale Trade | 36 (100.0%) | 0 (0.0%) |
| Retail Trade | 106 (49.3%) | 109 (50.7%) |
| Transportation & Warehousing | 88 (100.0%) | 0 (0.0%) |
| Utilities | 13 (76.5%) | 4 (23.5%) |
| Information | 7 (43.8%) | 9 (56.2%) |
| Finance & Insurance | 30 (61.2%) | 19 (38.8%) |
| Real Estate, Rental & Leasing | 0 (0.0%) | 0 (0.0%) |
| Professional & Scientific | 15 (50.0%) | 15 (50.0%) |
| Enterprise Management | 0 (0.0%) | 0 (0.0%) |
| Administrative & Support | 0 (0.0%) | 0 (0.0%) |
| Educational Services | 8 (7.6%) | 97 (92.4%) |
| Health Care & Social Assistance | 74 (22.4%) | 257 (77.6%) |
| Arts, Entertainment & Recreation | 0 (0.0%) | 0 (0.0%) |
| Accommodation & Food Services | 17 (18.9%) | 73 (81.1%) |
| Public Administration | 21 (48.8%) | 22 (51.2%) |
| Total | 549 (45.5%) | 658 (54.5%) |
Education in Bethany
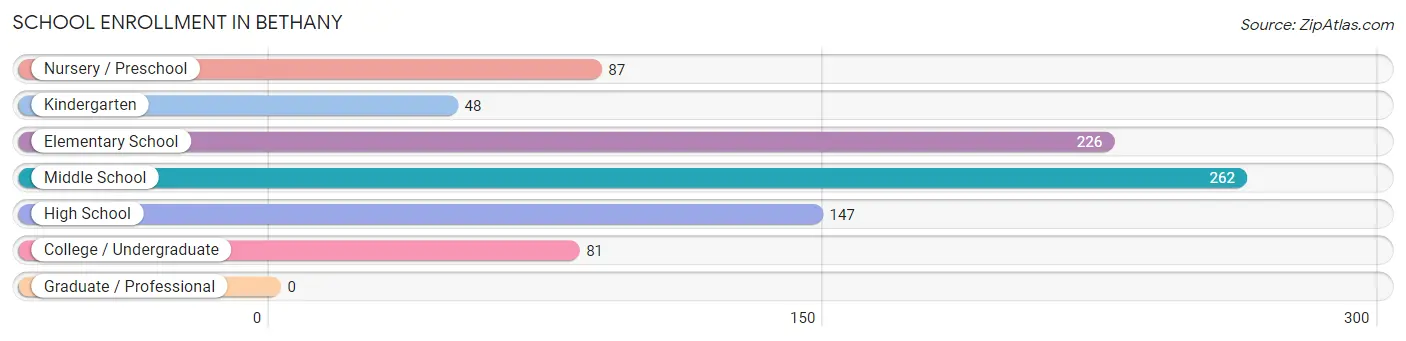
School Enrollment in Bethany
The most common levels of schooling among the 851 students in Bethany are middle school (262 | 30.8%), elementary school (226 | 26.6%), and high school (147 | 17.3%).
| School Level | # Students | % Students |
| Nursery / Preschool | 87 | 10.2% |
| Kindergarten | 48 | 5.6% |
| Elementary School | 226 | 26.6% |
| Middle School | 262 | 30.8% |
| High School | 147 | 17.3% |
| College / Undergraduate | 81 | 9.5% |
| Graduate / Professional | 0 | 0.0% |
| Total | 851 | 100.0% |
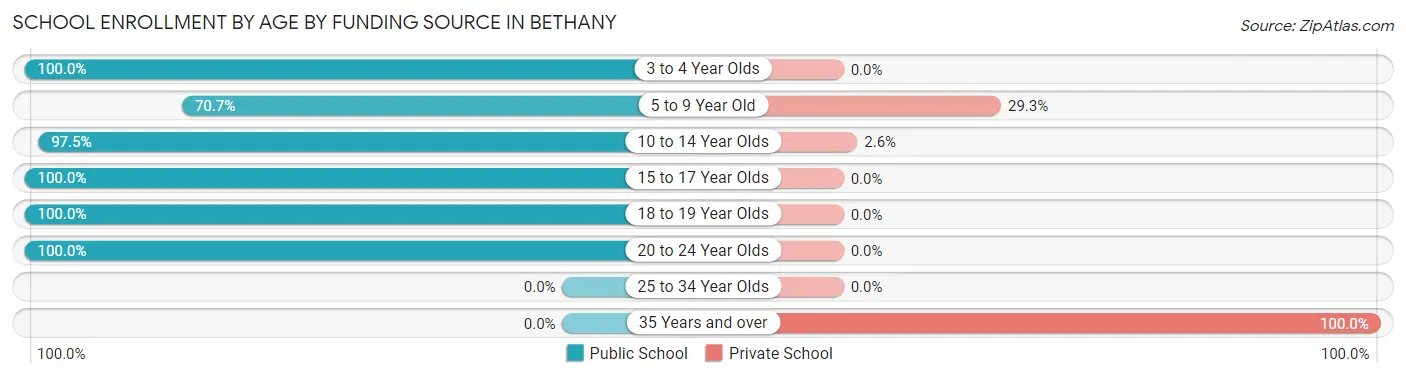
School Enrollment by Age by Funding Source in Bethany
Out of a total of 851 students who are enrolled in schools in Bethany, 104 (12.2%) attend a private institution, while the remaining 747 (87.8%) are enrolled in public schools. The age group of 35 years and over has the highest likelihood of being enrolled in private schools, with 7 (100.0% in the age bracket) enrolled. Conversely, the age group of 3 to 4 year olds has the lowest likelihood of being enrolled in a private school, with 42 (100.0% in the age bracket) attending a public institution.
| Age Bracket | Public School | Private School |
| 3 to 4 Year Olds | 42 (100.0%) | 0 (0.0%) |
| 5 to 9 Year Old | 217 (70.7%) | 90 (29.3%) |
| 10 to 14 Year Olds | 267 (97.5%) | 7 (2.5%) |
| 15 to 17 Year Olds | 86 (100.0%) | 0 (0.0%) |
| 18 to 19 Year Olds | 70 (100.0%) | 0 (0.0%) |
| 20 to 24 Year Olds | 65 (100.0%) | 0 (0.0%) |
| 25 to 34 Year Olds | 0 (0.0%) | 0 (0.0%) |
| 35 Years and over | 0 (0.0%) | 7 (100.0%) |
| Total | 747 (87.8%) | 104 (12.2%) |
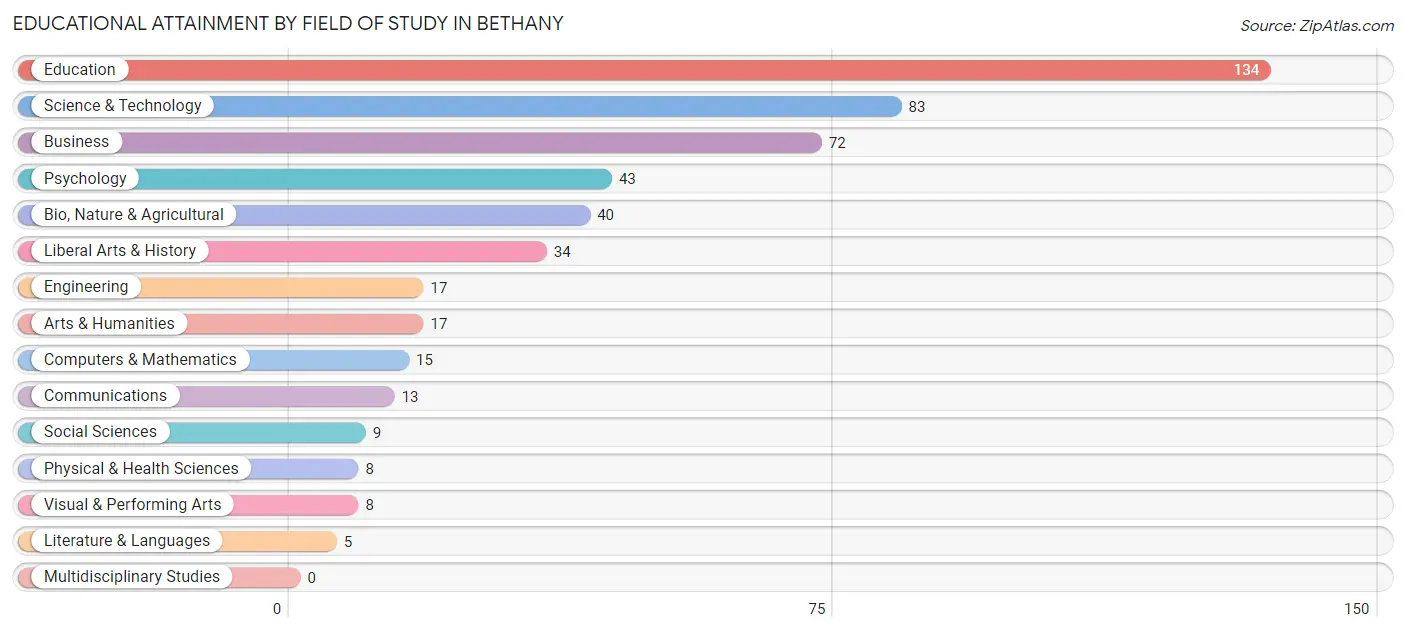
Educational Attainment by Field of Study in Bethany
Education (134 | 26.9%), science & technology (83 | 16.7%), business (72 | 14.5%), psychology (43 | 8.6%), and bio, nature & agricultural (40 | 8.0%) are the most common fields of study among 498 individuals in Bethany who have obtained a bachelor's degree or higher.
| Field of Study | # Graduates | % Graduates |
| Computers & Mathematics | 15 | 3.0% |
| Bio, Nature & Agricultural | 40 | 8.0% |
| Physical & Health Sciences | 8 | 1.6% |
| Psychology | 43 | 8.6% |
| Social Sciences | 9 | 1.8% |
| Engineering | 17 | 3.4% |
| Multidisciplinary Studies | 0 | 0.0% |
| Science & Technology | 83 | 16.7% |
| Business | 72 | 14.5% |
| Education | 134 | 26.9% |
| Literature & Languages | 5 | 1.0% |
| Liberal Arts & History | 34 | 6.8% |
| Visual & Performing Arts | 8 | 1.6% |
| Communications | 13 | 2.6% |
| Arts & Humanities | 17 | 3.4% |
| Total | 498 | 100.0% |
Transportation & Commute in Bethany
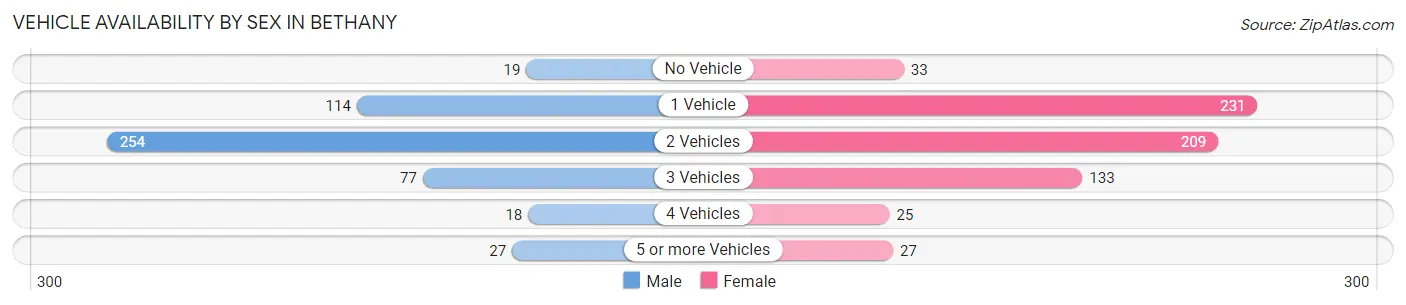
Vehicle Availability by Sex in Bethany
The most prevalent vehicle ownership categories in Bethany are males with 2 vehicles (254, accounting for 49.9%) and females with 2 vehicles (209, making up 38.6%).
| Vehicles Available | Male | Female |
| No Vehicle | 19 (3.7%) | 33 (5.0%) |
| 1 Vehicle | 114 (22.4%) | 231 (35.1%) |
| 2 Vehicles | 254 (49.9%) | 209 (31.8%) |
| 3 Vehicles | 77 (15.1%) | 133 (20.2%) |
| 4 Vehicles | 18 (3.5%) | 25 (3.8%) |
| 5 or more Vehicles | 27 (5.3%) | 27 (4.1%) |
| Total | 509 (100.0%) | 658 (100.0%) |
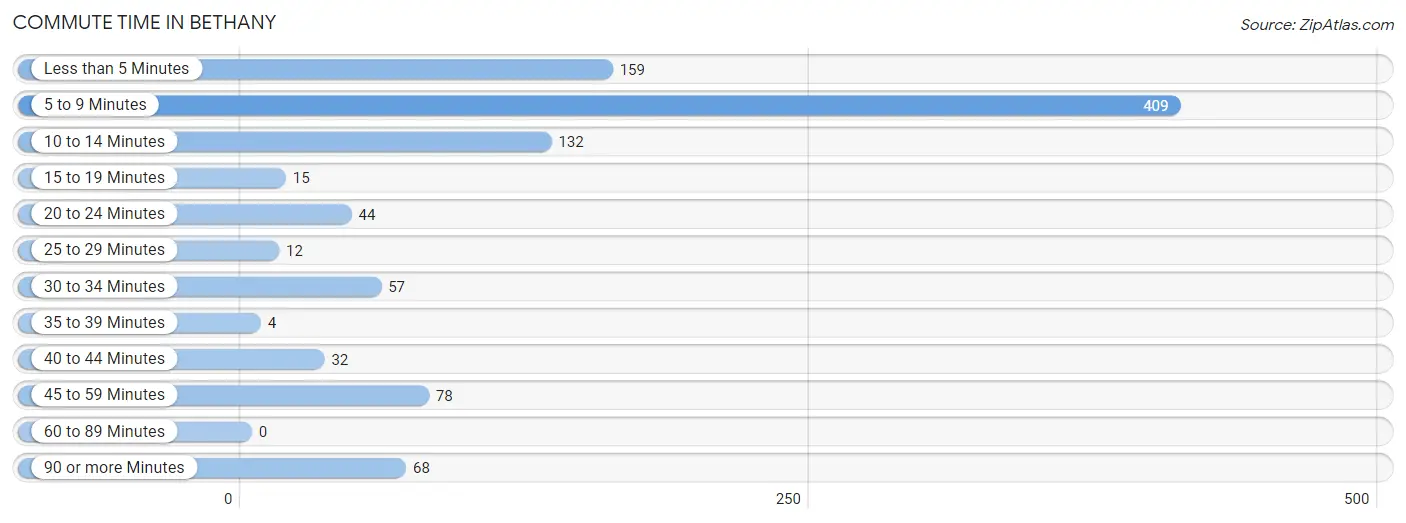
Commute Time in Bethany
The most frequently occuring commute durations in Bethany are 5 to 9 minutes (409 commuters, 40.5%), less than 5 minutes (159 commuters, 15.7%), and 10 to 14 minutes (132 commuters, 13.1%).
| Commute Time | # Commuters | % Commuters |
| Less than 5 Minutes | 159 | 15.7% |
| 5 to 9 Minutes | 409 | 40.5% |
| 10 to 14 Minutes | 132 | 13.1% |
| 15 to 19 Minutes | 15 | 1.5% |
| 20 to 24 Minutes | 44 | 4.4% |
| 25 to 29 Minutes | 12 | 1.2% |
| 30 to 34 Minutes | 57 | 5.6% |
| 35 to 39 Minutes | 4 | 0.4% |
| 40 to 44 Minutes | 32 | 3.2% |
| 45 to 59 Minutes | 78 | 7.7% |
| 60 to 89 Minutes | 0 | 0.0% |
| 90 or more Minutes | 68 | 6.7% |
Commute Time by Sex in Bethany
The most common commute times in Bethany are 5 to 9 minutes (219 commuters, 46.4%) for males and 5 to 9 minutes (190 commuters, 35.3%) for females.
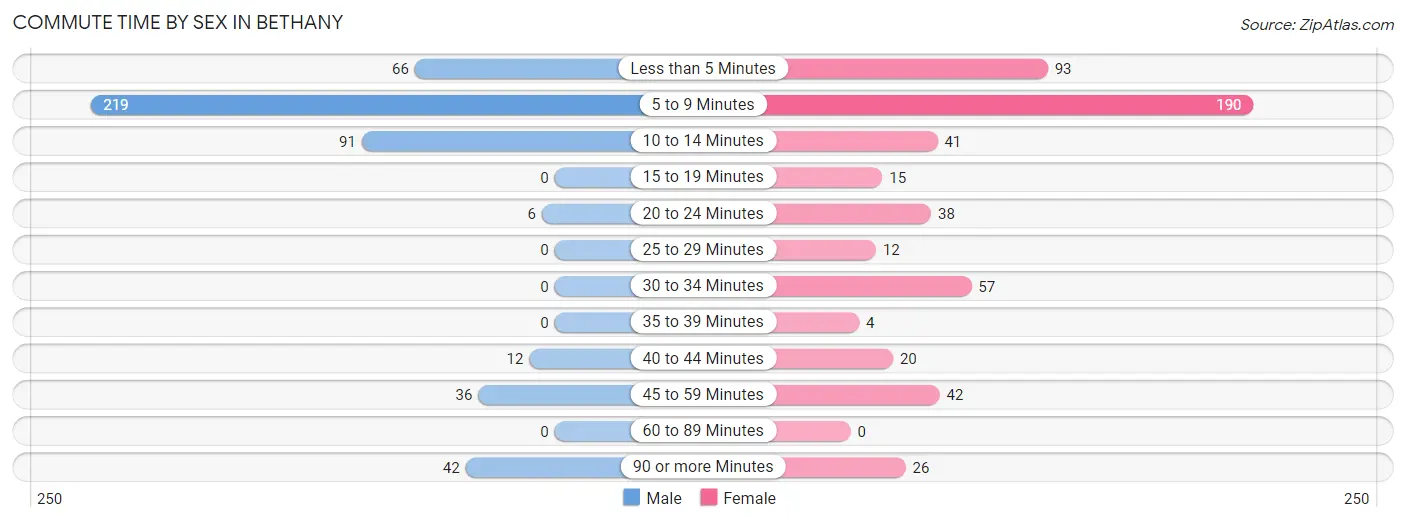
| Commute Time | Male | Female |
| Less than 5 Minutes | 66 (14.0%) | 93 (17.3%) |
| 5 to 9 Minutes | 219 (46.4%) | 190 (35.3%) |
| 10 to 14 Minutes | 91 (19.3%) | 41 (7.6%) |
| 15 to 19 Minutes | 0 (0.0%) | 15 (2.8%) |
| 20 to 24 Minutes | 6 (1.3%) | 38 (7.1%) |
| 25 to 29 Minutes | 0 (0.0%) | 12 (2.2%) |
| 30 to 34 Minutes | 0 (0.0%) | 57 (10.6%) |
| 35 to 39 Minutes | 0 (0.0%) | 4 (0.7%) |
| 40 to 44 Minutes | 12 (2.5%) | 20 (3.7%) |
| 45 to 59 Minutes | 36 (7.6%) | 42 (7.8%) |
| 60 to 89 Minutes | 0 (0.0%) | 0 (0.0%) |
| 90 or more Minutes | 42 (8.9%) | 26 (4.8%) |
Time of Departure to Work by Sex in Bethany
The most frequent times of departure to work in Bethany are 8:00 AM to 8:29 AM (116, 24.6%) for males and 6:30 AM to 6:59 AM (108, 20.1%) for females.
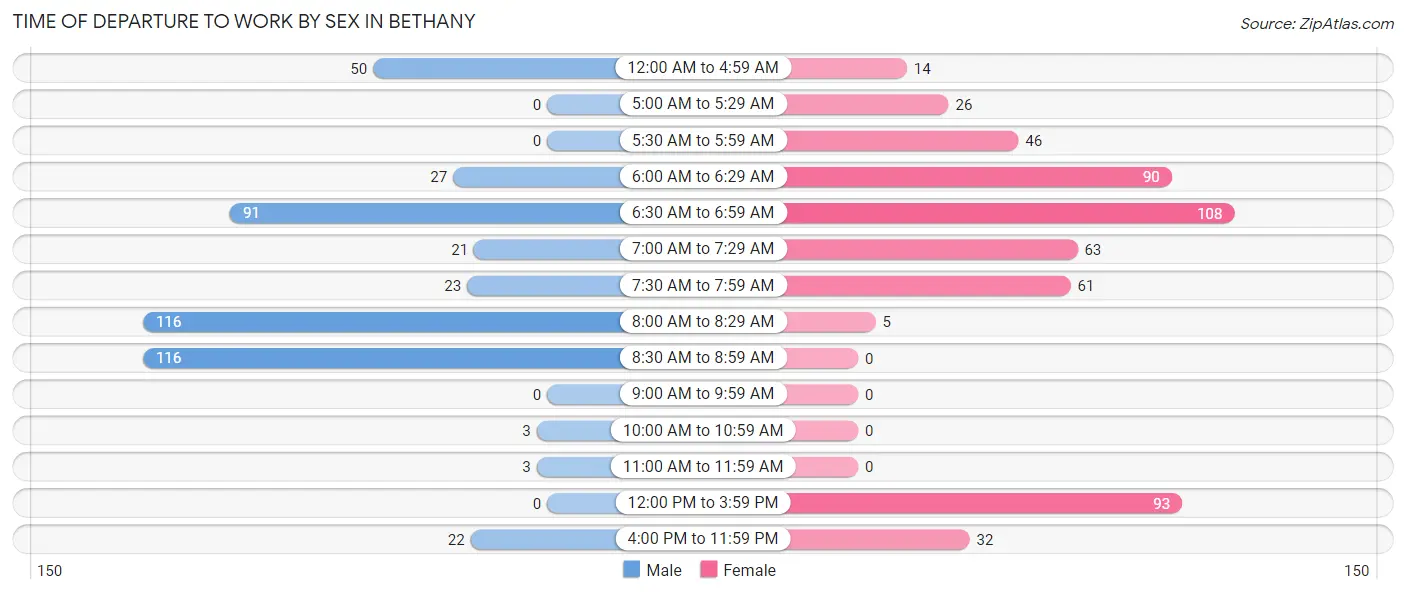
| Time of Departure | Male | Female |
| 12:00 AM to 4:59 AM | 50 (10.6%) | 14 (2.6%) |
| 5:00 AM to 5:29 AM | 0 (0.0%) | 26 (4.8%) |
| 5:30 AM to 5:59 AM | 0 (0.0%) | 46 (8.6%) |
| 6:00 AM to 6:29 AM | 27 (5.7%) | 90 (16.7%) |
| 6:30 AM to 6:59 AM | 91 (19.3%) | 108 (20.1%) |
| 7:00 AM to 7:29 AM | 21 (4.4%) | 63 (11.7%) |
| 7:30 AM to 7:59 AM | 23 (4.9%) | 61 (11.3%) |
| 8:00 AM to 8:29 AM | 116 (24.6%) | 5 (0.9%) |
| 8:30 AM to 8:59 AM | 116 (24.6%) | 0 (0.0%) |
| 9:00 AM to 9:59 AM | 0 (0.0%) | 0 (0.0%) |
| 10:00 AM to 10:59 AM | 3 (0.6%) | 0 (0.0%) |
| 11:00 AM to 11:59 AM | 3 (0.6%) | 0 (0.0%) |
| 12:00 PM to 3:59 PM | 0 (0.0%) | 93 (17.3%) |
| 4:00 PM to 11:59 PM | 22 (4.7%) | 32 (5.9%) |
| Total | 472 (100.0%) | 538 (100.0%) |
Housing Occupancy in Bethany
Occupancy by Ownership in Bethany
Of the total 1,129 dwellings in Bethany, owner-occupied units account for 672 (59.5%), while renter-occupied units make up 457 (40.5%).
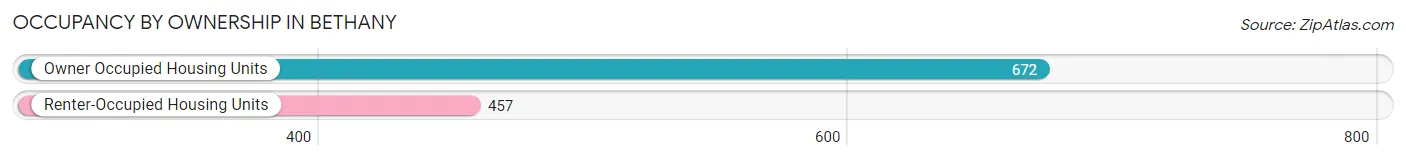
| Occupancy | # Housing Units | % Housing Units |
| Owner Occupied Housing Units | 672 | 59.5% |
| Renter-Occupied Housing Units | 457 | 40.5% |
| Total Occupied Housing Units | 1,129 | 100.0% |
Occupancy by Household Size in Bethany
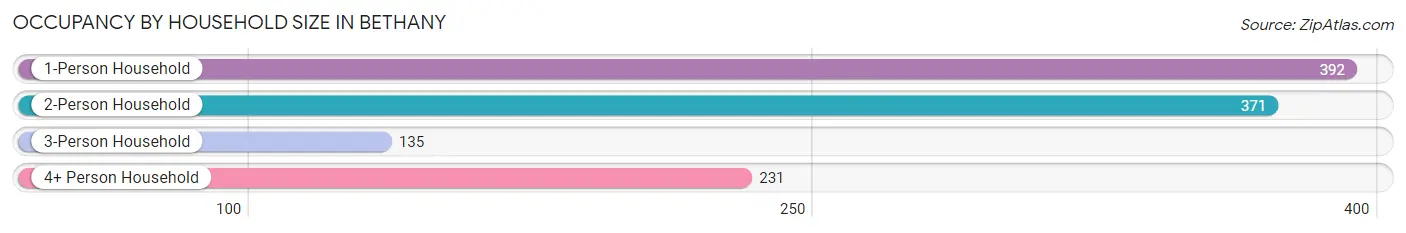
| Household Size | # Housing Units | % Housing Units |
| 1-Person Household | 392 | 34.7% |
| 2-Person Household | 371 | 32.9% |
| 3-Person Household | 135 | 12.0% |
| 4+ Person Household | 231 | 20.5% |
| Total Housing Units | 1,129 | 100.0% |
Occupancy by Ownership by Household Size in Bethany
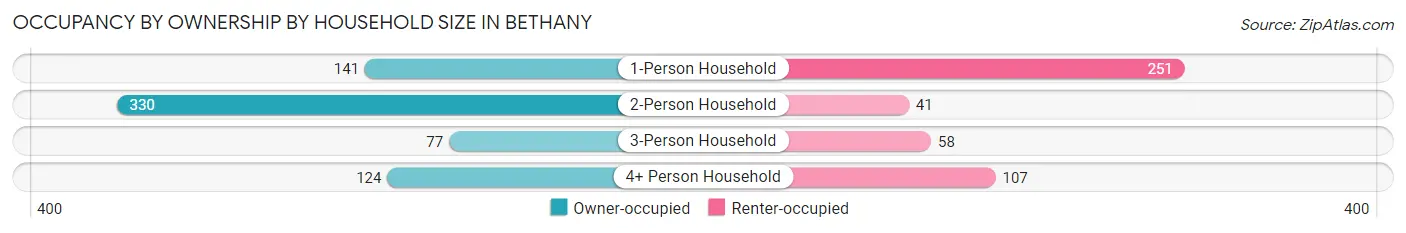
| Household Size | Owner-occupied | Renter-occupied |
| 1-Person Household | 141 (36.0%) | 251 (64.0%) |
| 2-Person Household | 330 (88.9%) | 41 (11.1%) |
| 3-Person Household | 77 (57.0%) | 58 (43.0%) |
| 4+ Person Household | 124 (53.7%) | 107 (46.3%) |
| Total Housing Units | 672 (59.5%) | 457 (40.5%) |
Occupancy by Educational Attainment in Bethany
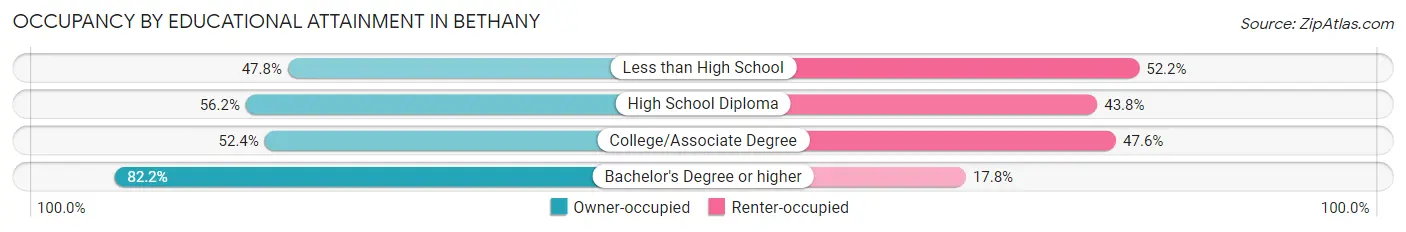
| Household Size | Owner-occupied | Renter-occupied |
| Less than High School | 77 (47.8%) | 84 (52.2%) |
| High School Diploma | 260 (56.2%) | 203 (43.8%) |
| College/Associate Degree | 141 (52.4%) | 128 (47.6%) |
| Bachelor's Degree or higher | 194 (82.2%) | 42 (17.8%) |
Occupancy by Age of Householder in Bethany
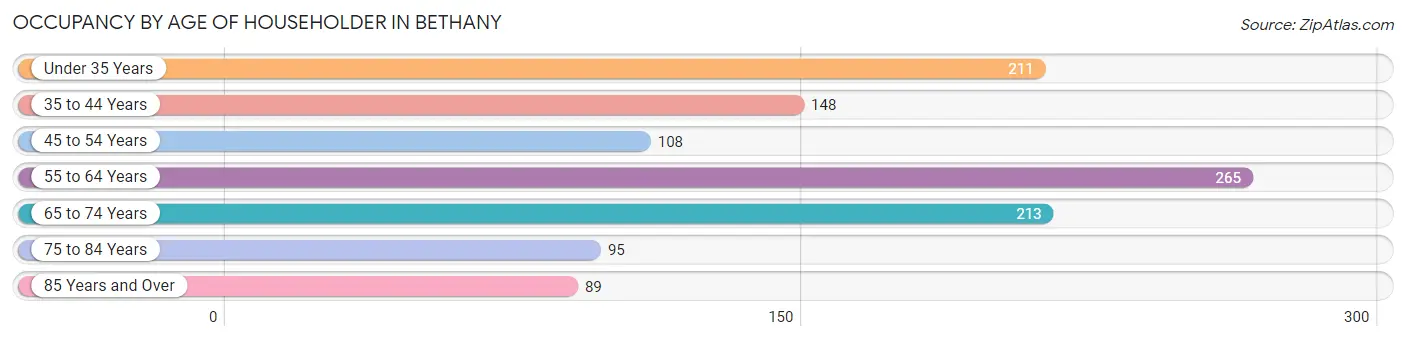
| Age Bracket | # Households | % Households |
| Under 35 Years | 211 | 18.7% |
| 35 to 44 Years | 148 | 13.1% |
| 45 to 54 Years | 108 | 9.6% |
| 55 to 64 Years | 265 | 23.5% |
| 65 to 74 Years | 213 | 18.9% |
| 75 to 84 Years | 95 | 8.4% |
| 85 Years and Over | 89 | 7.9% |
| Total | 1,129 | 100.0% |
Housing Finances in Bethany
Median Income by Occupancy in Bethany
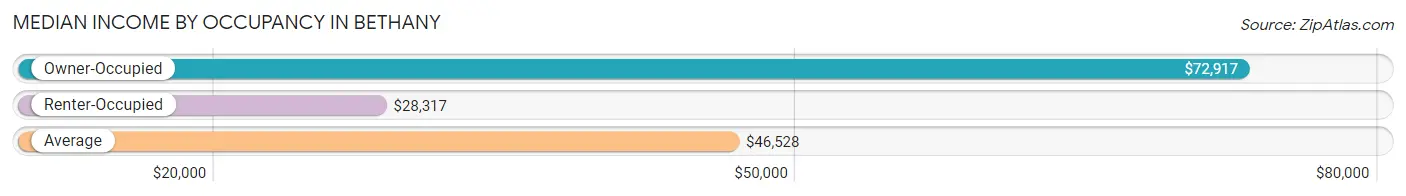
| Occupancy Type | # Households | Median Income |
| Owner-Occupied | 672 (59.5%) | $72,917 |
| Renter-Occupied | 457 (40.5%) | $28,317 |
| Average | 1,129 (100.0%) | $46,528 |
Occupancy by Householder Income Bracket in Bethany
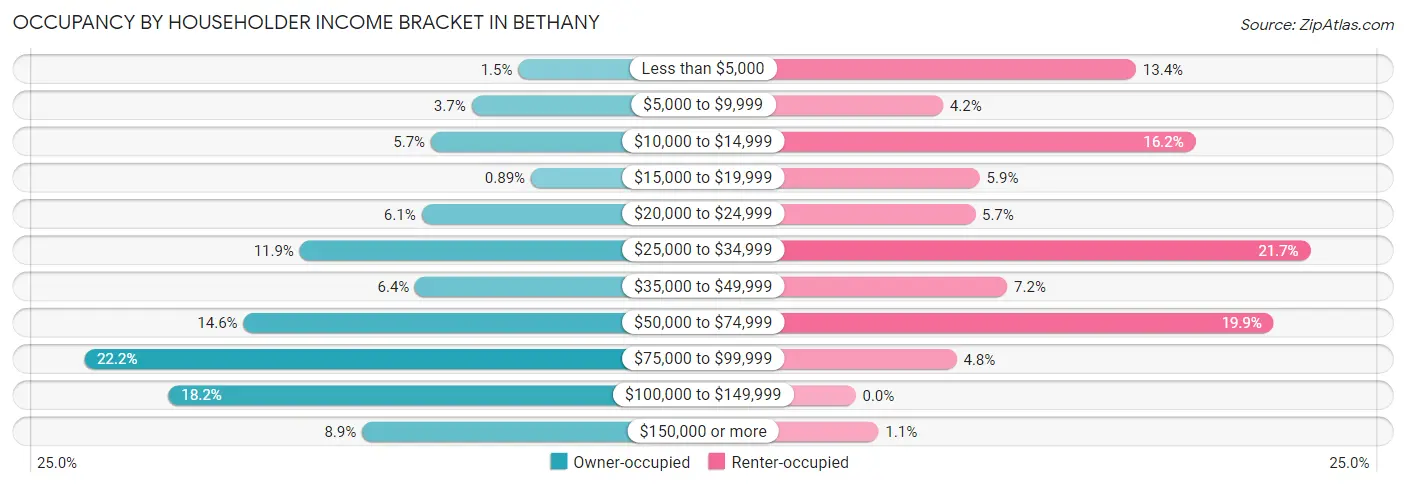
| Income Bracket | Owner-occupied | Renter-occupied |
| Less than $5,000 | 10 (1.5%) | 61 (13.4%) |
| $5,000 to $9,999 | 25 (3.7%) | 19 (4.2%) |
| $10,000 to $14,999 | 38 (5.7%) | 74 (16.2%) |
| $15,000 to $19,999 | 6 (0.9%) | 27 (5.9%) |
| $20,000 to $24,999 | 41 (6.1%) | 26 (5.7%) |
| $25,000 to $34,999 | 80 (11.9%) | 99 (21.7%) |
| $35,000 to $49,999 | 43 (6.4%) | 33 (7.2%) |
| $50,000 to $74,999 | 98 (14.6%) | 91 (19.9%) |
| $75,000 to $99,999 | 149 (22.2%) | 22 (4.8%) |
| $100,000 to $149,999 | 122 (18.1%) | 0 (0.0%) |
| $150,000 or more | 60 (8.9%) | 5 (1.1%) |
| Total | 672 (100.0%) | 457 (100.0%) |
Monthly Housing Cost Tiers in Bethany
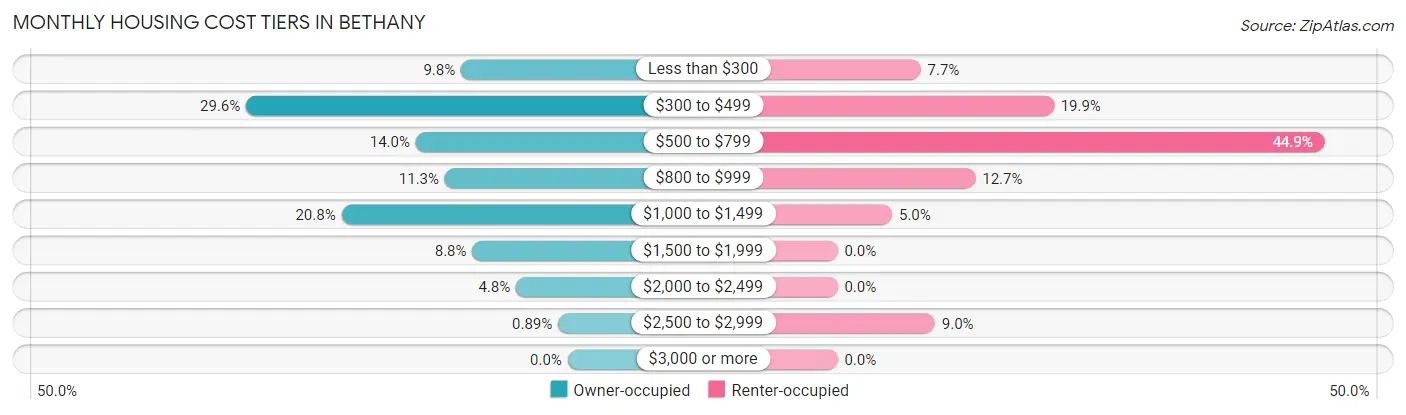
| Monthly Cost | Owner-occupied | Renter-occupied |
| Less than $300 | 66 (9.8%) | 35 (7.7%) |
| $300 to $499 | 199 (29.6%) | 91 (19.9%) |
| $500 to $799 | 94 (14.0%) | 205 (44.9%) |
| $800 to $999 | 76 (11.3%) | 58 (12.7%) |
| $1,000 to $1,499 | 140 (20.8%) | 23 (5.0%) |
| $1,500 to $1,999 | 59 (8.8%) | 0 (0.0%) |
| $2,000 to $2,499 | 32 (4.8%) | 0 (0.0%) |
| $2,500 to $2,999 | 6 (0.9%) | 41 (9.0%) |
| $3,000 or more | 0 (0.0%) | 0 (0.0%) |
| Total | 672 (100.0%) | 457 (100.0%) |
Physical Housing Characteristics in Bethany
Housing Structures in Bethany
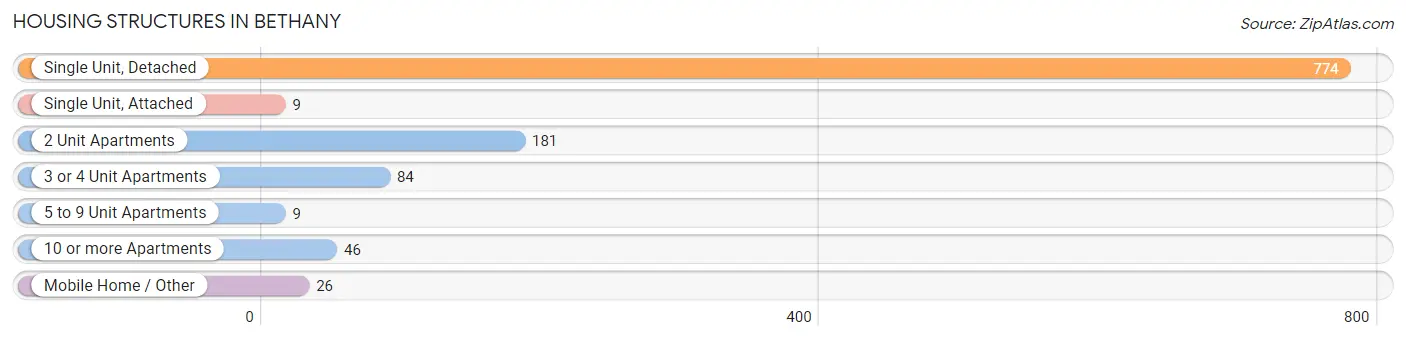
| Structure Type | # Housing Units | % Housing Units |
| Single Unit, Detached | 774 | 68.6% |
| Single Unit, Attached | 9 | 0.8% |
| 2 Unit Apartments | 181 | 16.0% |
| 3 or 4 Unit Apartments | 84 | 7.4% |
| 5 to 9 Unit Apartments | 9 | 0.8% |
| 10 or more Apartments | 46 | 4.1% |
| Mobile Home / Other | 26 | 2.3% |
| Total | 1,129 | 100.0% |
Housing Structures by Occupancy in Bethany
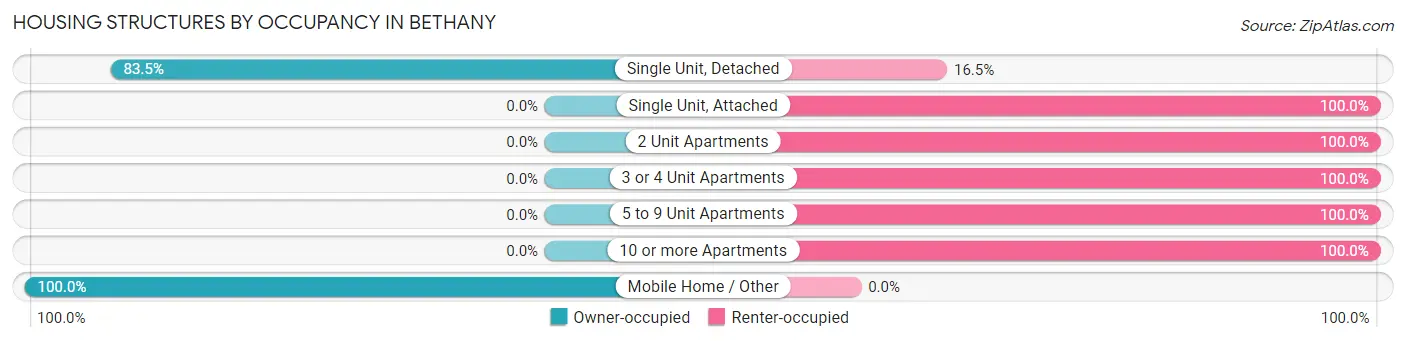
| Structure Type | Owner-occupied | Renter-occupied |
| Single Unit, Detached | 646 (83.5%) | 128 (16.5%) |
| Single Unit, Attached | 0 (0.0%) | 9 (100.0%) |
| 2 Unit Apartments | 0 (0.0%) | 181 (100.0%) |
| 3 or 4 Unit Apartments | 0 (0.0%) | 84 (100.0%) |
| 5 to 9 Unit Apartments | 0 (0.0%) | 9 (100.0%) |
| 10 or more Apartments | 0 (0.0%) | 46 (100.0%) |
| Mobile Home / Other | 26 (100.0%) | 0 (0.0%) |
| Total | 672 (59.5%) | 457 (40.5%) |
Housing Structures by Number of Rooms in Bethany
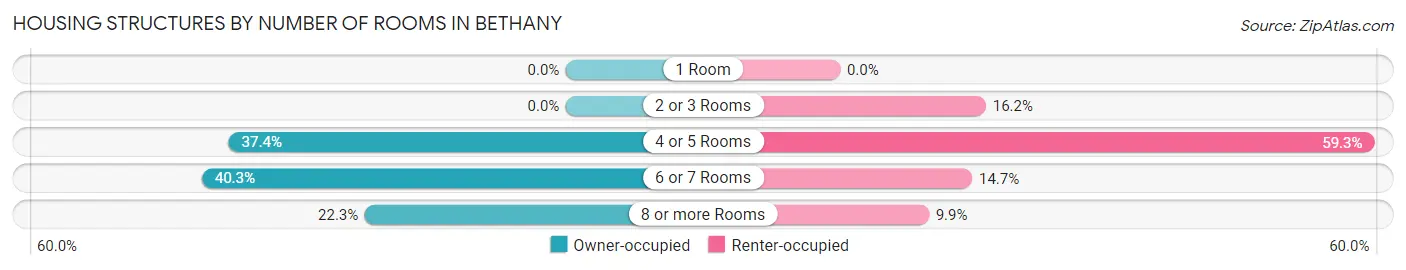
| Number of Rooms | Owner-occupied | Renter-occupied |
| 1 Room | 0 (0.0%) | 0 (0.0%) |
| 2 or 3 Rooms | 0 (0.0%) | 74 (16.2%) |
| 4 or 5 Rooms | 251 (37.3%) | 271 (59.3%) |
| 6 or 7 Rooms | 271 (40.3%) | 67 (14.7%) |
| 8 or more Rooms | 150 (22.3%) | 45 (9.9%) |
| Total | 672 (100.0%) | 457 (100.0%) |
Housing Structure by Heating Type in Bethany
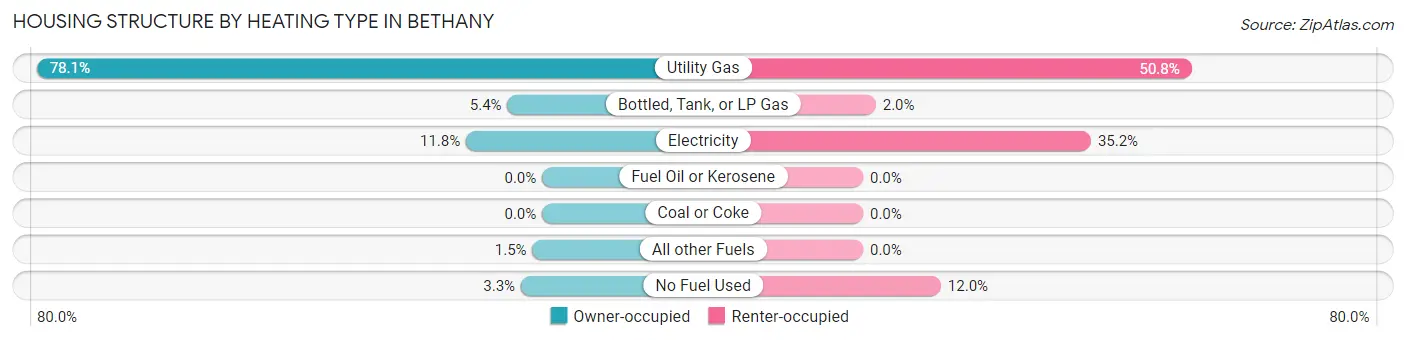
| Heating Type | Owner-occupied | Renter-occupied |
| Utility Gas | 525 (78.1%) | 232 (50.8%) |
| Bottled, Tank, or LP Gas | 36 (5.4%) | 9 (2.0%) |
| Electricity | 79 (11.8%) | 161 (35.2%) |
| Fuel Oil or Kerosene | 0 (0.0%) | 0 (0.0%) |
| Coal or Coke | 0 (0.0%) | 0 (0.0%) |
| All other Fuels | 10 (1.5%) | 0 (0.0%) |
| No Fuel Used | 22 (3.3%) | 55 (12.0%) |
| Total | 672 (100.0%) | 457 (100.0%) |
Household Vehicle Usage in Bethany
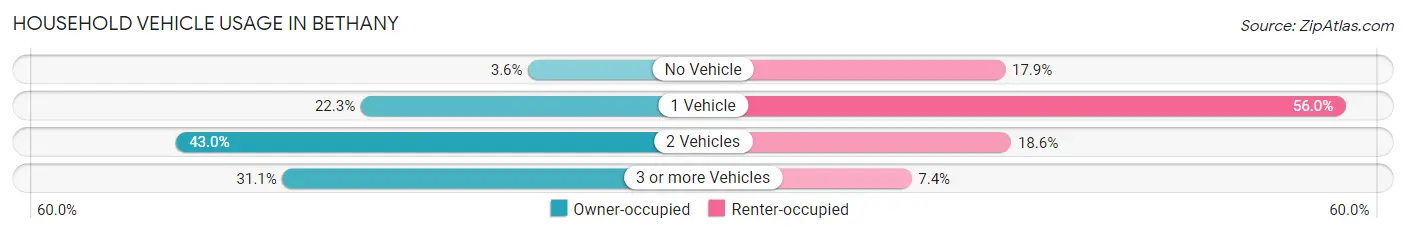
| Vehicles per Household | Owner-occupied | Renter-occupied |
| No Vehicle | 24 (3.6%) | 82 (17.9%) |
| 1 Vehicle | 150 (22.3%) | 256 (56.0%) |
| 2 Vehicles | 289 (43.0%) | 85 (18.6%) |
| 3 or more Vehicles | 209 (31.1%) | 34 (7.4%) |
| Total | 672 (100.0%) | 457 (100.0%) |
Real Estate & Mortgages in Bethany
Real Estate and Mortgage Overview in Bethany
| Characteristic | Without Mortgage | With Mortgage |
| Housing Units | 342 | 330 |
| Median Property Value | $111,800 | $117,900 |
| Median Household Income | $40,500 | $41 |
| Monthly Housing Costs | $428 | $0 |
| Real Estate Taxes | $1,025 | $14 |
Property Value by Mortgage Status in Bethany
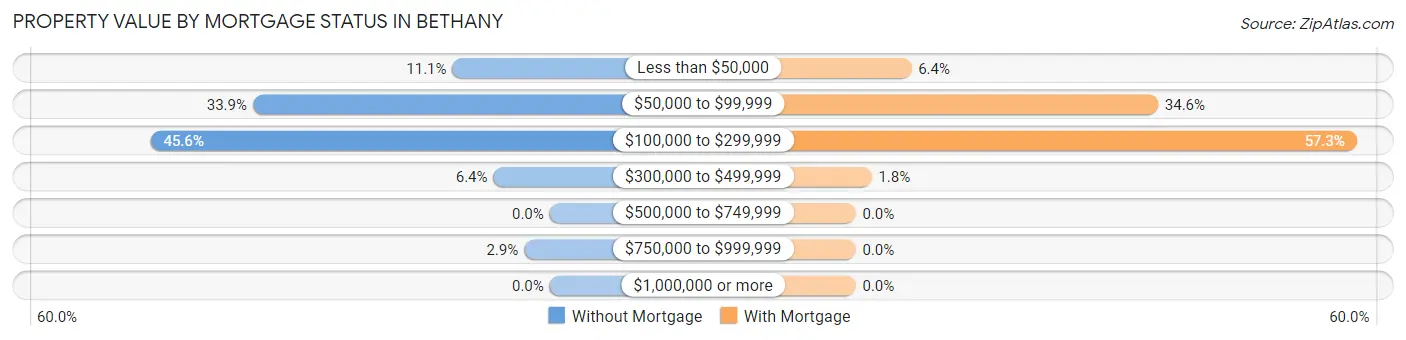
| Property Value | Without Mortgage | With Mortgage |
| Less than $50,000 | 38 (11.1%) | 21 (6.4%) |
| $50,000 to $99,999 | 116 (33.9%) | 114 (34.5%) |
| $100,000 to $299,999 | 156 (45.6%) | 189 (57.3%) |
| $300,000 to $499,999 | 22 (6.4%) | 6 (1.8%) |
| $500,000 to $749,999 | 0 (0.0%) | 0 (0.0%) |
| $750,000 to $999,999 | 10 (2.9%) | 0 (0.0%) |
| $1,000,000 or more | 0 (0.0%) | 0 (0.0%) |
| Total | 342 (100.0%) | 330 (100.0%) |
Household Income by Mortgage Status in Bethany
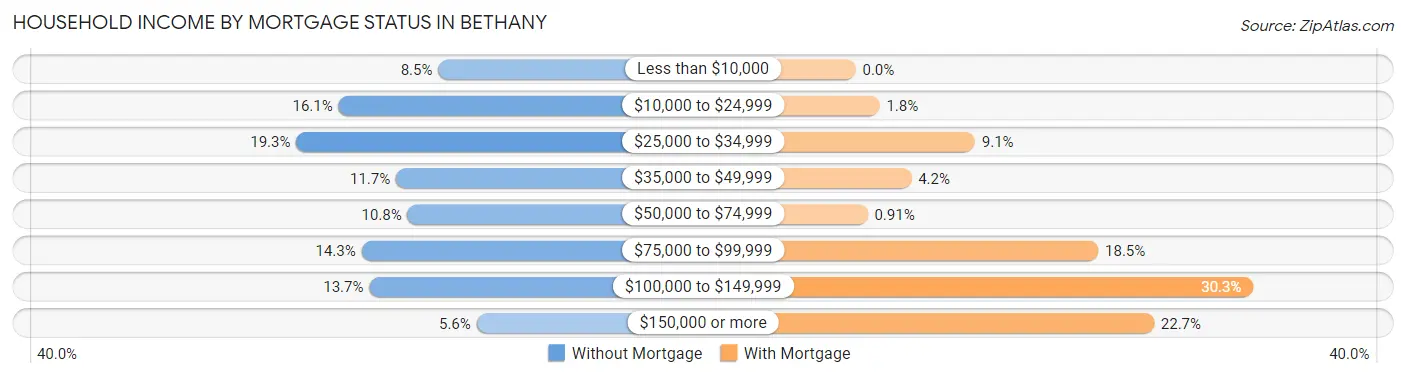
| Household Income | Without Mortgage | With Mortgage |
| Less than $10,000 | 29 (8.5%) | 0 (0.0%) |
| $10,000 to $24,999 | 55 (16.1%) | 6 (1.8%) |
| $25,000 to $34,999 | 66 (19.3%) | 30 (9.1%) |
| $35,000 to $49,999 | 40 (11.7%) | 14 (4.2%) |
| $50,000 to $74,999 | 37 (10.8%) | 3 (0.9%) |
| $75,000 to $99,999 | 49 (14.3%) | 61 (18.5%) |
| $100,000 to $149,999 | 47 (13.7%) | 100 (30.3%) |
| $150,000 or more | 19 (5.6%) | 75 (22.7%) |
| Total | 342 (100.0%) | 330 (100.0%) |
Property Value to Household Income Ratio in Bethany
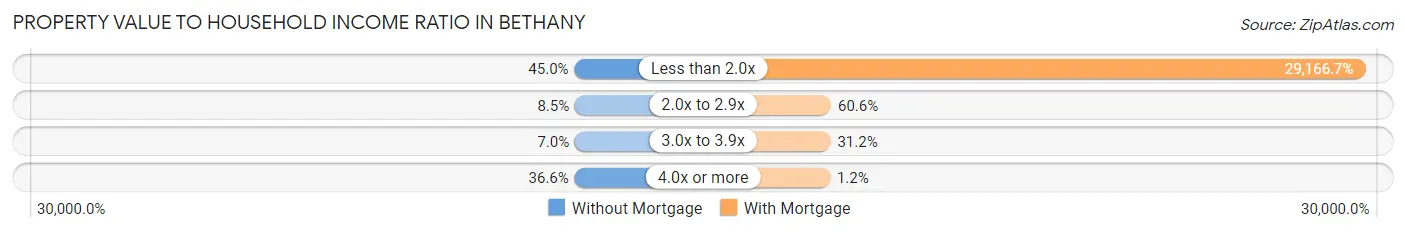
| Value-to-Income Ratio | Without Mortgage | With Mortgage |
| Less than 2.0x | 154 (45.0%) | 96,250 (29,166.7%) |
| 2.0x to 2.9x | 29 (8.5%) | 200 (60.6%) |
| 3.0x to 3.9x | 24 (7.0%) | 103 (31.2%) |
| 4.0x or more | 125 (36.5%) | 4 (1.2%) |
| Total | 342 (100.0%) | 330 (100.0%) |
Real Estate Taxes by Mortgage Status in Bethany
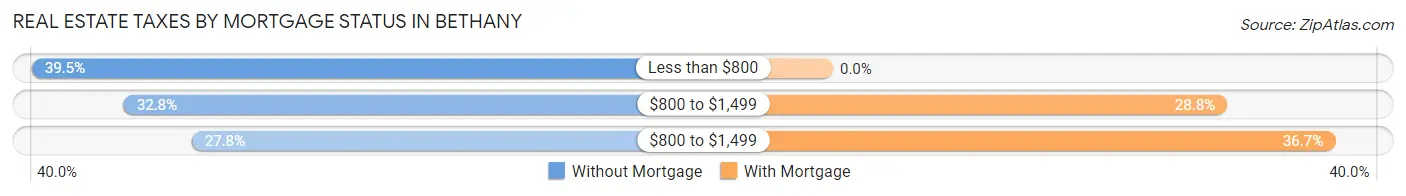
| Property Taxes | Without Mortgage | With Mortgage |
| Less than $800 | 135 (39.5%) | 0 (0.0%) |
| $800 to $1,499 | 112 (32.8%) | 95 (28.8%) |
| $800 to $1,499 | 95 (27.8%) | 121 (36.7%) |
| Total | 342 (100.0%) | 330 (100.0%) |
Health & Disability in Bethany
Health Insurance Coverage by Age in Bethany
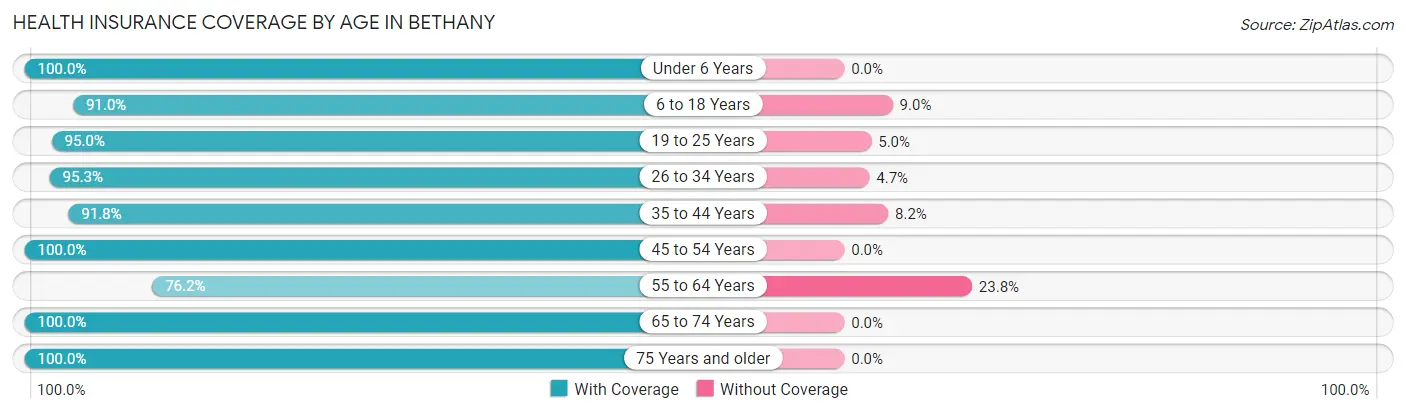
| Age Bracket | With Coverage | Without Coverage |
| Under 6 Years | 233 (100.0%) | 0 (0.0%) |
| 6 to 18 Years | 555 (91.0%) | 55 (9.0%) |
| 19 to 25 Years | 170 (95.0%) | 9 (5.0%) |
| 26 to 34 Years | 224 (95.3%) | 11 (4.7%) |
| 35 to 44 Years | 326 (91.8%) | 29 (8.2%) |
| 45 to 54 Years | 221 (100.0%) | 0 (0.0%) |
| 55 to 64 Years | 349 (76.2%) | 109 (23.8%) |
| 65 to 74 Years | 395 (100.0%) | 0 (0.0%) |
| 75 Years and older | 302 (100.0%) | 0 (0.0%) |
| Total | 2,775 (92.9%) | 213 (7.1%) |
Health Insurance Coverage by Citizenship Status in Bethany
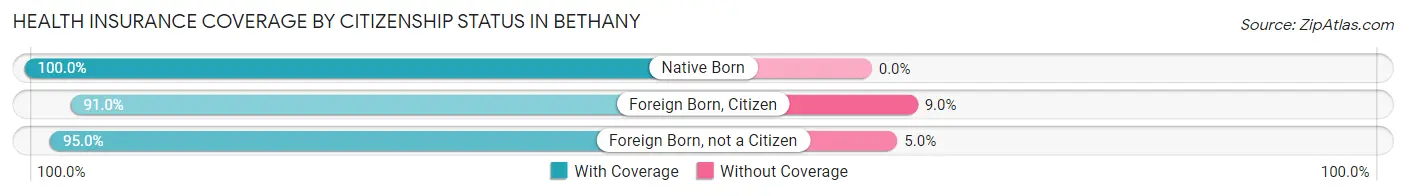
| Citizenship Status | With Coverage | Without Coverage |
| Native Born | 233 (100.0%) | 0 (0.0%) |
| Foreign Born, Citizen | 555 (91.0%) | 55 (9.0%) |
| Foreign Born, not a Citizen | 170 (95.0%) | 9 (5.0%) |
Health Insurance Coverage by Household Income in Bethany
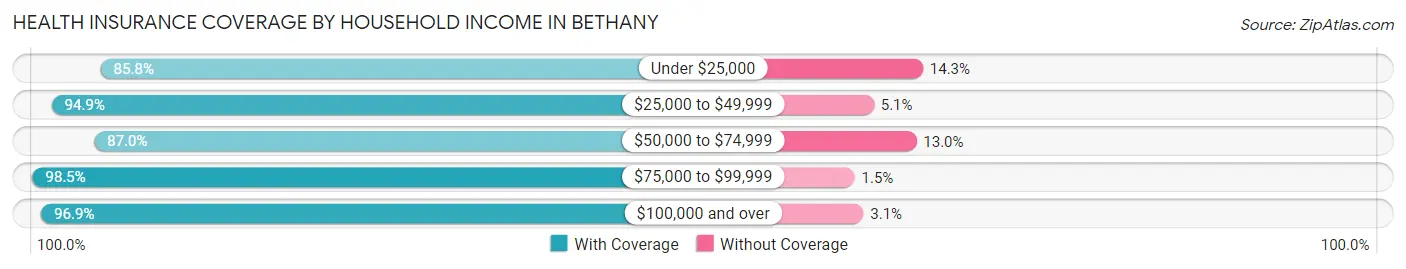
| Household Income | With Coverage | Without Coverage |
| Under $25,000 | 385 (85.8%) | 64 (14.2%) |
| $25,000 to $49,999 | 525 (94.9%) | 28 (5.1%) |
| $50,000 to $74,999 | 594 (87.0%) | 89 (13.0%) |
| $75,000 to $99,999 | 406 (98.5%) | 6 (1.5%) |
| $100,000 and over | 812 (96.9%) | 26 (3.1%) |
Public vs Private Health Insurance Coverage by Age in Bethany
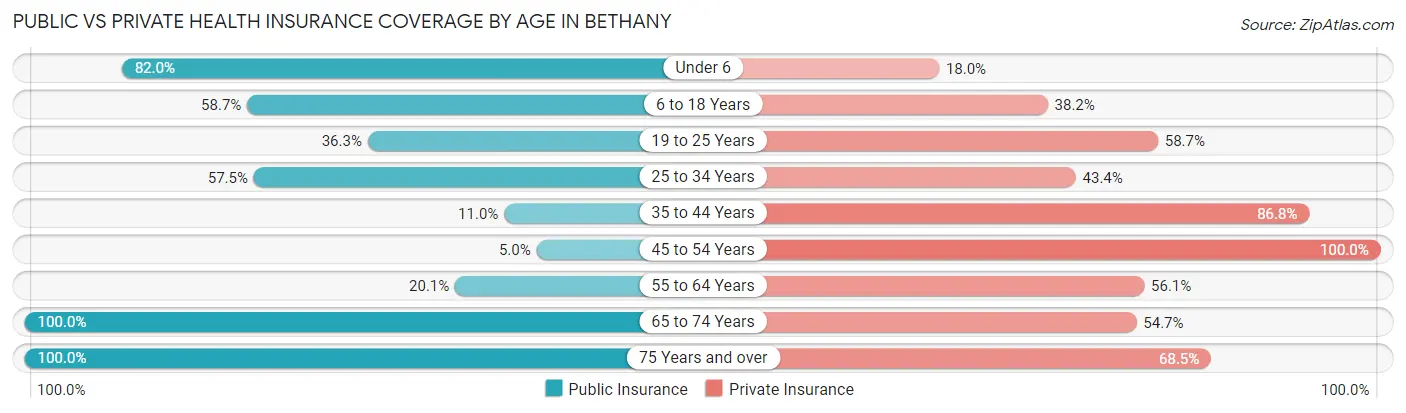
| Age Bracket | Public Insurance | Private Insurance |
| Under 6 | 191 (82.0%) | 42 (18.0%) |
| 6 to 18 Years | 358 (58.7%) | 233 (38.2%) |
| 19 to 25 Years | 65 (36.3%) | 105 (58.7%) |
| 25 to 34 Years | 135 (57.5%) | 102 (43.4%) |
| 35 to 44 Years | 39 (11.0%) | 308 (86.8%) |
| 45 to 54 Years | 11 (5.0%) | 221 (100.0%) |
| 55 to 64 Years | 92 (20.1%) | 257 (56.1%) |
| 65 to 74 Years | 395 (100.0%) | 216 (54.7%) |
| 75 Years and over | 302 (100.0%) | 207 (68.5%) |
| Total | 1,588 (53.1%) | 1,691 (56.6%) |
Disability Status by Sex by Age in Bethany
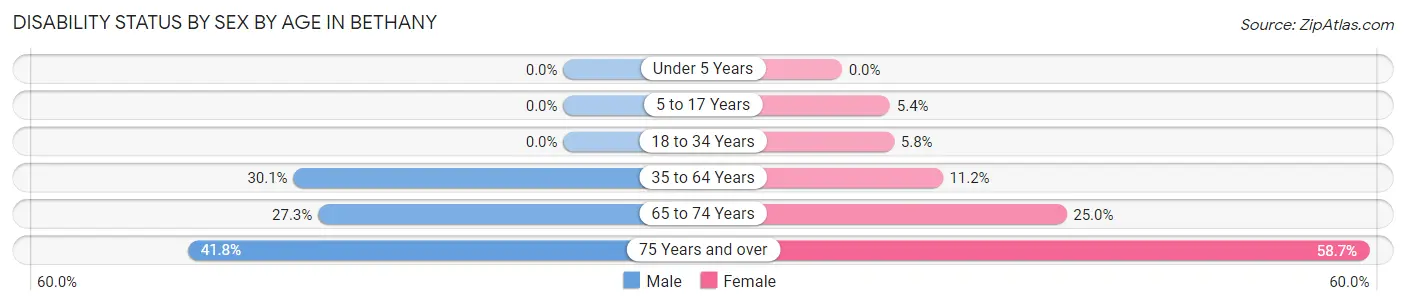
| Age Bracket | Male | Female |
| Under 5 Years | 0 (0.0%) | 0 (0.0%) |
| 5 to 17 Years | 0 (0.0%) | 19 (5.3%) |
| 18 to 34 Years | 0 (0.0%) | 13 (5.8%) |
| 35 to 64 Years | 150 (30.1%) | 60 (11.2%) |
| 65 to 74 Years | 62 (27.3%) | 42 (25.0%) |
| 75 Years and over | 23 (41.8%) | 145 (58.7%) |
Disability Class by Sex by Age in Bethany
Disability Class: Hearing Difficulty
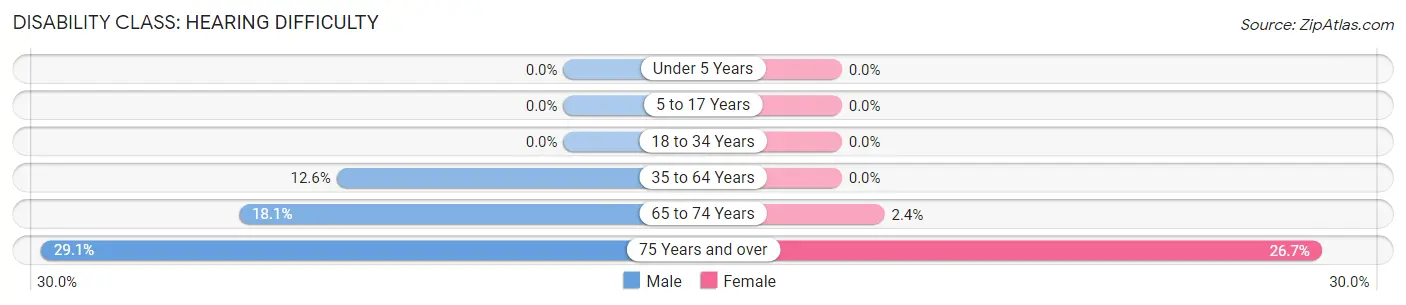
| Age Bracket | Male | Female |
| Under 5 Years | 0 (0.0%) | 0 (0.0%) |
| 5 to 17 Years | 0 (0.0%) | 0 (0.0%) |
| 18 to 34 Years | 0 (0.0%) | 0 (0.0%) |
| 35 to 64 Years | 63 (12.6%) | 0 (0.0%) |
| 65 to 74 Years | 41 (18.1%) | 4 (2.4%) |
| 75 Years and over | 16 (29.1%) | 66 (26.7%) |
Disability Class: Vision Difficulty
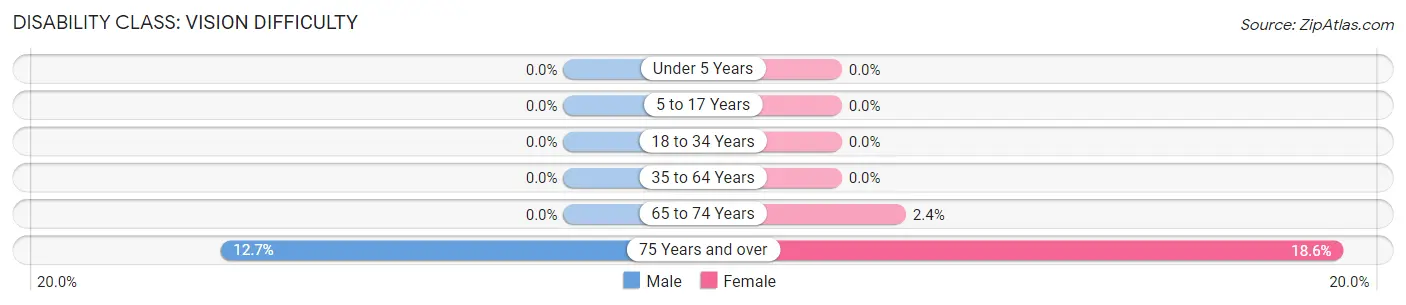
| Age Bracket | Male | Female |
| Under 5 Years | 0 (0.0%) | 0 (0.0%) |
| 5 to 17 Years | 0 (0.0%) | 0 (0.0%) |
| 18 to 34 Years | 0 (0.0%) | 0 (0.0%) |
| 35 to 64 Years | 0 (0.0%) | 0 (0.0%) |
| 65 to 74 Years | 0 (0.0%) | 4 (2.4%) |
| 75 Years and over | 7 (12.7%) | 46 (18.6%) |
Disability Class: Cognitive Difficulty
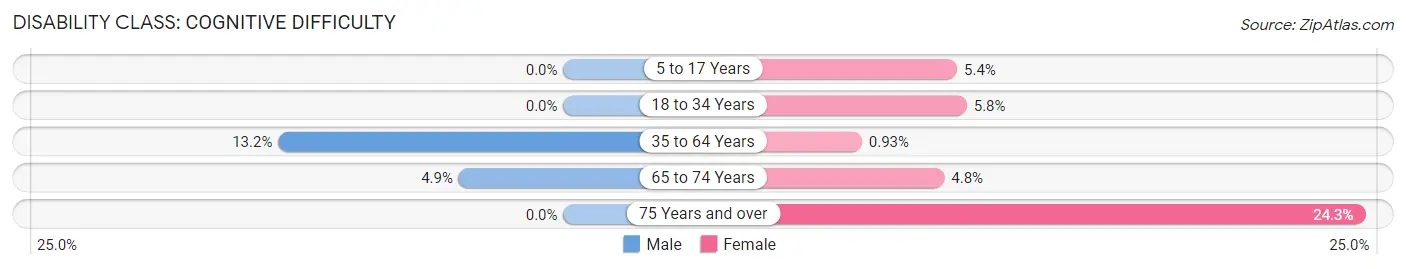
| Age Bracket | Male | Female |
| 5 to 17 Years | 0 (0.0%) | 19 (5.3%) |
| 18 to 34 Years | 0 (0.0%) | 13 (5.8%) |
| 35 to 64 Years | 66 (13.2%) | 5 (0.9%) |
| 65 to 74 Years | 11 (4.9%) | 8 (4.8%) |
| 75 Years and over | 0 (0.0%) | 60 (24.3%) |
Disability Class: Ambulatory Difficulty
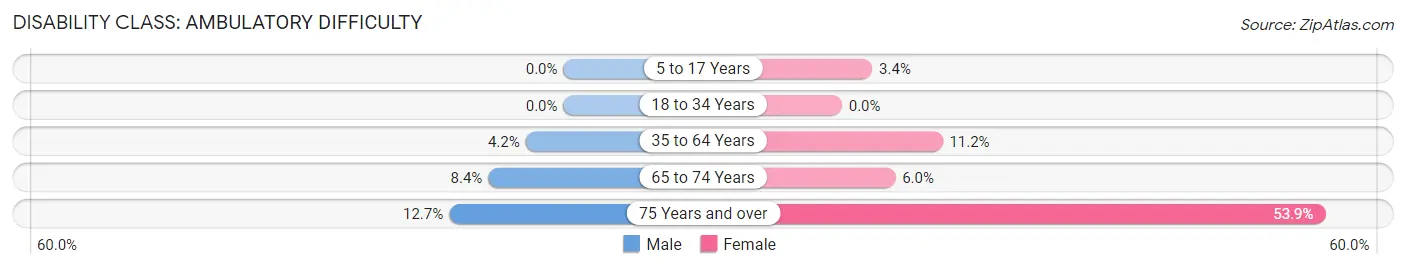
| Age Bracket | Male | Female |
| 5 to 17 Years | 0 (0.0%) | 12 (3.4%) |
| 18 to 34 Years | 0 (0.0%) | 0 (0.0%) |
| 35 to 64 Years | 21 (4.2%) | 60 (11.2%) |
| 65 to 74 Years | 19 (8.4%) | 10 (5.9%) |
| 75 Years and over | 7 (12.7%) | 133 (53.8%) |
Disability Class: Self-Care Difficulty
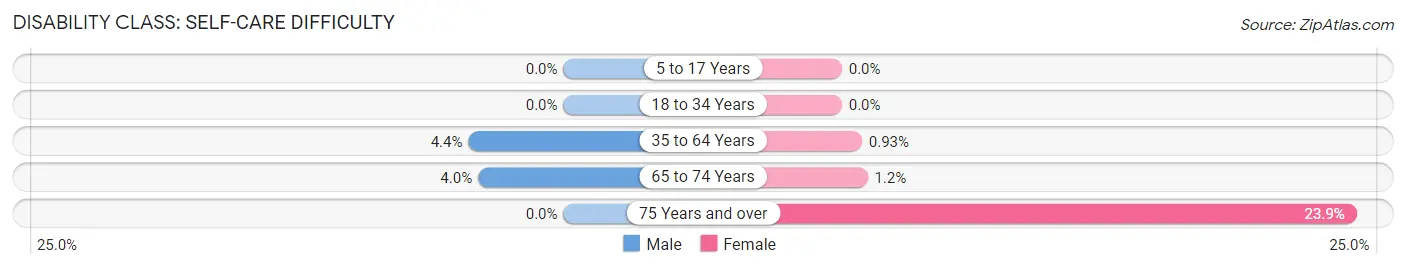
| Age Bracket | Male | Female |
| 5 to 17 Years | 0 (0.0%) | 0 (0.0%) |
| 18 to 34 Years | 0 (0.0%) | 0 (0.0%) |
| 35 to 64 Years | 22 (4.4%) | 5 (0.9%) |
| 65 to 74 Years | 9 (4.0%) | 2 (1.2%) |
| 75 Years and over | 0 (0.0%) | 59 (23.9%) |
Technology Access in Bethany
Computing Device Access in Bethany
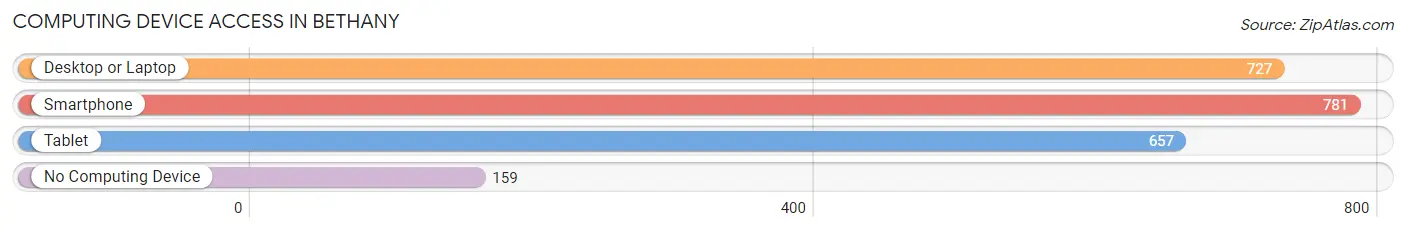
| Device Type | # Households | % Households |
| Desktop or Laptop | 727 | 64.4% |
| Smartphone | 781 | 69.2% |
| Tablet | 657 | 58.2% |
| No Computing Device | 159 | 14.1% |
| Total | 1,129 | 100.0% |
Internet Access in Bethany
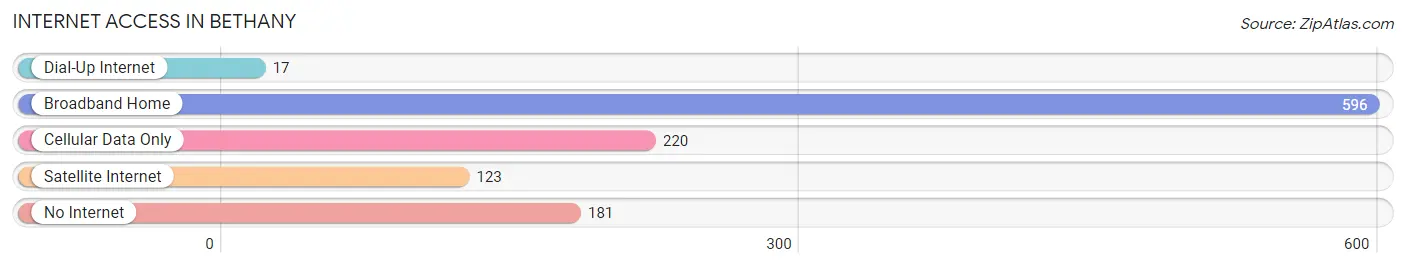
| Internet Type | # Households | % Households |
| Dial-Up Internet | 17 | 1.5% |
| Broadband Home | 596 | 52.8% |
| Cellular Data Only | 220 | 19.5% |
| Satellite Internet | 123 | 10.9% |
| No Internet | 181 | 16.0% |
| Total | 1,129 | 100.0% |
Bethany Summary
Bethany is a small city located in Harrison County, Missouri. It is situated in the northwest corner of the state, approximately 50 miles north of Kansas City. The city has a population of 2,717 people, according to the 2010 census.
Geography
Bethany is located in the northwest corner of Missouri, in Harrison County. It is situated on the banks of the Grand River, which flows through the city. The city is surrounded by rolling hills and farmland, and is located in the Ozark Plateau region. The climate is humid and subtropical, with hot summers and mild winters.
Economy
Bethany’s economy is largely based on agriculture and manufacturing. The city is home to several large agricultural operations, including a large hog farm and a large dairy farm. The city also has several manufacturing plants, including a plastics plant and a furniture factory. The city also has a number of small businesses, including restaurants, retail stores, and service providers.
Demographics
According to the 2010 census, Bethany has a population of 2,717 people. The population is predominantly white, with a small African American population. The median household income is $37,945, and the median age is 38. The city has a high rate of poverty, with 24.3% of the population living below the poverty line.
History
Bethany was founded in 1837 by a group of settlers from Kentucky. The city was named after the biblical town of Bethany, and was originally a farming community. The city was incorporated in 1867, and the first post office was established in 1868. The city grew slowly over the years, and by the early 1900s, it had become a thriving agricultural center. The city was also home to several manufacturing plants, including a furniture factory and a plastics plant.
In the late 20th century, the city began to experience a decline in population and economic activity. The city’s population decreased from 3,000 in the 1970s to 2,717 in 2010. Despite this decline, the city has managed to maintain its small-town charm and is still a popular destination for tourists and outdoor enthusiasts.
Conclusion
Bethany is a small city located in Harrison County, Missouri. It is situated in the northwest corner of the state, approximately 50 miles north of Kansas City. The city has a population of 2,717 people, according to the 2010 census. The economy is largely based on agriculture and manufacturing, and the city is home to several large agricultural operations and manufacturing plants. The population is predominantly white, with a small African American population. The city has a high rate of poverty, with 24.3% of the population living below the poverty line. Despite its decline in population and economic activity, the city has managed to maintain its small-town charm and is still a popular destination for tourists and outdoor enthusiasts.
Common Questions
What is Per Capita Income in Bethany?
Per Capita income in Bethany is $22,540.
What is the Median Family Income in Bethany?
Median Family Income in Bethany is $53,974.
What is the Median Household income in Bethany?
Median Household Income in Bethany is $46,528.
What is Income or Wage Gap in Bethany?
Income or Wage Gap in Bethany is 18.3%.
Women in Bethany earn 81.7 cents for every dollar earned by a man.
What is Inequality or Gini Index in Bethany?
Inequality or Gini Index in Bethany is 0.43.
What is the Total Population of Bethany?
Total Population of Bethany is 3,113.
What is the Total Male Population of Bethany?
Total Male Population of Bethany is 1,474.
What is the Total Female Population of Bethany?
Total Female Population of Bethany is 1,639.
What is the Ratio of Males per 100 Females in Bethany?
There are 89.93 Males per 100 Females in Bethany.
What is the Ratio of Females per 100 Males in Bethany?
There are 111.19 Females per 100 Males in Bethany.
What is the Median Population Age in Bethany?
Median Population Age in Bethany is 41.6 Years.
What is the Average Family Size in Bethany
Average Family Size in Bethany is 3.2 People.
What is the Average Household Size in Bethany
Average Household Size in Bethany is 2.6 People.
How Large is the Labor Force in Bethany?
There are 1,234 People in the Labor Forcein in Bethany.
What is the Percentage of People in the Labor Force in Bethany?
53.2% of People are in the Labor Force in Bethany.
What is the Unemployment Rate in Bethany?
Unemployment Rate in Bethany is 2.1%.