Warrenton, MO Map & Demographics
Warrenton Map
Warrenton Overview
$26,622
PER CAPITA INCOME
$69,401
AVG FAMILY INCOME
$62,096
AVG HOUSEHOLD INCOME
25.8%
WAGE / INCOME GAP [ % ]
74.2¢/ $1
WAGE / INCOME GAP [ $ ]
0.41
INEQUALITY / GINI INDEX
8,648
TOTAL POPULATION
3,734
MALE POPULATION
4,914
FEMALE POPULATION
75.99
MALES / 100 FEMALES
131.60
FEMALES / 100 MALES
32.0
MEDIAN AGE
3.3
AVG FAMILY SIZE
2.6
AVG HOUSEHOLD SIZE
4,354
LABOR FORCE [ PEOPLE ]
67.2%
PERCENT IN LABOR FORCE
5.2%
UNEMPLOYMENT RATE
Warrenton Zip Codes
Warrenton Area Codes
Income in Warrenton
Income Overview in Warrenton
Per Capita Income in Warrenton is $26,622, while median incomes of families and households are $69,401 and $62,096 respectively.
| Characteristic | Number | Measure |
| Per Capita Income | 8,648 | $26,622 |
| Median Family Income | 2,037 | $69,401 |
| Mean Family Income | 2,037 | $82,392 |
| Median Household Income | 3,201 | $62,096 |
| Mean Household Income | 3,201 | $72,076 |
| Income Deficit | 2,037 | $0 |
| Wage / Income Gap (%) | 8,648 | 25.81% |
| Wage / Income Gap ($) | 8,648 | 74.19¢ per $1 |
| Gini / Inequality Index | 8,648 | 0.41 |
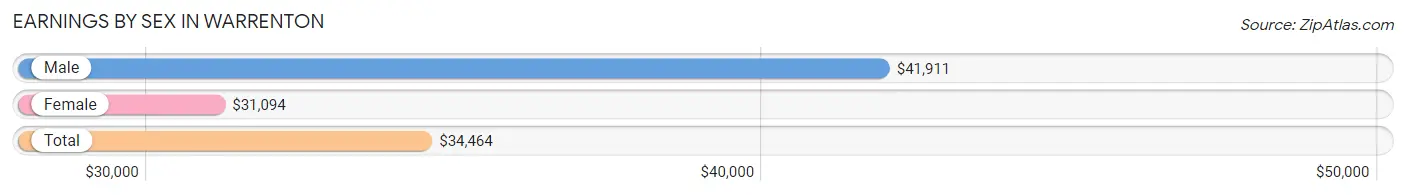
Earnings by Sex in Warrenton
Average Earnings in Warrenton are $34,464, $41,911 for men and $31,094 for women, a difference of 25.8%.
| Sex | Number | Average Earnings |
| Male | 2,075 (46.3%) | $41,911 |
| Female | 2,409 (53.7%) | $31,094 |
| Total | 4,484 (100.0%) | $34,464 |
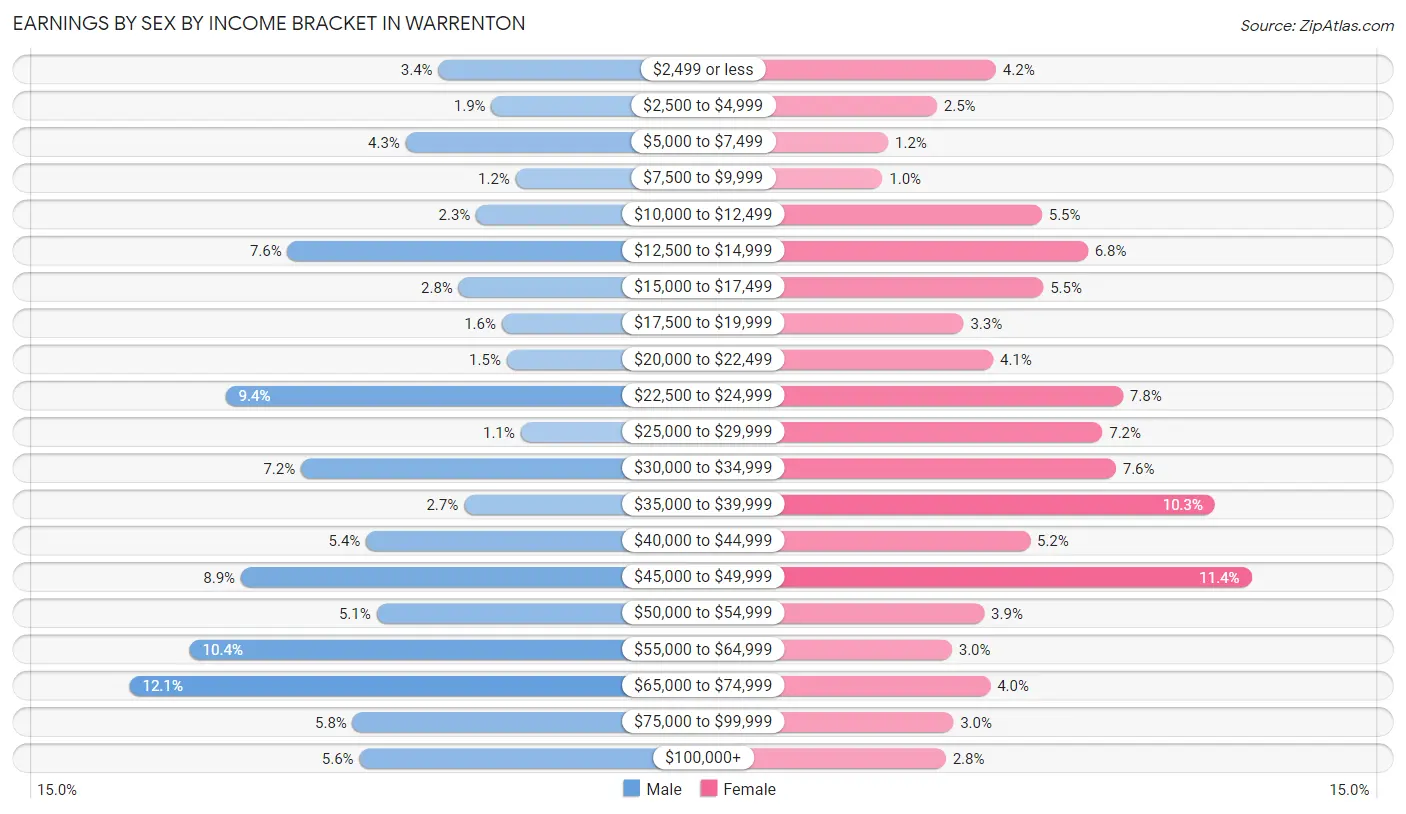
Earnings by Sex by Income Bracket in Warrenton
The most common earnings brackets in Warrenton are $65,000 to $74,999 for men (250 | 12.0%) and $45,000 to $49,999 for women (274 | 11.4%).
| Income | Male | Female |
| $2,499 or less | 70 (3.4%) | 101 (4.2%) |
| $2,500 to $4,999 | 39 (1.9%) | 61 (2.5%) |
| $5,000 to $7,499 | 89 (4.3%) | 28 (1.2%) |
| $7,500 to $9,999 | 25 (1.2%) | 24 (1.0%) |
| $10,000 to $12,499 | 48 (2.3%) | 132 (5.5%) |
| $12,500 to $14,999 | 158 (7.6%) | 163 (6.8%) |
| $15,000 to $17,499 | 58 (2.8%) | 133 (5.5%) |
| $17,500 to $19,999 | 33 (1.6%) | 79 (3.3%) |
| $20,000 to $22,499 | 30 (1.5%) | 99 (4.1%) |
| $22,500 to $24,999 | 194 (9.3%) | 187 (7.8%) |
| $25,000 to $29,999 | 22 (1.1%) | 173 (7.2%) |
| $30,000 to $34,999 | 150 (7.2%) | 182 (7.6%) |
| $35,000 to $39,999 | 55 (2.6%) | 249 (10.3%) |
| $40,000 to $44,999 | 112 (5.4%) | 124 (5.1%) |
| $45,000 to $49,999 | 185 (8.9%) | 274 (11.4%) |
| $50,000 to $54,999 | 106 (5.1%) | 93 (3.9%) |
| $55,000 to $64,999 | 215 (10.4%) | 71 (2.9%) |
| $65,000 to $74,999 | 250 (12.0%) | 97 (4.0%) |
| $75,000 to $99,999 | 120 (5.8%) | 72 (3.0%) |
| $100,000+ | 116 (5.6%) | 67 (2.8%) |
| Total | 2,075 (100.0%) | 2,409 (100.0%) |
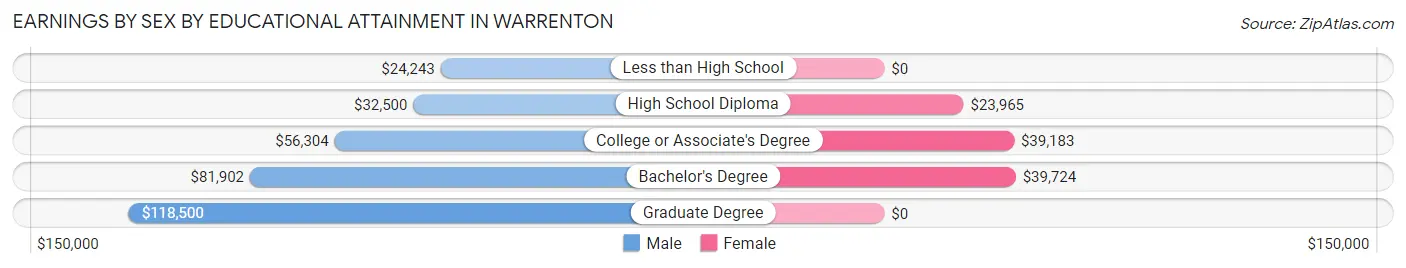
Earnings by Sex by Educational Attainment in Warrenton
Average earnings in Warrenton are $45,278 for men and $34,737 for women, a difference of 23.3%. Men with an educational attainment of graduate degree enjoy the highest average annual earnings of $118,500, while those with less than high school education earn the least with $24,243. Women with an educational attainment of bachelor's degree earn the most with the average annual earnings of $39,724, while those with high school diploma education have the smallest earnings of $23,965.
| Educational Attainment | Male Income | Female Income |
| Less than High School | $24,243 | $0 |
| High School Diploma | $32,500 | $23,965 |
| College or Associate's Degree | $56,304 | $39,183 |
| Bachelor's Degree | $81,902 | $39,724 |
| Graduate Degree | $118,500 | $0 |
| Total | $45,278 | $34,737 |
Family Income in Warrenton
Family Income Brackets in Warrenton
According to the Warrenton family income data, there are 581 families falling into the $50,000 to $74,999 income range, which is the most common income bracket and makes up 28.5% of all families. Conversely, the $15,000 to $24,999 income bracket is the least frequent group with only 18 families (0.9%) belonging to this category.
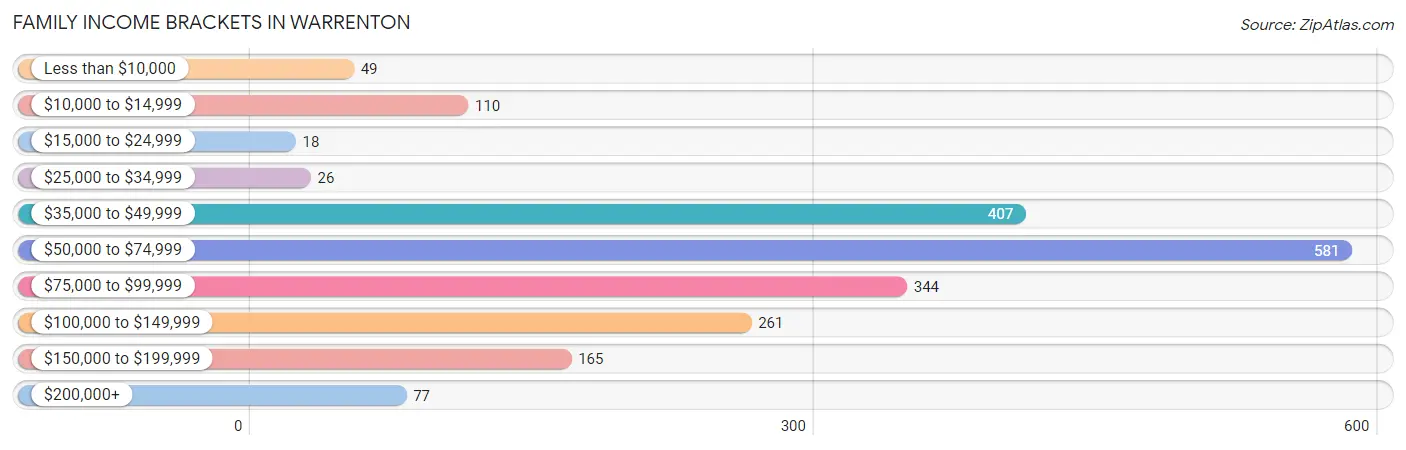
| Income Bracket | # Families | % Families |
| Less than $10,000 | 49 | 2.4% |
| $10,000 to $14,999 | 110 | 5.4% |
| $15,000 to $24,999 | 18 | 0.9% |
| $25,000 to $34,999 | 26 | 1.3% |
| $35,000 to $49,999 | 407 | 20.0% |
| $50,000 to $74,999 | 581 | 28.5% |
| $75,000 to $99,999 | 344 | 16.9% |
| $100,000 to $149,999 | 261 | 12.8% |
| $150,000 to $199,999 | 165 | 8.1% |
| $200,000+ | 77 | 3.8% |
Family Income by Famaliy Size in Warrenton
6-person families (94 | 4.6%) account for the highest median family income in Warrenton with $106,250 per family, while 2-person families (819 | 40.2%) have the highest median income of $33,860 per family member.
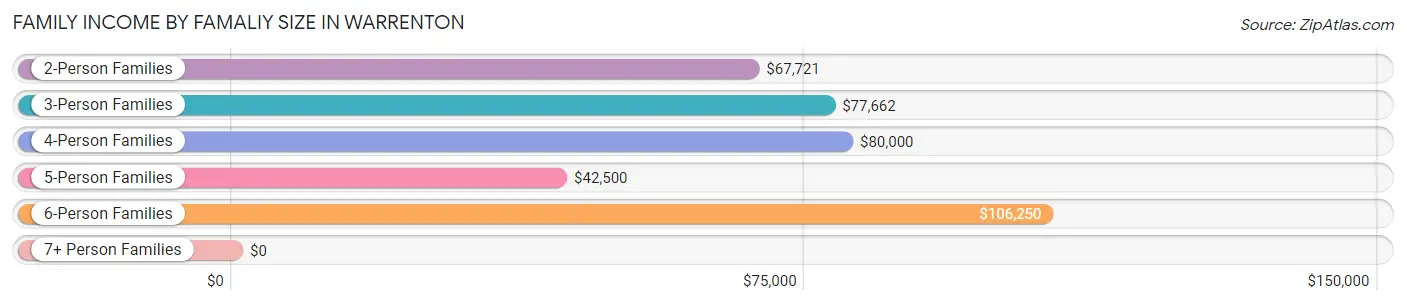
| Income Bracket | # Families | Median Income |
| 2-Person Families | 819 (40.2%) | $67,721 |
| 3-Person Families | 483 (23.7%) | $77,662 |
| 4-Person Families | 410 (20.1%) | $80,000 |
| 5-Person Families | 152 (7.5%) | $42,500 |
| 6-Person Families | 94 (4.6%) | $106,250 |
| 7+ Person Families | 79 (3.9%) | $0 |
| Total | 2,037 (100.0%) | $69,401 |
Family Income by Number of Earners in Warrenton
The median family income in Warrenton is $69,401, with families comprising 3+ earners (258) having the highest median family income of $148,750, while families with 1 earner (554) have the lowest median family income of $39,375, accounting for 12.7% and 27.2% of families, respectively.
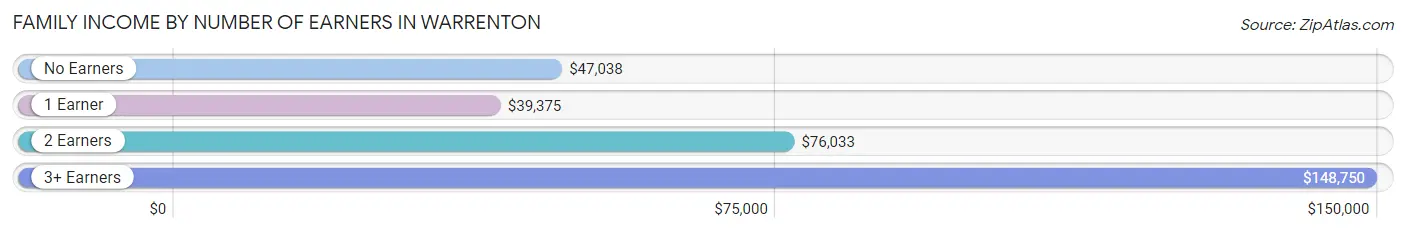
| Number of Earners | # Families | Median Income |
| No Earners | 270 (13.3%) | $47,038 |
| 1 Earner | 554 (27.2%) | $39,375 |
| 2 Earners | 955 (46.9%) | $76,033 |
| 3+ Earners | 258 (12.7%) | $148,750 |
| Total | 2,037 (100.0%) | $69,401 |
Household Income in Warrenton
Household Income Brackets in Warrenton
With 605 households falling in the category, the $75,000 to $99,999 income range is the most frequent in Warrenton, accounting for 18.9% of all households. In contrast, only 96 households (3.0%) fall into the $25,000 to $34,999 income bracket, making it the least populous group.
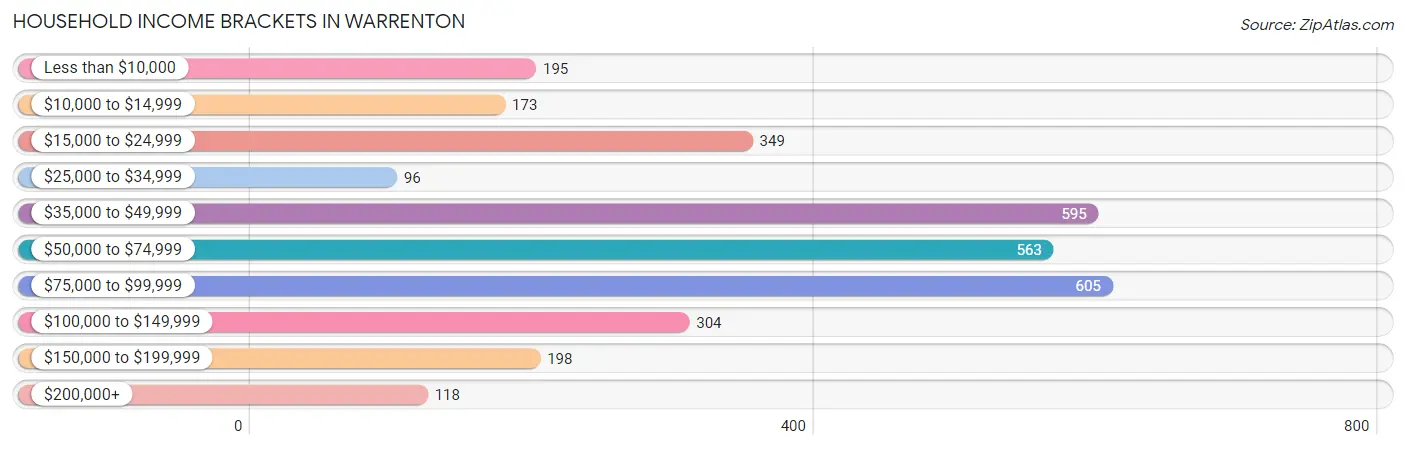
| Income Bracket | # Households | % Households |
| Less than $10,000 | 195 | 6.1% |
| $10,000 to $14,999 | 173 | 5.4% |
| $15,000 to $24,999 | 349 | 10.9% |
| $25,000 to $34,999 | 96 | 3.0% |
| $35,000 to $49,999 | 595 | 18.6% |
| $50,000 to $74,999 | 563 | 17.6% |
| $75,000 to $99,999 | 605 | 18.9% |
| $100,000 to $149,999 | 304 | 9.5% |
| $150,000 to $199,999 | 198 | 6.2% |
| $200,000+ | 118 | 3.7% |
Household Income by Householder Age in Warrenton
The median household income in Warrenton is $62,096, with the highest median household income of $74,444 found in the 25 to 44 years age bracket for the primary householder. A total of 1,328 households (41.5%) fall into this category. Meanwhile, the 65+ years age bracket for the primary householder has the lowest median household income of $45,504, with 763 households (23.8%) in this group.
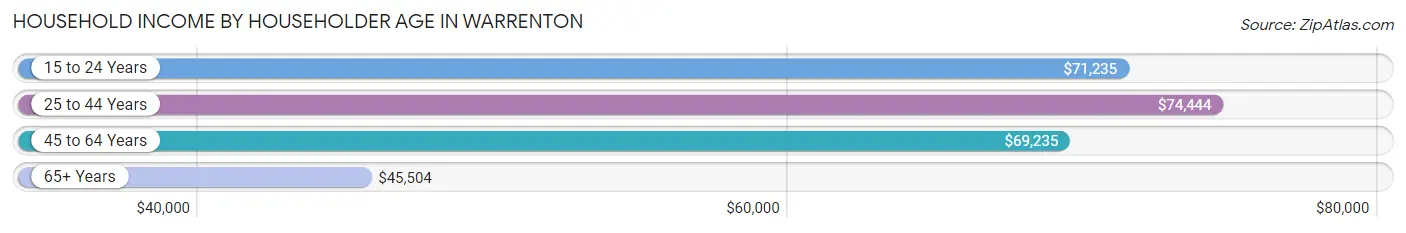
| Income Bracket | # Households | Median Income |
| 15 to 24 Years | 122 (3.8%) | $71,235 |
| 25 to 44 Years | 1,328 (41.5%) | $74,444 |
| 45 to 64 Years | 988 (30.9%) | $69,235 |
| 65+ Years | 763 (23.8%) | $45,504 |
| Total | 3,201 (100.0%) | $62,096 |
Poverty in Warrenton
Income Below Poverty by Sex and Age in Warrenton
With 18.6% poverty level for males and 11.5% for females among the residents of Warrenton, 16 and 17 year old males and 5 year old females are the most vulnerable to poverty, with 82 males (75.2%) and 31 females (75.6%) in their respective age groups living below the poverty level.
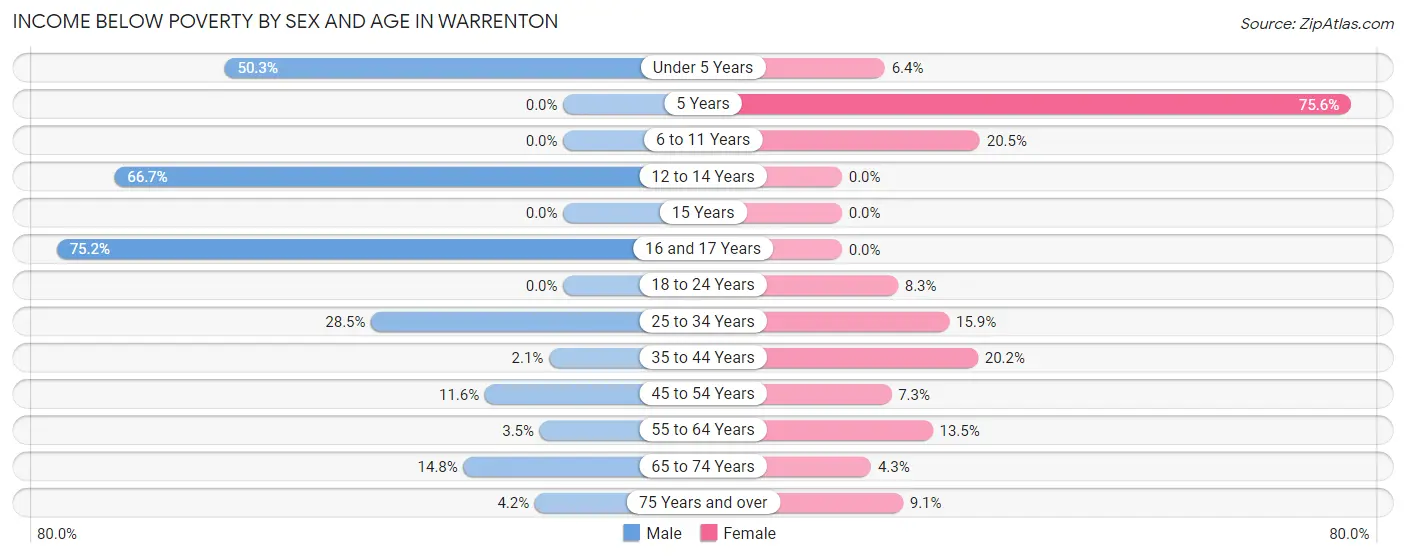
| Age Bracket | Male | Female |
| Under 5 Years | 164 (50.3%) | 22 (6.4%) |
| 5 Years | 0 (0.0%) | 31 (75.6%) |
| 6 to 11 Years | 0 (0.0%) | 92 (20.5%) |
| 12 to 14 Years | 122 (66.7%) | 0 (0.0%) |
| 15 Years | 0 (0.0%) | 0 (0.0%) |
| 16 and 17 Years | 82 (75.2%) | 0 (0.0%) |
| 18 to 24 Years | 0 (0.0%) | 36 (8.3%) |
| 25 to 34 Years | 197 (28.5%) | 118 (15.9%) |
| 35 to 44 Years | 10 (2.1%) | 108 (20.2%) |
| 45 to 54 Years | 52 (11.6%) | 43 (7.3%) |
| 55 to 64 Years | 9 (3.5%) | 52 (13.5%) |
| 65 to 74 Years | 24 (14.8%) | 12 (4.3%) |
| 75 Years and over | 10 (4.2%) | 46 (9.1%) |
| Total | 670 (18.6%) | 560 (11.5%) |
Income Above Poverty by Sex and Age in Warrenton
According to the poverty statistics in Warrenton, males aged 5 years and females aged 12 to 14 years are the age groups that are most secure financially, with 100.0% of males and 100.0% of females in these age groups living above the poverty line.
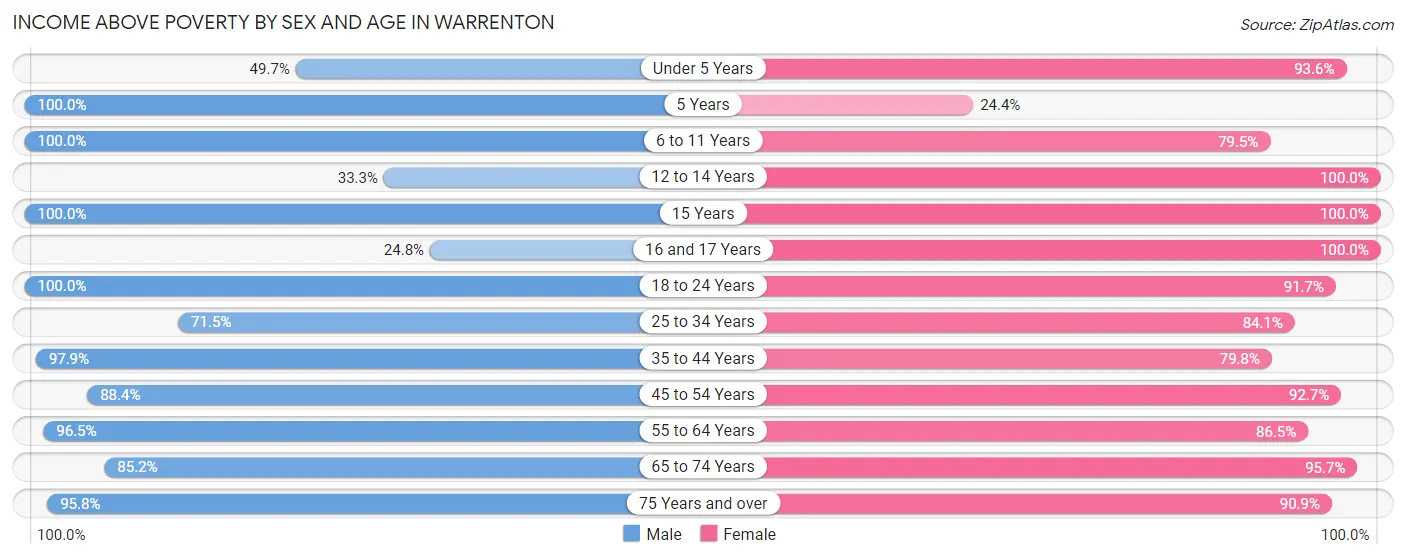
| Age Bracket | Male | Female |
| Under 5 Years | 162 (49.7%) | 323 (93.6%) |
| 5 Years | 73 (100.0%) | 10 (24.4%) |
| 6 to 11 Years | 283 (100.0%) | 357 (79.5%) |
| 12 to 14 Years | 61 (33.3%) | 351 (100.0%) |
| 15 Years | 33 (100.0%) | 85 (100.0%) |
| 16 and 17 Years | 27 (24.8%) | 122 (100.0%) |
| 18 to 24 Years | 315 (100.0%) | 397 (91.7%) |
| 25 to 34 Years | 494 (71.5%) | 623 (84.1%) |
| 35 to 44 Years | 466 (97.9%) | 427 (79.8%) |
| 45 to 54 Years | 395 (88.4%) | 543 (92.7%) |
| 55 to 64 Years | 249 (96.5%) | 334 (86.5%) |
| 65 to 74 Years | 138 (85.2%) | 265 (95.7%) |
| 75 Years and over | 228 (95.8%) | 462 (90.9%) |
| Total | 2,924 (81.4%) | 4,299 (88.5%) |
Income Below Poverty Among Married-Couple Families in Warrenton
The poverty statistics for married-couple families in Warrenton show that 0.7% or 10 of the total 1,475 families live below the poverty line. Families with no children have the highest poverty rate of 1.3%, comprising of 10 families. On the other hand, families with 1 or 2 children have the lowest poverty rate of 0.0%, which includes 0 families.
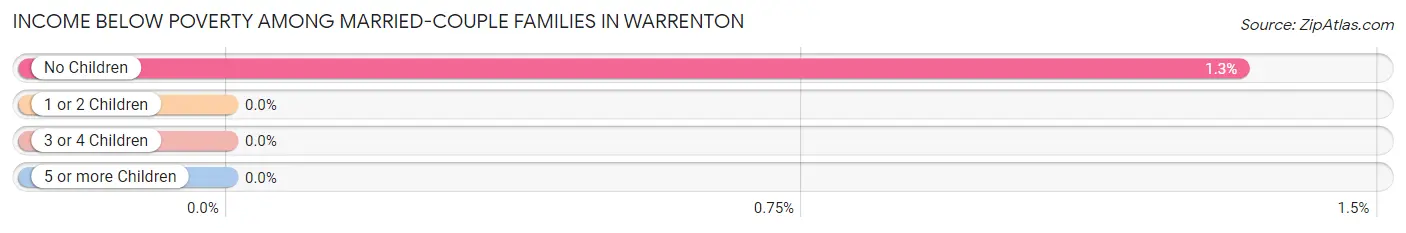
| Children | Above Poverty | Below Poverty |
| No Children | 749 (98.7%) | 10 (1.3%) |
| 1 or 2 Children | 470 (100.0%) | 0 (0.0%) |
| 3 or 4 Children | 174 (100.0%) | 0 (0.0%) |
| 5 or more Children | 72 (100.0%) | 0 (0.0%) |
| Total | 1,465 (99.3%) | 10 (0.7%) |
Income Below Poverty Among Single-Parent Households in Warrenton
According to the poverty data in Warrenton, 45.4% or 49 single-father households and 27.8% or 126 single-mother households are living below the poverty line. Among single-father households, those with 3 or 4 children have the highest poverty rate, with 49 households (90.7%) experiencing poverty. Likewise, among single-mother households, those with 3 or 4 children have the highest poverty rate, with 61 households (100.0%) falling below the poverty line.
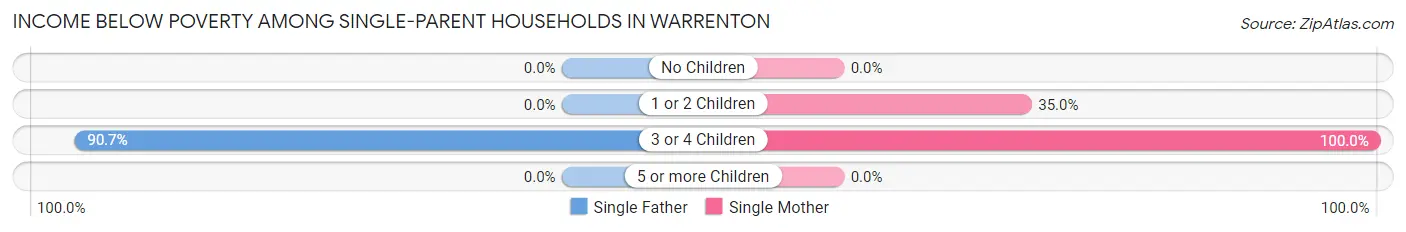
| Children | Single Father | Single Mother |
| No Children | 0 (0.0%) | 0 (0.0%) |
| 1 or 2 Children | 0 (0.0%) | 65 (34.9%) |
| 3 or 4 Children | 49 (90.7%) | 61 (100.0%) |
| 5 or more Children | 0 (0.0%) | 0 (0.0%) |
| Total | 49 (45.4%) | 126 (27.8%) |
Income Below Poverty Among Married-Couple vs Single-Parent Households in Warrenton
The poverty data for Warrenton shows that 10 of the married-couple family households (0.7%) and 175 of the single-parent households (31.1%) are living below the poverty level. Within the married-couple family households, those with no children have the highest poverty rate, with 10 households (1.3%) falling below the poverty line. Among the single-parent households, those with 3 or 4 children have the highest poverty rate, with 110 household (95.7%) living below poverty.
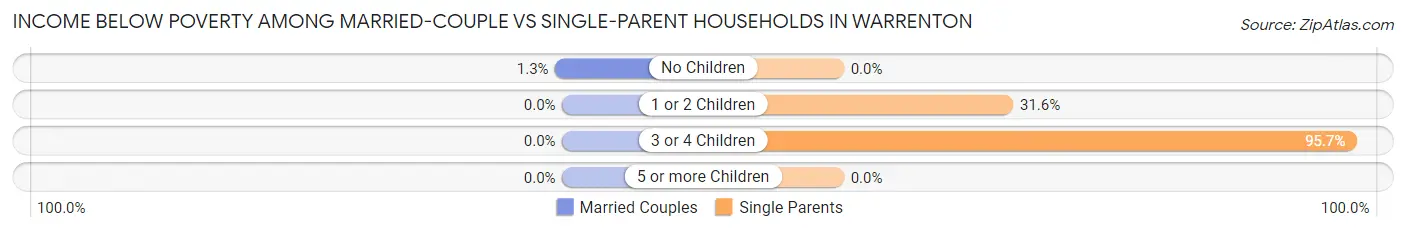
| Children | Married-Couple Families | Single-Parent Households |
| No Children | 10 (1.3%) | 0 (0.0%) |
| 1 or 2 Children | 0 (0.0%) | 65 (31.6%) |
| 3 or 4 Children | 0 (0.0%) | 110 (95.7%) |
| 5 or more Children | 0 (0.0%) | 0 (0.0%) |
| Total | 10 (0.7%) | 175 (31.1%) |
Race in Warrenton
The most populous races in Warrenton are White / Caucasian (7,796 | 90.1%), Hispanic or Latino (567 | 6.6%), and Two or more Races (555 | 6.4%).
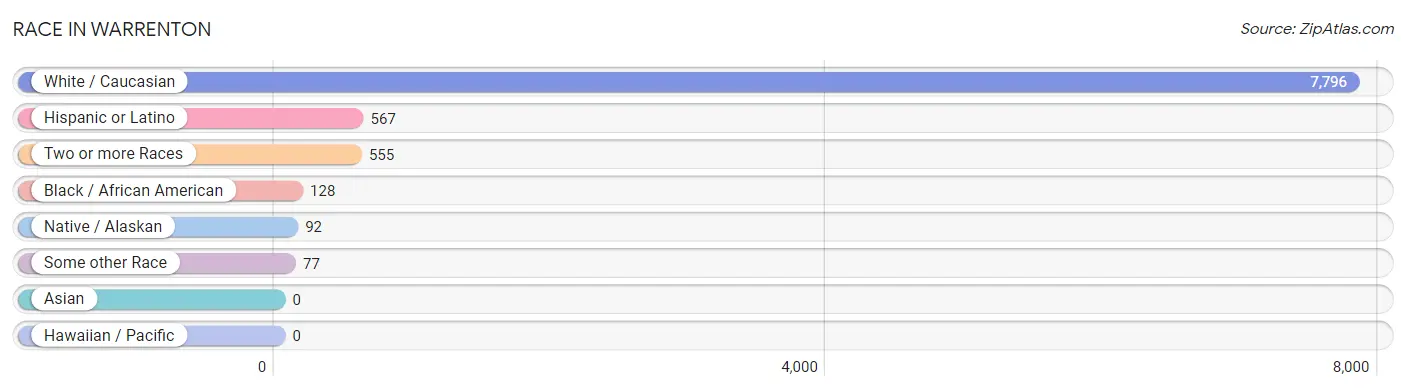
| Race | # Population | % Population |
| Asian | 0 | 0.0% |
| Black / African American | 128 | 1.5% |
| Hawaiian / Pacific | 0 | 0.0% |
| Hispanic or Latino | 567 | 6.6% |
| Native / Alaskan | 92 | 1.1% |
| White / Caucasian | 7,796 | 90.1% |
| Two or more Races | 555 | 6.4% |
| Some other Race | 77 | 0.9% |
| Total | 8,648 | 100.0% |
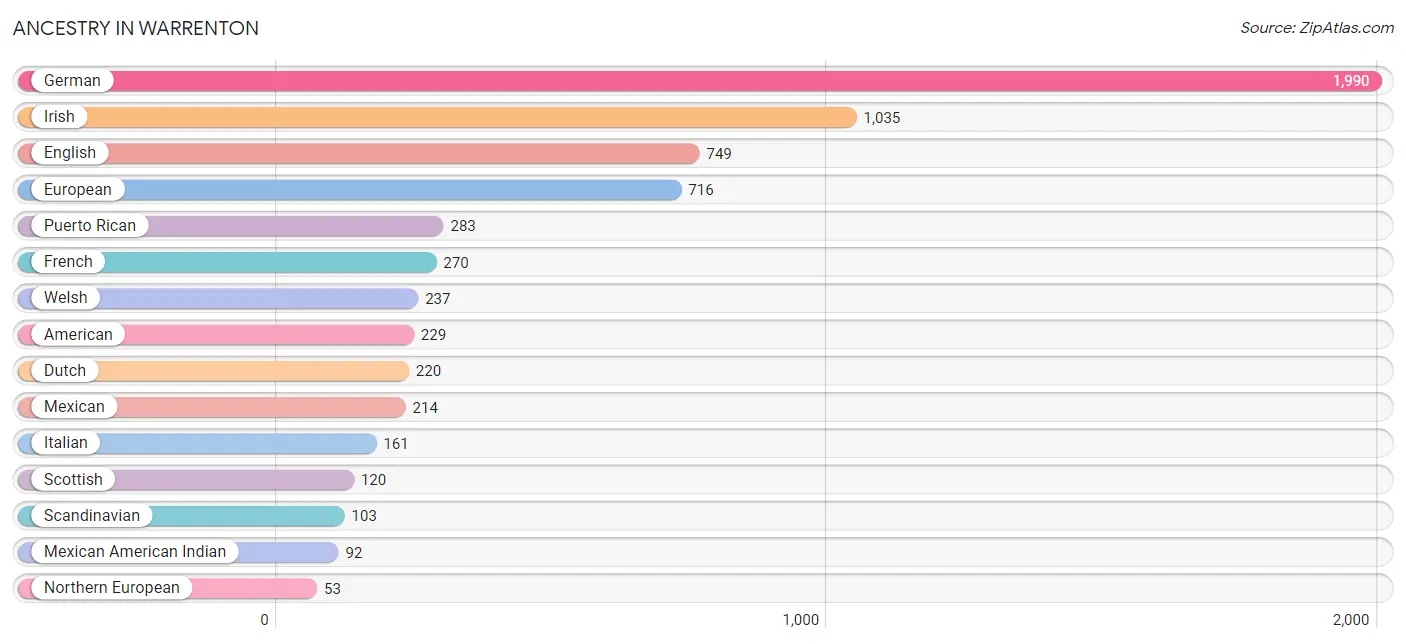
Ancestry in Warrenton
The most populous ancestries reported in Warrenton are German (1,990 | 23.0%), Irish (1,035 | 12.0%), English (749 | 8.7%), European (716 | 8.3%), and Puerto Rican (283 | 3.3%), together accounting for 55.2% of all Warrenton residents.
| Ancestry | # Population | % Population |
| African | 15 | 0.2% |
| American | 229 | 2.6% |
| Belgian | 6 | 0.1% |
| British | 37 | 0.4% |
| Cajun | 13 | 0.2% |
| Central American | 52 | 0.6% |
| Cherokee | 10 | 0.1% |
| Costa Rican | 52 | 0.6% |
| Czech | 15 | 0.2% |
| Czechoslovakian | 45 | 0.5% |
| Danish | 39 | 0.4% |
| Dutch | 220 | 2.5% |
| Eastern European | 13 | 0.2% |
| English | 749 | 8.7% |
| European | 716 | 8.3% |
| French | 270 | 3.1% |
| French Canadian | 50 | 0.6% |
| German | 1,990 | 23.0% |
| Irish | 1,035 | 12.0% |
| Italian | 161 | 1.9% |
| Mexican | 214 | 2.5% |
| Mexican American Indian | 92 | 1.1% |
| Northern European | 53 | 0.6% |
| Norwegian | 24 | 0.3% |
| Peruvian | 18 | 0.2% |
| Polish | 51 | 0.6% |
| Puerto Rican | 283 | 3.3% |
| Samoan | 10 | 0.1% |
| Scandinavian | 103 | 1.2% |
| Scotch-Irish | 17 | 0.2% |
| Scottish | 120 | 1.4% |
| South American | 18 | 0.2% |
| Subsaharan African | 15 | 0.2% |
| Swedish | 24 | 0.3% |
| Turkish | 28 | 0.3% |
| Welsh | 237 | 2.7% |
| West Indian | 4 | 0.1% | View All 37 Rows |
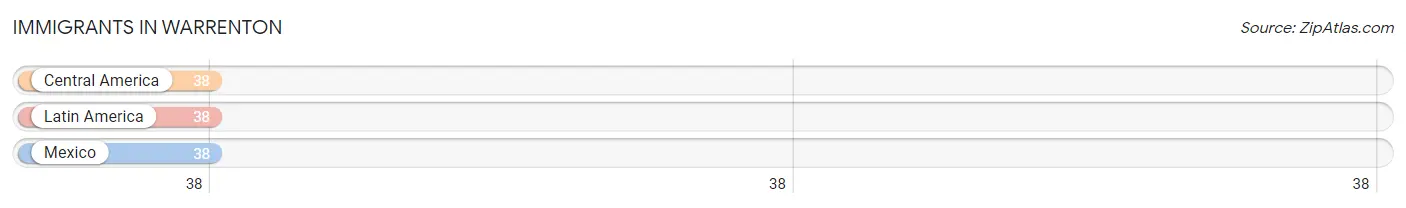
Immigrants in Warrenton
The most numerous immigrant groups reported in Warrenton came from Central America (38 | 0.4%), Latin America (38 | 0.4%), and Mexico (38 | 0.4%), together accounting for 1.3% of all Warrenton residents.
| Immigration Origin | # Population | % Population |
| Central America | 38 | 0.4% |
| Latin America | 38 | 0.4% |
| Mexico | 38 | 0.4% | View All 3 Rows |
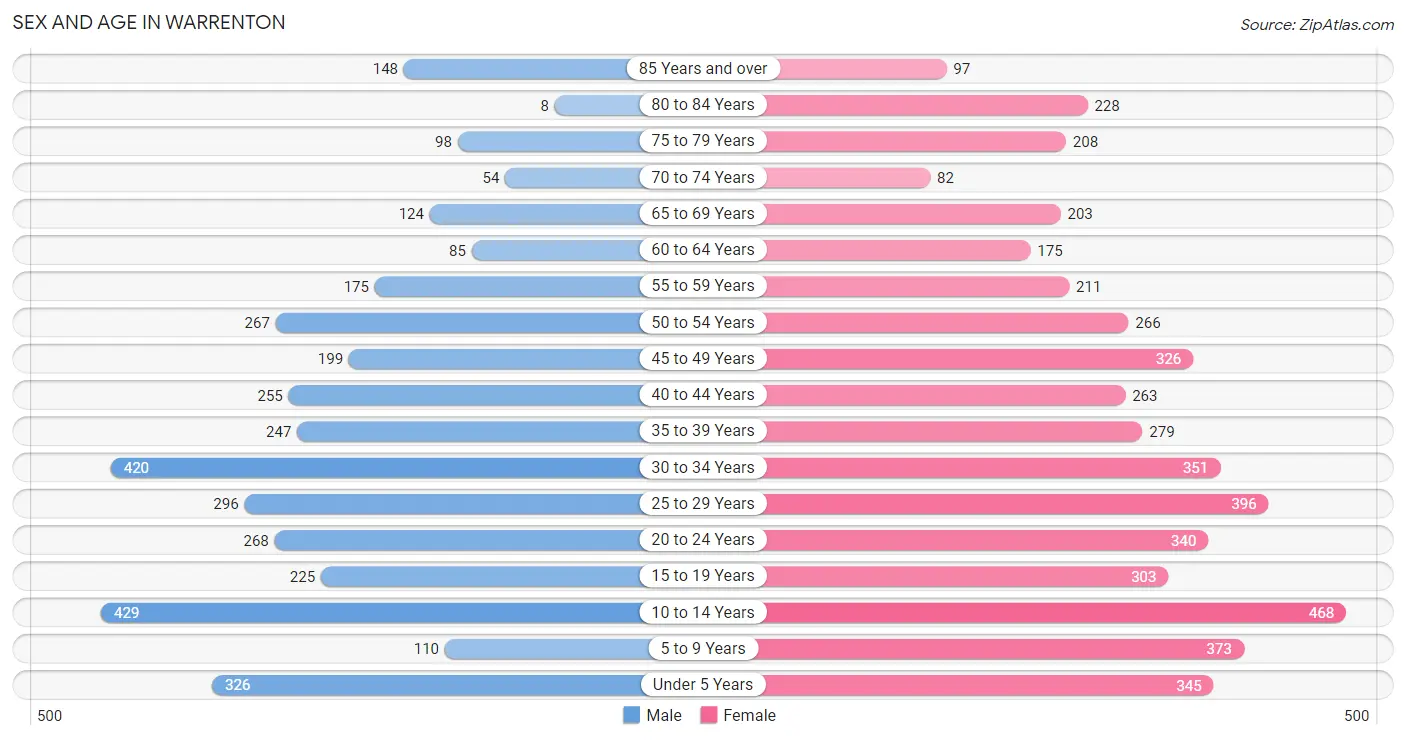
Sex and Age in Warrenton
Sex and Age in Warrenton
The most populous age groups in Warrenton are 10 to 14 Years (429 | 11.5%) for men and 10 to 14 Years (468 | 9.5%) for women.
| Age Bracket | Male | Female |
| Under 5 Years | 326 (8.7%) | 345 (7.0%) |
| 5 to 9 Years | 110 (2.9%) | 373 (7.6%) |
| 10 to 14 Years | 429 (11.5%) | 468 (9.5%) |
| 15 to 19 Years | 225 (6.0%) | 303 (6.2%) |
| 20 to 24 Years | 268 (7.2%) | 340 (6.9%) |
| 25 to 29 Years | 296 (7.9%) | 396 (8.1%) |
| 30 to 34 Years | 420 (11.3%) | 351 (7.1%) |
| 35 to 39 Years | 247 (6.6%) | 279 (5.7%) |
| 40 to 44 Years | 255 (6.8%) | 263 (5.3%) |
| 45 to 49 Years | 199 (5.3%) | 326 (6.6%) |
| 50 to 54 Years | 267 (7.1%) | 266 (5.4%) |
| 55 to 59 Years | 175 (4.7%) | 211 (4.3%) |
| 60 to 64 Years | 85 (2.3%) | 175 (3.6%) |
| 65 to 69 Years | 124 (3.3%) | 203 (4.1%) |
| 70 to 74 Years | 54 (1.5%) | 82 (1.7%) |
| 75 to 79 Years | 98 (2.6%) | 208 (4.2%) |
| 80 to 84 Years | 8 (0.2%) | 228 (4.6%) |
| 85 Years and over | 148 (4.0%) | 97 (2.0%) |
| Total | 3,734 (100.0%) | 4,914 (100.0%) |
Families and Households in Warrenton
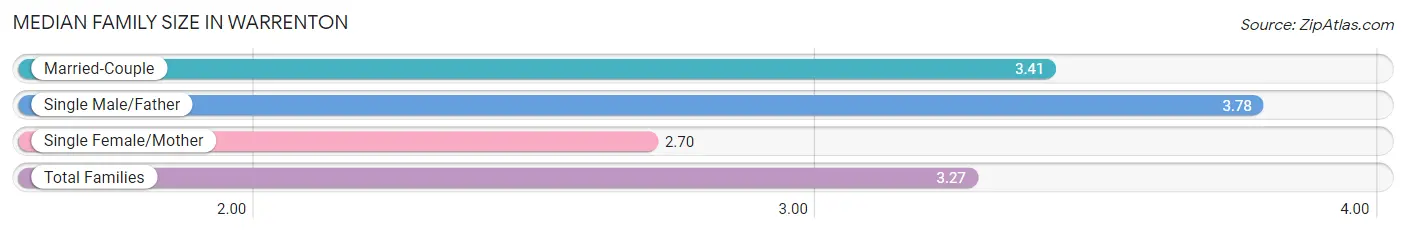
Median Family Size in Warrenton
The median family size in Warrenton is 3.27 persons per family, with single male/father families (108 | 5.3%) accounting for the largest median family size of 3.78 persons per family. On the other hand, single female/mother families (454 | 22.3%) represent the smallest median family size with 2.70 persons per family.
| Family Type | # Families | Family Size |
| Married-Couple | 1,475 (72.4%) | 3.41 |
| Single Male/Father | 108 (5.3%) | 3.78 |
| Single Female/Mother | 454 (22.3%) | 2.70 |
| Total Families | 2,037 (100.0%) | 3.27 |
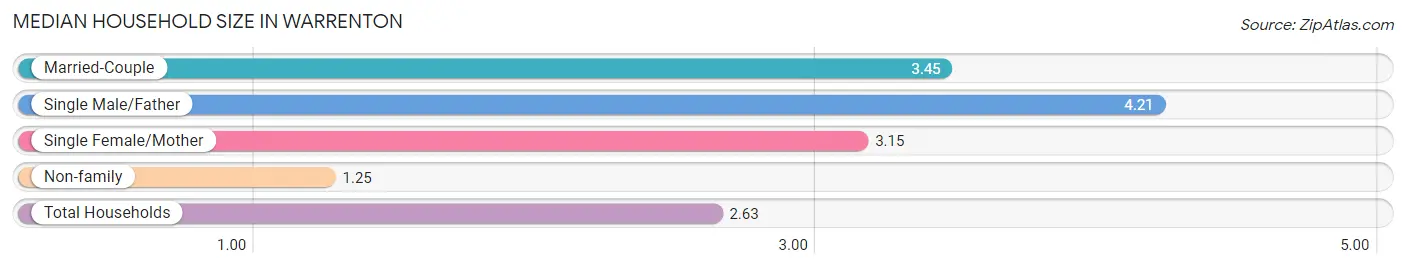
Median Household Size in Warrenton
The median household size in Warrenton is 2.63 persons per household, with single male/father households (108 | 3.4%) accounting for the largest median household size of 4.21 persons per household. non-family households (1,164 | 36.4%) represent the smallest median household size with 1.25 persons per household.
| Household Type | # Households | Household Size |
| Married-Couple | 1,475 (46.1%) | 3.45 |
| Single Male/Father | 108 (3.4%) | 4.21 |
| Single Female/Mother | 454 (14.2%) | 3.15 |
| Non-family | 1,164 (36.4%) | 1.25 |
| Total Households | 3,201 (100.0%) | 2.63 |
Household Size by Marriage Status in Warrenton
Out of a total of 3,201 households in Warrenton, 2,037 (63.6%) are family households, while 1,164 (36.4%) are nonfamily households. The most numerous type of family households are 2-person households, comprising 639, and the most common type of nonfamily households are 1-person households, comprising 884.
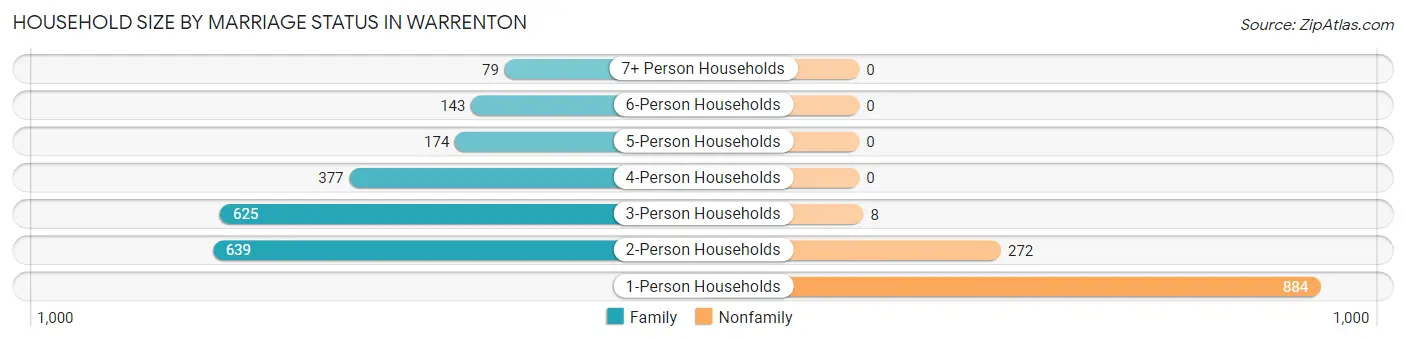
| Household Size | Family Households | Nonfamily Households |
| 1-Person Households | - | 884 (27.6%) |
| 2-Person Households | 639 (20.0%) | 272 (8.5%) |
| 3-Person Households | 625 (19.5%) | 8 (0.3%) |
| 4-Person Households | 377 (11.8%) | 0 (0.0%) |
| 5-Person Households | 174 (5.4%) | 0 (0.0%) |
| 6-Person Households | 143 (4.5%) | 0 (0.0%) |
| 7+ Person Households | 79 (2.5%) | 0 (0.0%) |
| Total | 2,037 (63.6%) | 1,164 (36.4%) |
Female Fertility in Warrenton
Fertility by Age in Warrenton
Average fertility rate in Warrenton is 12.0 births per 1,000 women. Women in the age bracket of 20 to 34 years have the highest fertility rate with 14.0 births per 1,000 women. Women in the age bracket of 20 to 34 years acount for 55.6% of all women with births.
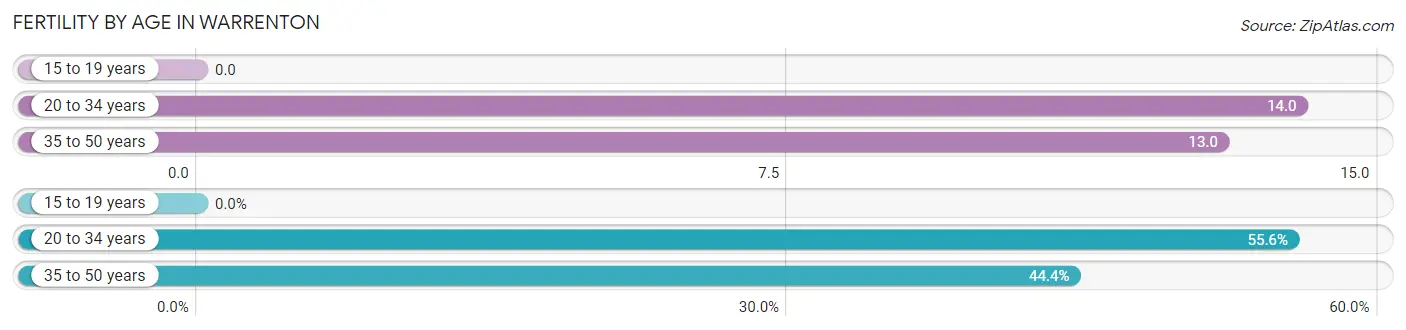
| Age Bracket | Women with Births | Births / 1,000 Women |
| 15 to 19 years | 0 (0.0%) | 0.0 |
| 20 to 34 years | 15 (55.6%) | 14.0 |
| 35 to 50 years | 12 (44.4%) | 13.0 |
| Total | 27 (100.0%) | 12.0 |
Fertility by Age by Marriage Status in Warrenton
44.4% of women with births (27) in Warrenton are married. The highest percentage of unmarried women with births falls into 20 to 34 years age bracket with 100.0% of them unmarried at the time of birth, while the lowest percentage of unmarried women with births belong to 35 to 50 years age bracket with 0.0% of them unmarried.
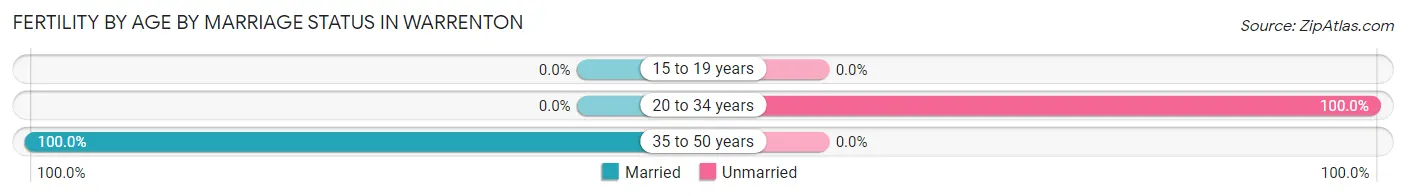
| Age Bracket | Married | Unmarried |
| 15 to 19 years | 0 (0.0%) | 0 (0.0%) |
| 20 to 34 years | 0 (0.0%) | 15 (100.0%) |
| 35 to 50 years | 12 (100.0%) | 0 (0.0%) |
| Total | 12 (44.4%) | 15 (55.6%) |
Fertility by Education in Warrenton
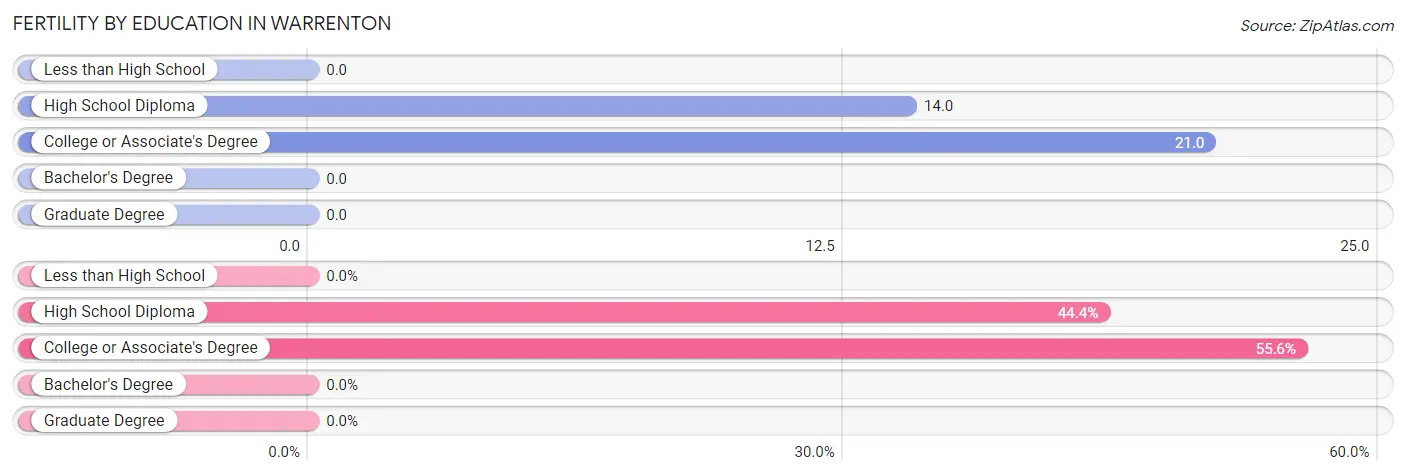
| Educational Attainment | Women with Births | Births / 1,000 Women |
| Less than High School | 0 (0.0%) | 0.0 |
| High School Diploma | 12 (44.4%) | 14.0 |
| College or Associate's Degree | 15 (55.6%) | 21.0 |
| Bachelor's Degree | 0 (0.0%) | 0.0 |
| Graduate Degree | 0 (0.0%) | 0.0 |
| Total | 27 (100.0%) | 12.0 |
Fertility by Education by Marriage Status in Warrenton
55.6% of women with births in Warrenton are unmarried. Women with the educational attainment of high school diploma are most likely to be married with 100.0% of them married at childbirth, while women with the educational attainment of college or associate's degree are least likely to be married with 100.0% of them unmarried at childbirth.
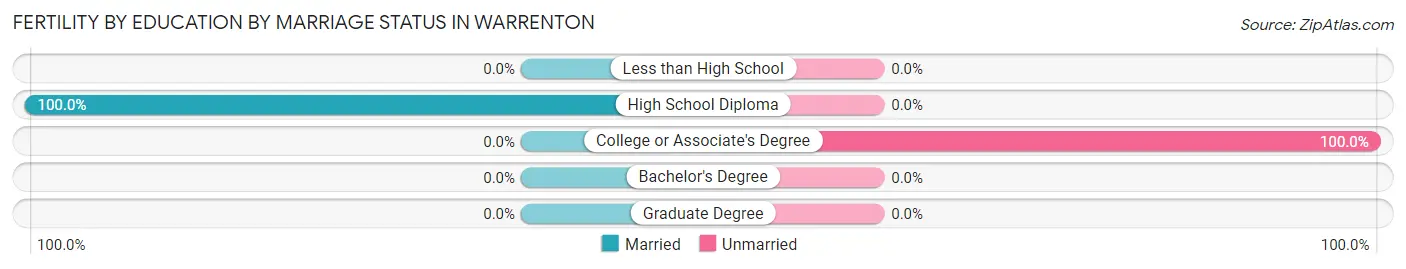
| Educational Attainment | Married | Unmarried |
| Less than High School | 0 (0.0%) | 0 (0.0%) |
| High School Diploma | 12 (100.0%) | 0 (0.0%) |
| College or Associate's Degree | 0 (0.0%) | 15 (100.0%) |
| Bachelor's Degree | 0 (0.0%) | 0 (0.0%) |
| Graduate Degree | 0 (0.0%) | 0 (0.0%) |
| Total | 12 (44.4%) | 15 (55.6%) |
Employment Characteristics in Warrenton
Employment by Class of Employer in Warrenton
Among the 4,049 employed individuals in Warrenton, private company employees (3,481 | 86.0%), not-for-profit organizations (255 | 6.3%), and local government employees (134 | 3.3%) make up the most common classes of employment.
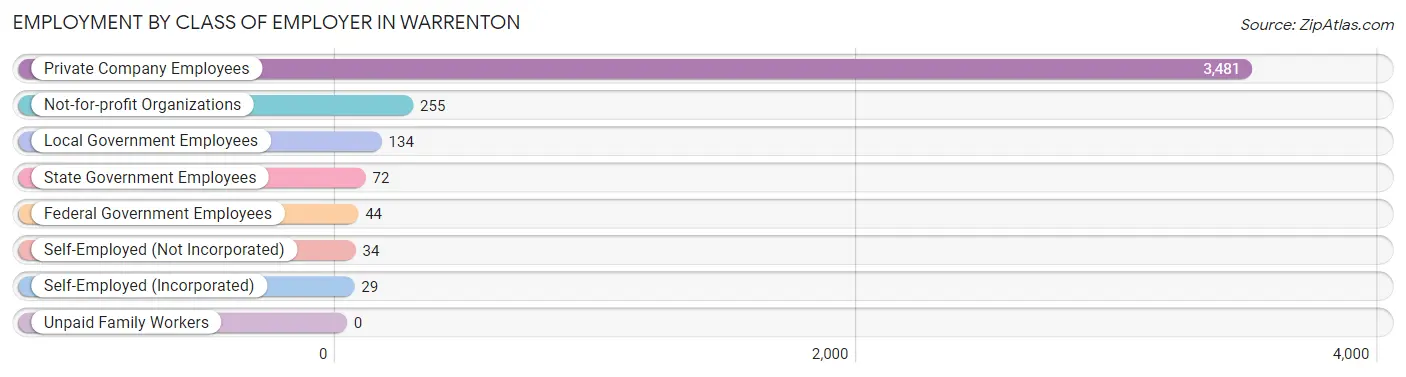
| Employer Class | # Employees | % Employees |
| Private Company Employees | 3,481 | 86.0% |
| Self-Employed (Incorporated) | 29 | 0.7% |
| Self-Employed (Not Incorporated) | 34 | 0.8% |
| Not-for-profit Organizations | 255 | 6.3% |
| Local Government Employees | 134 | 3.3% |
| State Government Employees | 72 | 1.8% |
| Federal Government Employees | 44 | 1.1% |
| Unpaid Family Workers | 0 | 0.0% |
| Total | 4,049 | 100.0% |
Employment Status by Age in Warrenton
According to the labor force statistics for Warrenton, out of the total population over 16 years of age (6,479), 67.2% or 4,354 individuals are in the labor force, with 5.2% or 226 of them unemployed. The age group with the highest labor force participation rate is 25 to 29 years, with 90.3% or 625 individuals in the labor force. Within the labor force, the 16 to 19 years age range has the highest percentage of unemployed individuals, with 26.4% or 39 of them being unemployed.
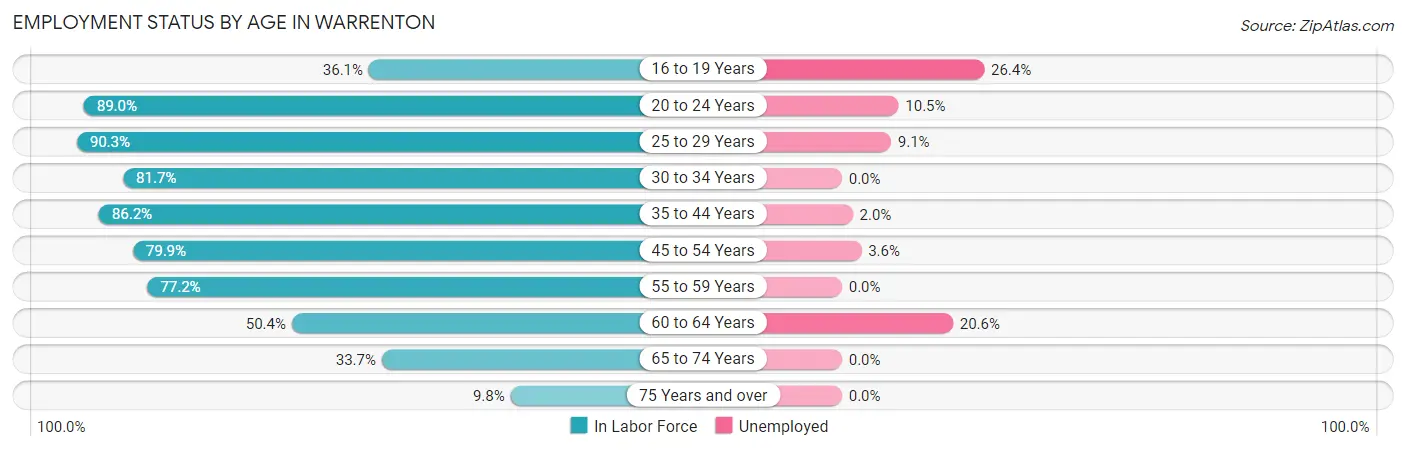
| Age Bracket | In Labor Force | Unemployed |
| 16 to 19 Years | 148 (36.1%) | 39 (26.4%) |
| 20 to 24 Years | 541 (89.0%) | 57 (10.5%) |
| 25 to 29 Years | 625 (90.3%) | 57 (9.1%) |
| 30 to 34 Years | 630 (81.7%) | 0 (0.0%) |
| 35 to 44 Years | 900 (86.2%) | 18 (2.0%) |
| 45 to 54 Years | 845 (79.9%) | 30 (3.6%) |
| 55 to 59 Years | 298 (77.2%) | 0 (0.0%) |
| 60 to 64 Years | 131 (50.4%) | 27 (20.6%) |
| 65 to 74 Years | 156 (33.7%) | 0 (0.0%) |
| 75 Years and over | 77 (9.8%) | 0 (0.0%) |
| Total | 4,354 (67.2%) | 226 (5.2%) |
Employment Status by Educational Attainment in Warrenton
According to labor force statistics for Warrenton, 81.4% of individuals (3,428) out of the total population between 25 and 64 years of age (4,211) are in the labor force, with 3.8% or 130 of them being unemployed. The group with the highest labor force participation rate are those with the educational attainment of bachelor's degree or higher, with 90.2% or 638 individuals in the labor force. Within the labor force, individuals with college / associate degree education have the highest percentage of unemployment, with 5.7% or 66 of them being unemployed.
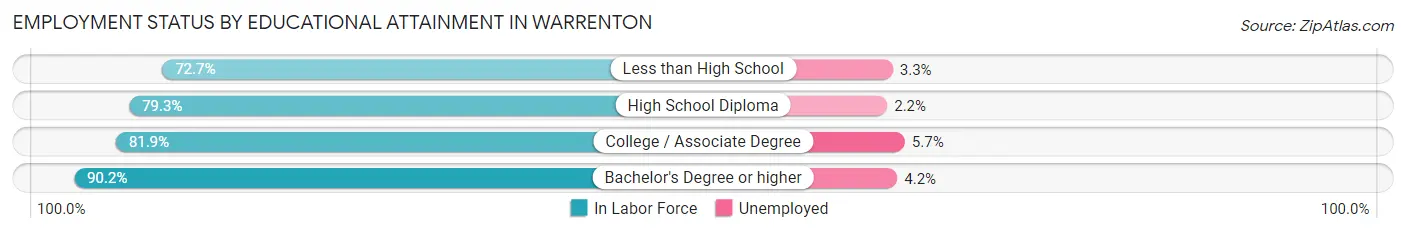
| Educational Attainment | In Labor Force | Unemployed |
| Less than High School | 274 (72.7%) | 12 (3.3%) |
| High School Diploma | 1,356 (79.3%) | 38 (2.2%) |
| College / Associate Degree | 1,161 (81.9%) | 81 (5.7%) |
| Bachelor's Degree or higher | 638 (90.2%) | 30 (4.2%) |
| Total | 3,428 (81.4%) | 160 (3.8%) |
Employment Occupations by Sex in Warrenton
Management, Business, Science and Arts Occupations
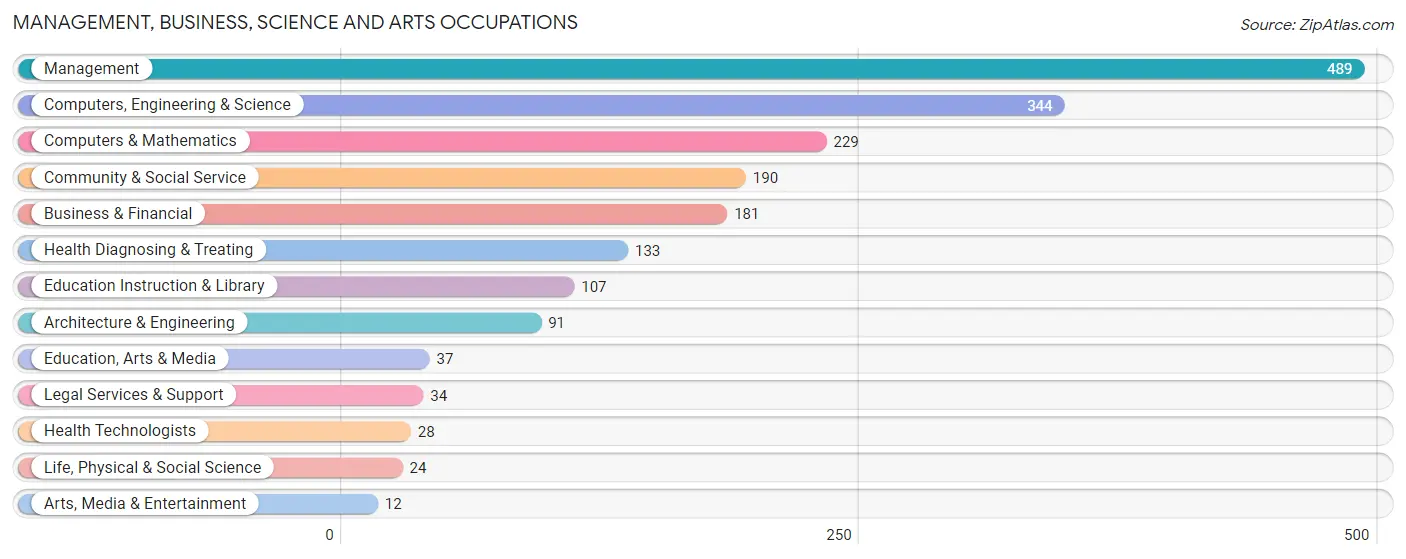
The most common Management, Business, Science and Arts occupations in Warrenton are Management (489 | 11.9%), Computers, Engineering & Science (344 | 8.3%), Computers & Mathematics (229 | 5.6%), Community & Social Service (190 | 4.6%), and Business & Financial (181 | 4.4%).
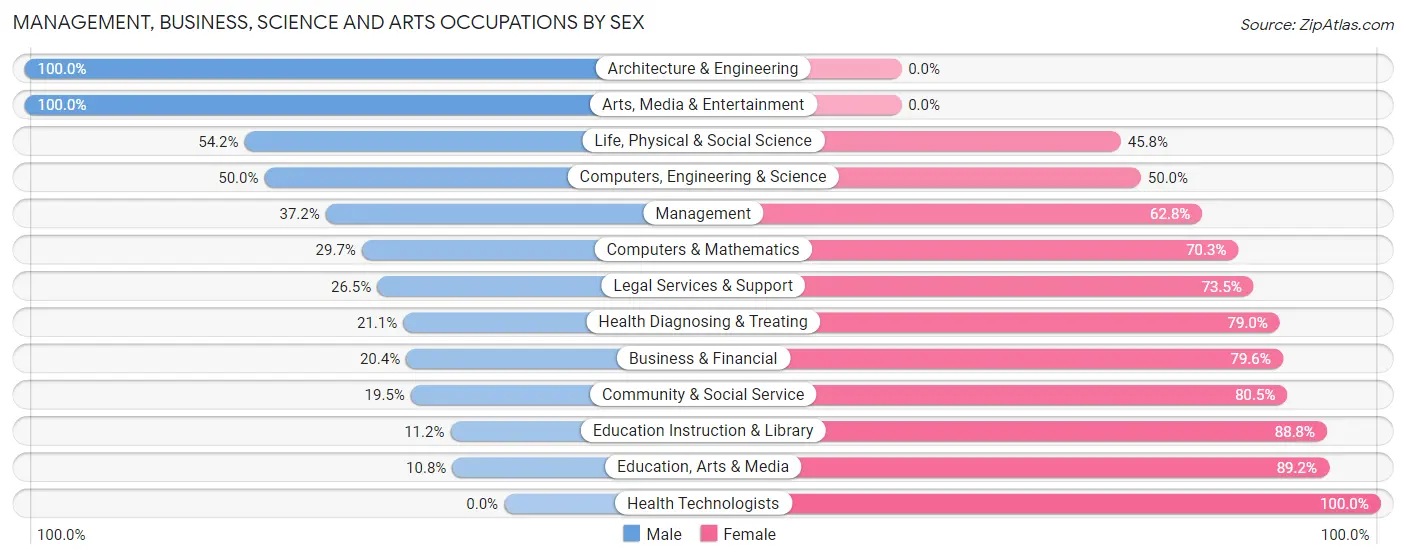
Management, Business, Science and Arts Occupations by Sex
Within the Management, Business, Science and Arts occupations in Warrenton, the most male-oriented occupations are Architecture & Engineering (100.0%), Arts, Media & Entertainment (100.0%), and Life, Physical & Social Science (54.2%), while the most female-oriented occupations are Health Technologists (100.0%), Education, Arts & Media (89.2%), and Education Instruction & Library (88.8%).
| Occupation | Male | Female |
| Management | 182 (37.2%) | 307 (62.8%) |
| Business & Financial | 37 (20.4%) | 144 (79.6%) |
| Computers, Engineering & Science | 172 (50.0%) | 172 (50.0%) |
| Computers & Mathematics | 68 (29.7%) | 161 (70.3%) |
| Architecture & Engineering | 91 (100.0%) | 0 (0.0%) |
| Life, Physical & Social Science | 13 (54.2%) | 11 (45.8%) |
| Community & Social Service | 37 (19.5%) | 153 (80.5%) |
| Education, Arts & Media | 4 (10.8%) | 33 (89.2%) |
| Legal Services & Support | 9 (26.5%) | 25 (73.5%) |
| Education Instruction & Library | 12 (11.2%) | 95 (88.8%) |
| Arts, Media & Entertainment | 12 (100.0%) | 0 (0.0%) |
| Health Diagnosing & Treating | 28 (21.0%) | 105 (78.9%) |
| Health Technologists | 0 (0.0%) | 28 (100.0%) |
| Total (Category) | 456 (34.1%) | 881 (65.9%) |
| Total (Overall) | 1,907 (46.3%) | 2,216 (53.7%) |
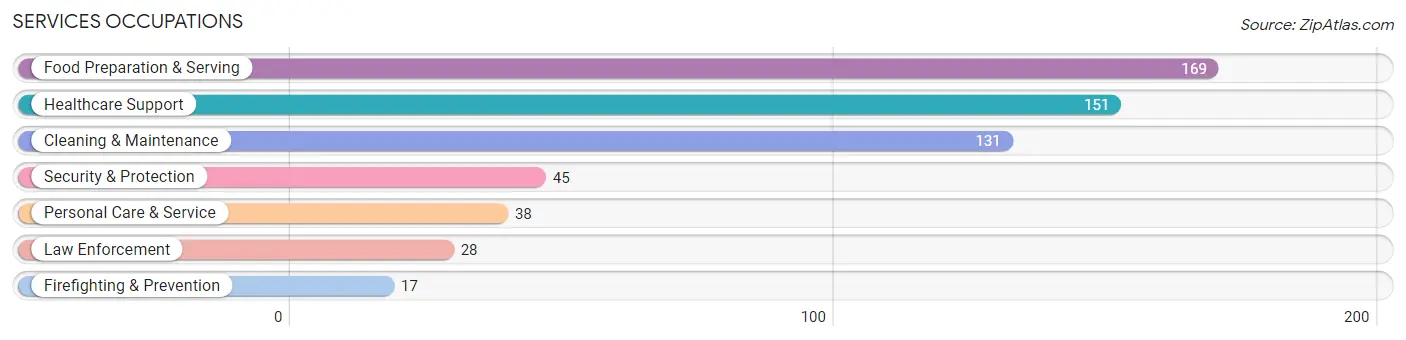
Services Occupations
The most common Services occupations in Warrenton are Food Preparation & Serving (169 | 4.1%), Healthcare Support (151 | 3.7%), Cleaning & Maintenance (131 | 3.2%), Security & Protection (45 | 1.1%), and Personal Care & Service (38 | 0.9%).
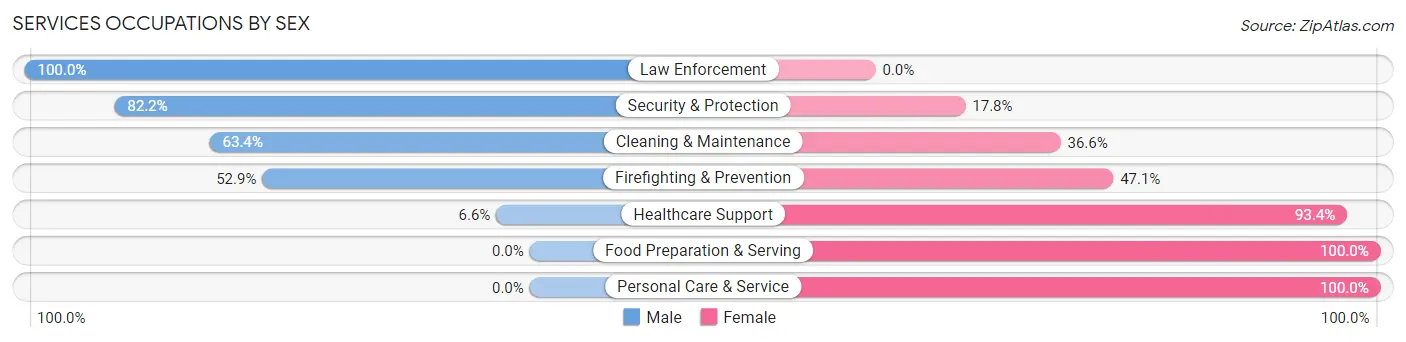
Services Occupations by Sex
Within the Services occupations in Warrenton, the most male-oriented occupations are Law Enforcement (100.0%), Security & Protection (82.2%), and Cleaning & Maintenance (63.4%), while the most female-oriented occupations are Food Preparation & Serving (100.0%), Personal Care & Service (100.0%), and Healthcare Support (93.4%).
| Occupation | Male | Female |
| Healthcare Support | 10 (6.6%) | 141 (93.4%) |
| Security & Protection | 37 (82.2%) | 8 (17.8%) |
| Firefighting & Prevention | 9 (52.9%) | 8 (47.1%) |
| Law Enforcement | 28 (100.0%) | 0 (0.0%) |
| Food Preparation & Serving | 0 (0.0%) | 169 (100.0%) |
| Cleaning & Maintenance | 83 (63.4%) | 48 (36.6%) |
| Personal Care & Service | 0 (0.0%) | 38 (100.0%) |
| Total (Category) | 130 (24.3%) | 404 (75.7%) |
| Total (Overall) | 1,907 (46.3%) | 2,216 (53.7%) |
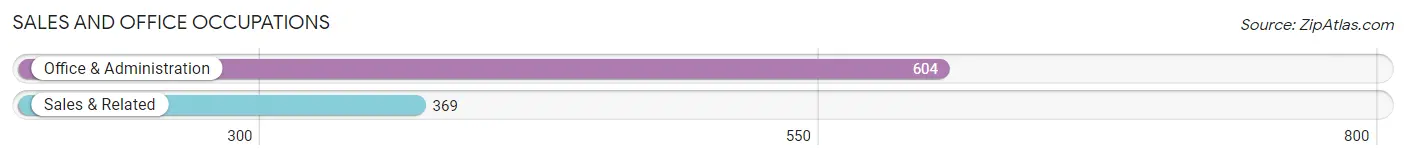
Sales and Office Occupations
The most common Sales and Office occupations in Warrenton are Office & Administration (604 | 14.6%), and Sales & Related (369 | 8.9%).
Sales and Office Occupations by Sex
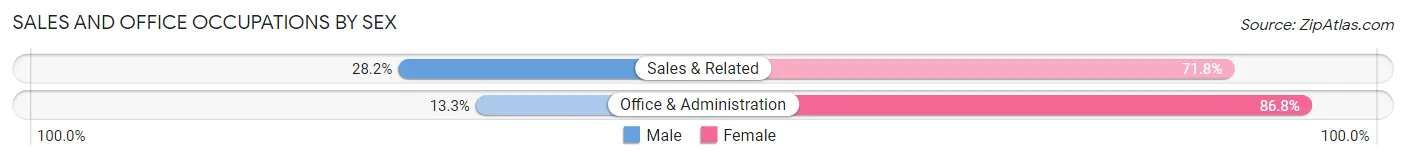
| Occupation | Male | Female |
| Sales & Related | 104 (28.2%) | 265 (71.8%) |
| Office & Administration | 80 (13.3%) | 524 (86.8%) |
| Total (Category) | 184 (18.9%) | 789 (81.1%) |
| Total (Overall) | 1,907 (46.3%) | 2,216 (53.7%) |
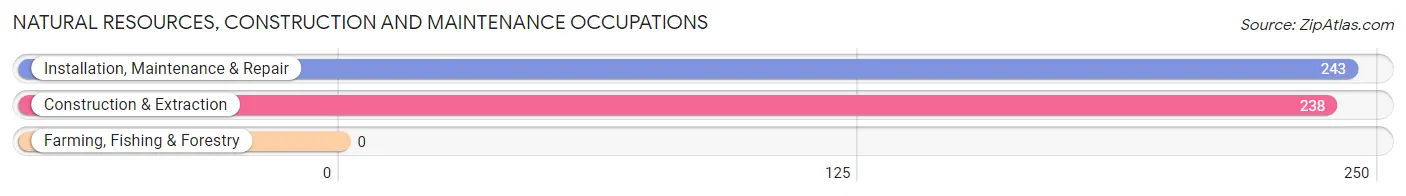
Natural Resources, Construction and Maintenance Occupations
The most common Natural Resources, Construction and Maintenance occupations in Warrenton are Installation, Maintenance & Repair (243 | 5.9%), and Construction & Extraction (238 | 5.8%).
Natural Resources, Construction and Maintenance Occupations by Sex
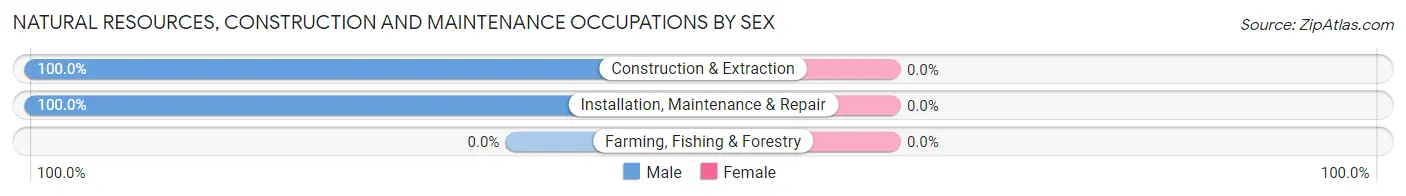
| Occupation | Male | Female |
| Farming, Fishing & Forestry | 0 (0.0%) | 0 (0.0%) |
| Construction & Extraction | 238 (100.0%) | 0 (0.0%) |
| Installation, Maintenance & Repair | 243 (100.0%) | 0 (0.0%) |
| Total (Category) | 481 (100.0%) | 0 (0.0%) |
| Total (Overall) | 1,907 (46.3%) | 2,216 (53.7%) |
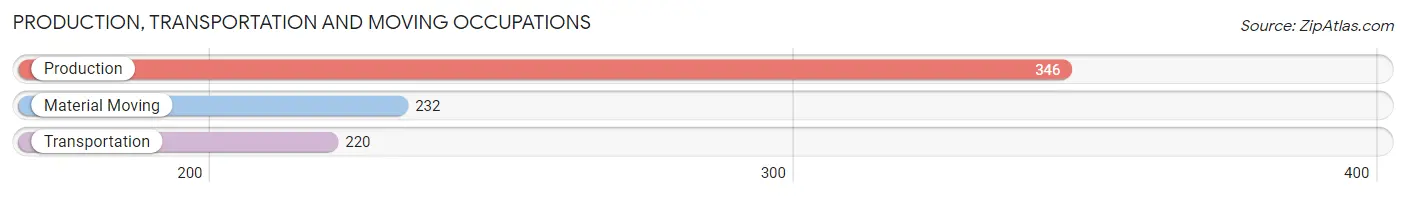
Production, Transportation and Moving Occupations
The most common Production, Transportation and Moving occupations in Warrenton are Production (346 | 8.4%), Material Moving (232 | 5.6%), and Transportation (220 | 5.3%).
Production, Transportation and Moving Occupations by Sex
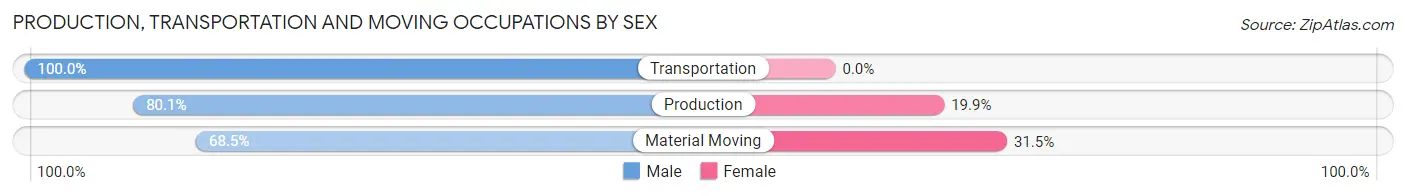
| Occupation | Male | Female |
| Production | 277 (80.1%) | 69 (19.9%) |
| Transportation | 220 (100.0%) | 0 (0.0%) |
| Material Moving | 159 (68.5%) | 73 (31.5%) |
| Total (Category) | 656 (82.2%) | 142 (17.8%) |
| Total (Overall) | 1,907 (46.3%) | 2,216 (53.7%) |
Employment Industries by Sex in Warrenton
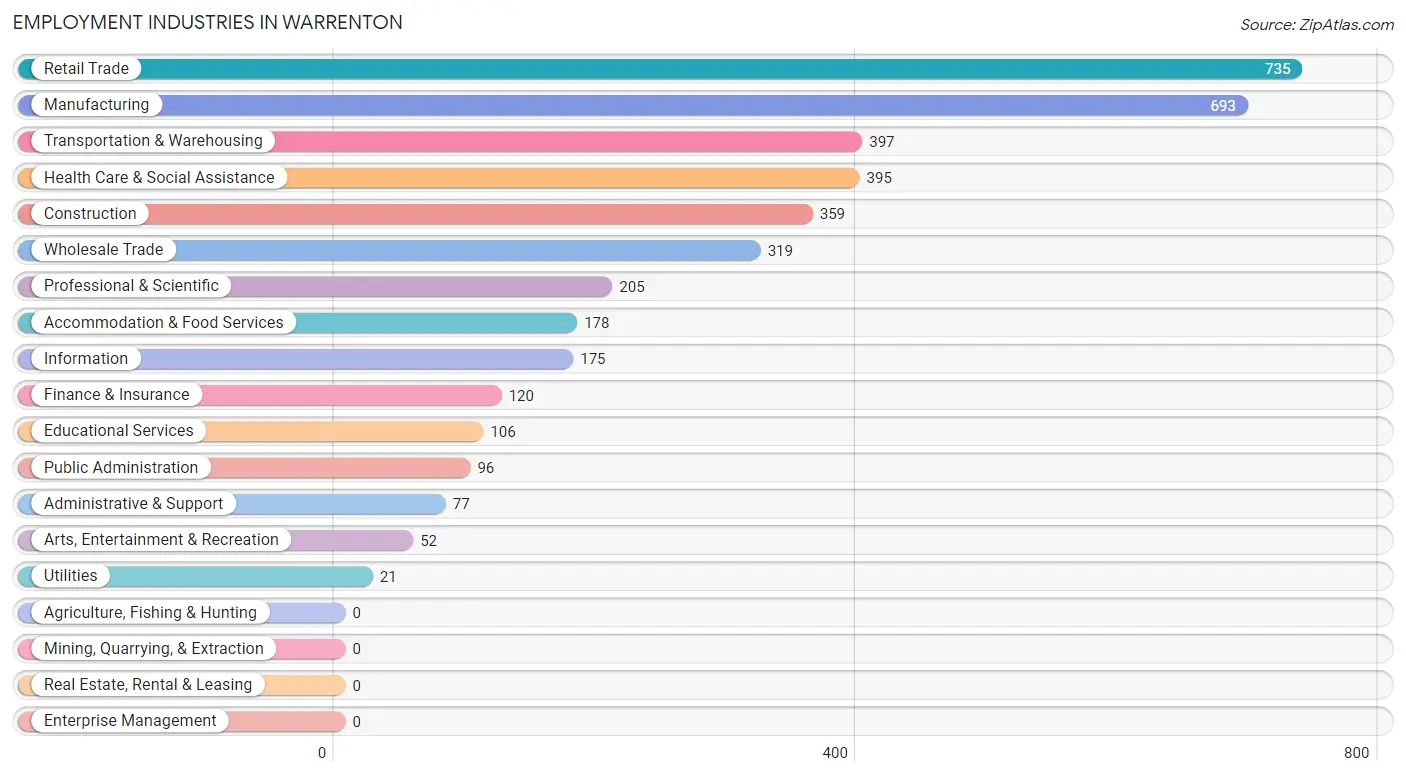
Employment Industries in Warrenton
The major employment industries in Warrenton include Retail Trade (735 | 17.8%), Manufacturing (693 | 16.8%), Transportation & Warehousing (397 | 9.6%), Health Care & Social Assistance (395 | 9.6%), and Construction (359 | 8.7%).
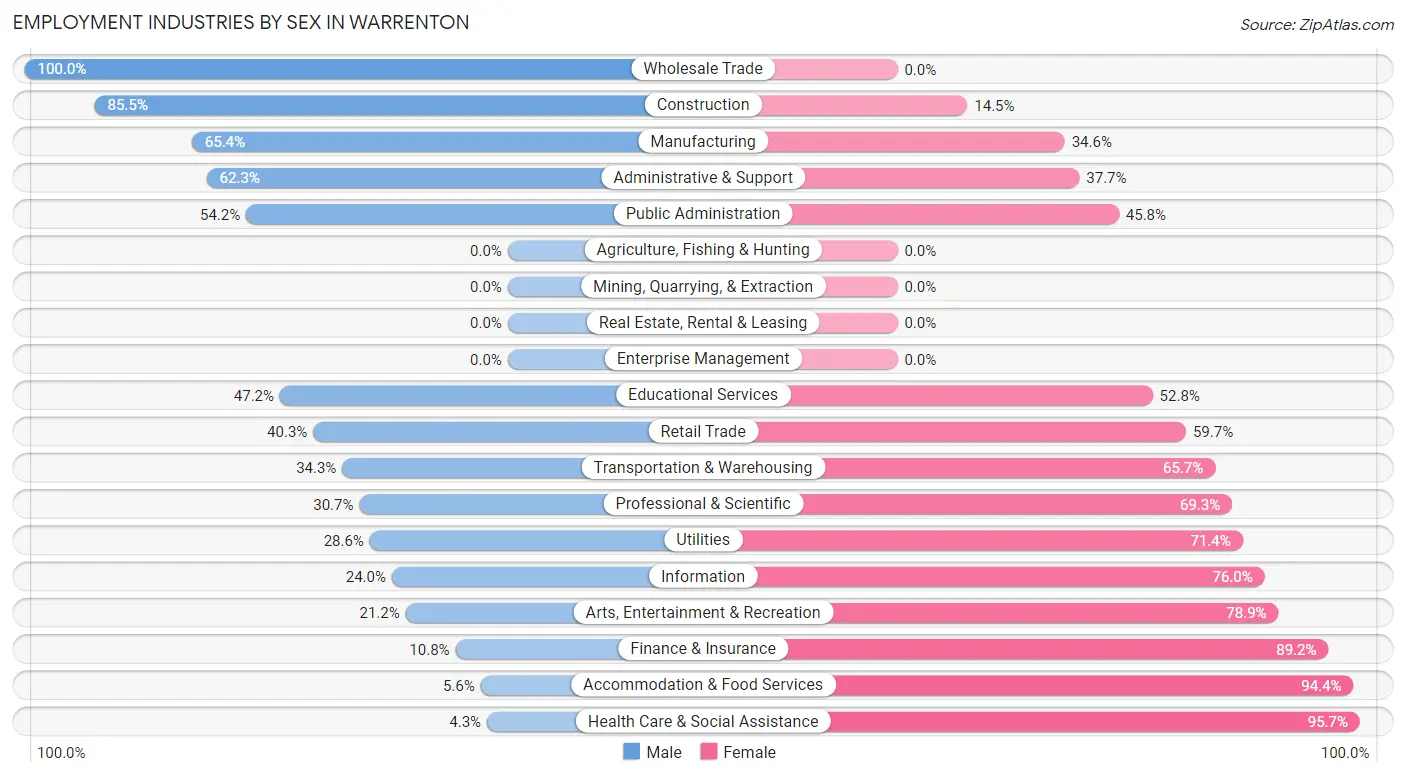
Employment Industries by Sex in Warrenton
The Warrenton industries that see more men than women are Wholesale Trade (100.0%), Construction (85.5%), and Manufacturing (65.4%), whereas the industries that tend to have a higher number of women are Health Care & Social Assistance (95.7%), Accommodation & Food Services (94.4%), and Finance & Insurance (89.2%).
| Industry | Male | Female |
| Agriculture, Fishing & Hunting | 0 (0.0%) | 0 (0.0%) |
| Mining, Quarrying, & Extraction | 0 (0.0%) | 0 (0.0%) |
| Construction | 307 (85.5%) | 52 (14.5%) |
| Manufacturing | 453 (65.4%) | 240 (34.6%) |
| Wholesale Trade | 319 (100.0%) | 0 (0.0%) |
| Retail Trade | 296 (40.3%) | 439 (59.7%) |
| Transportation & Warehousing | 136 (34.3%) | 261 (65.7%) |
| Utilities | 6 (28.6%) | 15 (71.4%) |
| Information | 42 (24.0%) | 133 (76.0%) |
| Finance & Insurance | 13 (10.8%) | 107 (89.2%) |
| Real Estate, Rental & Leasing | 0 (0.0%) | 0 (0.0%) |
| Professional & Scientific | 63 (30.7%) | 142 (69.3%) |
| Enterprise Management | 0 (0.0%) | 0 (0.0%) |
| Administrative & Support | 48 (62.3%) | 29 (37.7%) |
| Educational Services | 50 (47.2%) | 56 (52.8%) |
| Health Care & Social Assistance | 17 (4.3%) | 378 (95.7%) |
| Arts, Entertainment & Recreation | 11 (21.1%) | 41 (78.8%) |
| Accommodation & Food Services | 10 (5.6%) | 168 (94.4%) |
| Public Administration | 52 (54.2%) | 44 (45.8%) |
| Total | 1,907 (46.3%) | 2,216 (53.7%) |
Education in Warrenton
School Enrollment in Warrenton
The most common levels of schooling among the 2,143 students in Warrenton are middle school (683 | 31.9%), high school (524 | 24.4%), and elementary school (376 | 17.5%).
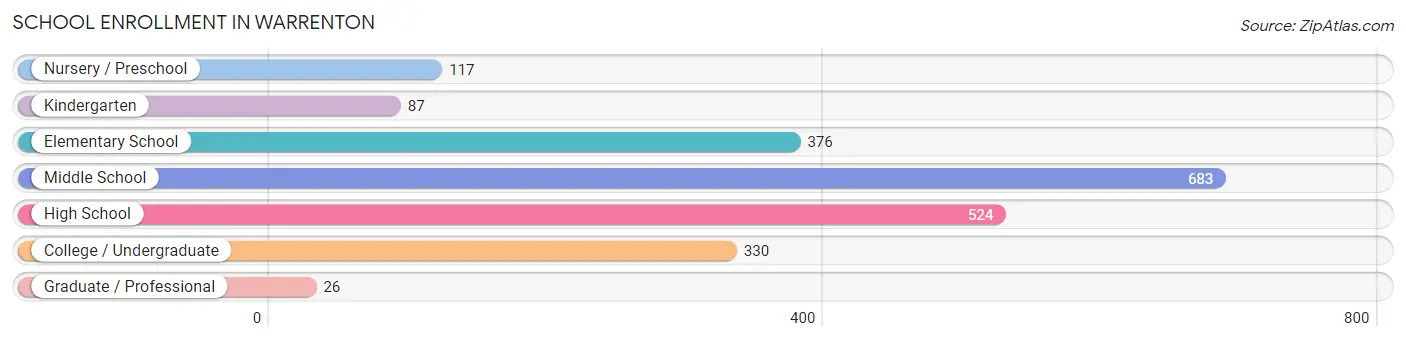
| School Level | # Students | % Students |
| Nursery / Preschool | 117 | 5.5% |
| Kindergarten | 87 | 4.1% |
| Elementary School | 376 | 17.5% |
| Middle School | 683 | 31.9% |
| High School | 524 | 24.4% |
| College / Undergraduate | 330 | 15.4% |
| Graduate / Professional | 26 | 1.2% |
| Total | 2,143 | 100.0% |
School Enrollment by Age by Funding Source in Warrenton
Out of a total of 2,143 students who are enrolled in schools in Warrenton, 405 (18.9%) attend a private institution, while the remaining 1,738 (81.1%) are enrolled in public schools. The age group of 20 to 24 year olds has the highest likelihood of being enrolled in private schools, with 36 (73.5% in the age bracket) enrolled. Conversely, the age group of 25 to 34 year olds has the lowest likelihood of being enrolled in a private school, with 201 (100.0% in the age bracket) attending a public institution.
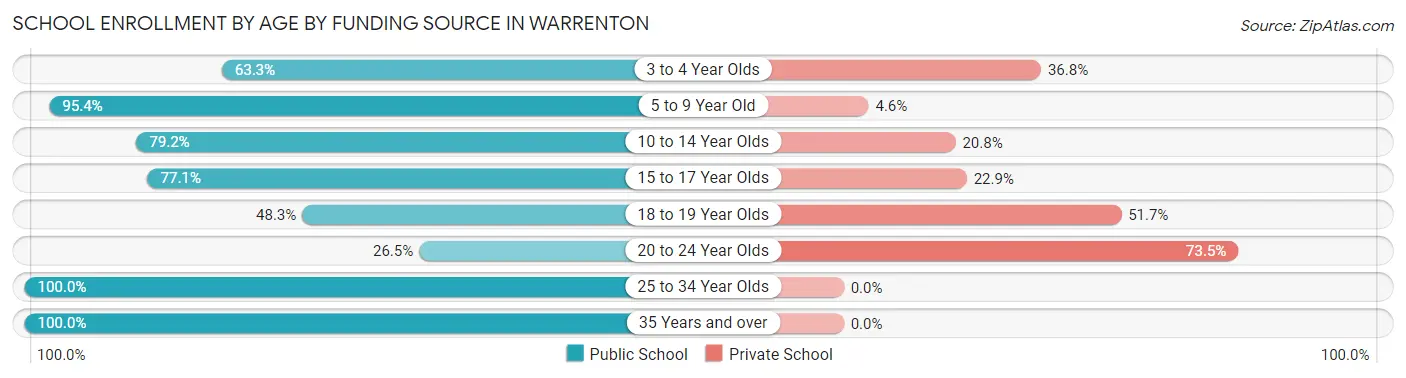
| Age Bracket | Public School | Private School |
| 3 to 4 Year Olds | 74 (63.2%) | 43 (36.7%) |
| 5 to 9 Year Old | 391 (95.4%) | 19 (4.6%) |
| 10 to 14 Year Olds | 684 (79.2%) | 180 (20.8%) |
| 15 to 17 Year Olds | 269 (77.1%) | 80 (22.9%) |
| 18 to 19 Year Olds | 43 (48.3%) | 46 (51.7%) |
| 20 to 24 Year Olds | 13 (26.5%) | 36 (73.5%) |
| 25 to 34 Year Olds | 201 (100.0%) | 0 (0.0%) |
| 35 Years and over | 64 (100.0%) | 0 (0.0%) |
| Total | 1,738 (81.1%) | 405 (18.9%) |
Educational Attainment by Field of Study in Warrenton
Business (279 | 30.7%), science & technology (120 | 13.2%), social sciences (102 | 11.2%), engineering (102 | 11.2%), and liberal arts & history (68 | 7.5%) are the most common fields of study among 909 individuals in Warrenton who have obtained a bachelor's degree or higher.
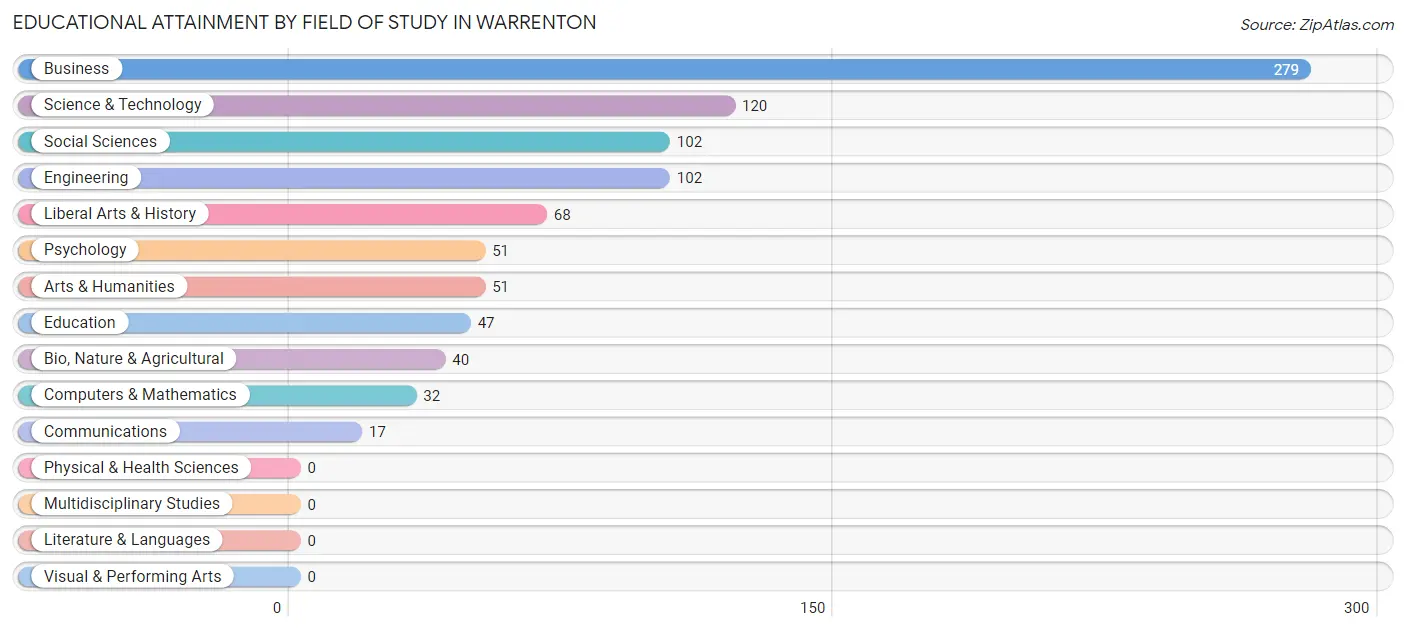
| Field of Study | # Graduates | % Graduates |
| Computers & Mathematics | 32 | 3.5% |
| Bio, Nature & Agricultural | 40 | 4.4% |
| Physical & Health Sciences | 0 | 0.0% |
| Psychology | 51 | 5.6% |
| Social Sciences | 102 | 11.2% |
| Engineering | 102 | 11.2% |
| Multidisciplinary Studies | 0 | 0.0% |
| Science & Technology | 120 | 13.2% |
| Business | 279 | 30.7% |
| Education | 47 | 5.2% |
| Literature & Languages | 0 | 0.0% |
| Liberal Arts & History | 68 | 7.5% |
| Visual & Performing Arts | 0 | 0.0% |
| Communications | 17 | 1.9% |
| Arts & Humanities | 51 | 5.6% |
| Total | 909 | 100.0% |
Transportation & Commute in Warrenton
Vehicle Availability by Sex in Warrenton
The most prevalent vehicle ownership categories in Warrenton are males with 2 vehicles (734, accounting for 40.2%) and females with 2 vehicles (808, making up 33.2%).
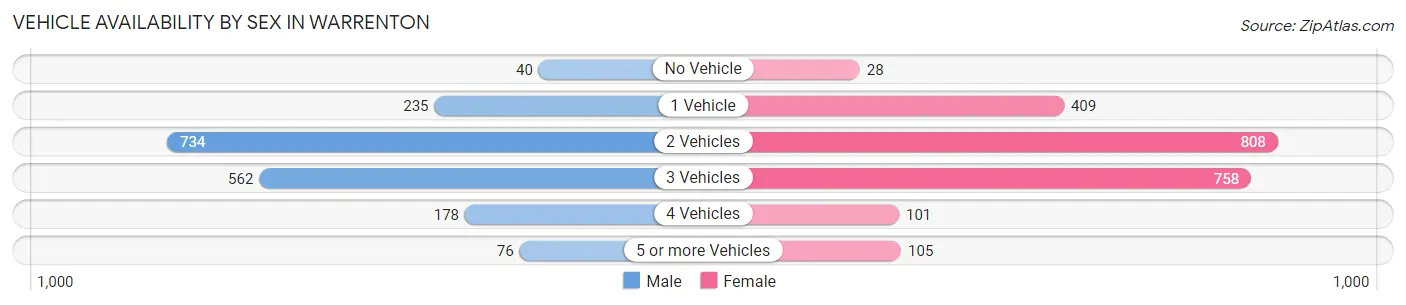
| Vehicles Available | Male | Female |
| No Vehicle | 40 (2.2%) | 28 (1.3%) |
| 1 Vehicle | 235 (12.9%) | 409 (18.5%) |
| 2 Vehicles | 734 (40.2%) | 808 (36.6%) |
| 3 Vehicles | 562 (30.8%) | 758 (34.3%) |
| 4 Vehicles | 178 (9.8%) | 101 (4.6%) |
| 5 or more Vehicles | 76 (4.2%) | 105 (4.8%) |
| Total | 1,825 (100.0%) | 2,209 (100.0%) |
Commute Time in Warrenton
The most frequently occuring commute durations in Warrenton are 30 to 34 minutes (555 commuters, 14.5%), 25 to 29 minutes (496 commuters, 12.9%), and 45 to 59 minutes (496 commuters, 12.9%).
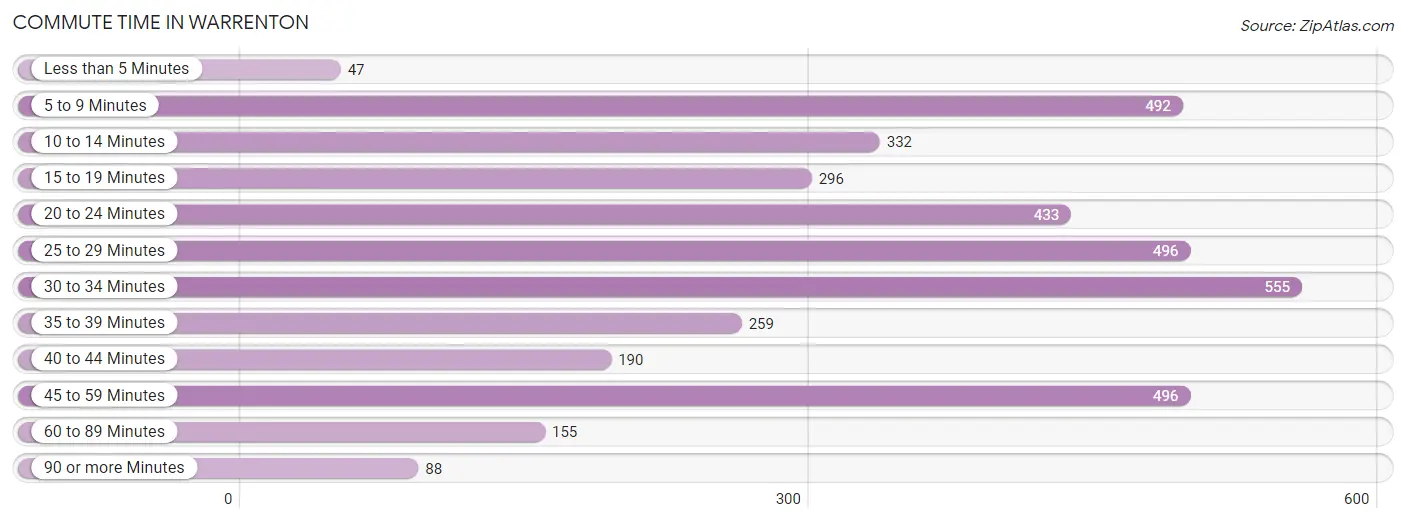
| Commute Time | # Commuters | % Commuters |
| Less than 5 Minutes | 47 | 1.2% |
| 5 to 9 Minutes | 492 | 12.8% |
| 10 to 14 Minutes | 332 | 8.6% |
| 15 to 19 Minutes | 296 | 7.7% |
| 20 to 24 Minutes | 433 | 11.3% |
| 25 to 29 Minutes | 496 | 12.9% |
| 30 to 34 Minutes | 555 | 14.5% |
| 35 to 39 Minutes | 259 | 6.8% |
| 40 to 44 Minutes | 190 | 5.0% |
| 45 to 59 Minutes | 496 | 12.9% |
| 60 to 89 Minutes | 155 | 4.0% |
| 90 or more Minutes | 88 | 2.3% |
Commute Time by Sex in Warrenton
The most common commute times in Warrenton are 45 to 59 minutes (409 commuters, 23.4%) for males and 25 to 29 minutes (391 commuters, 18.7%) for females.
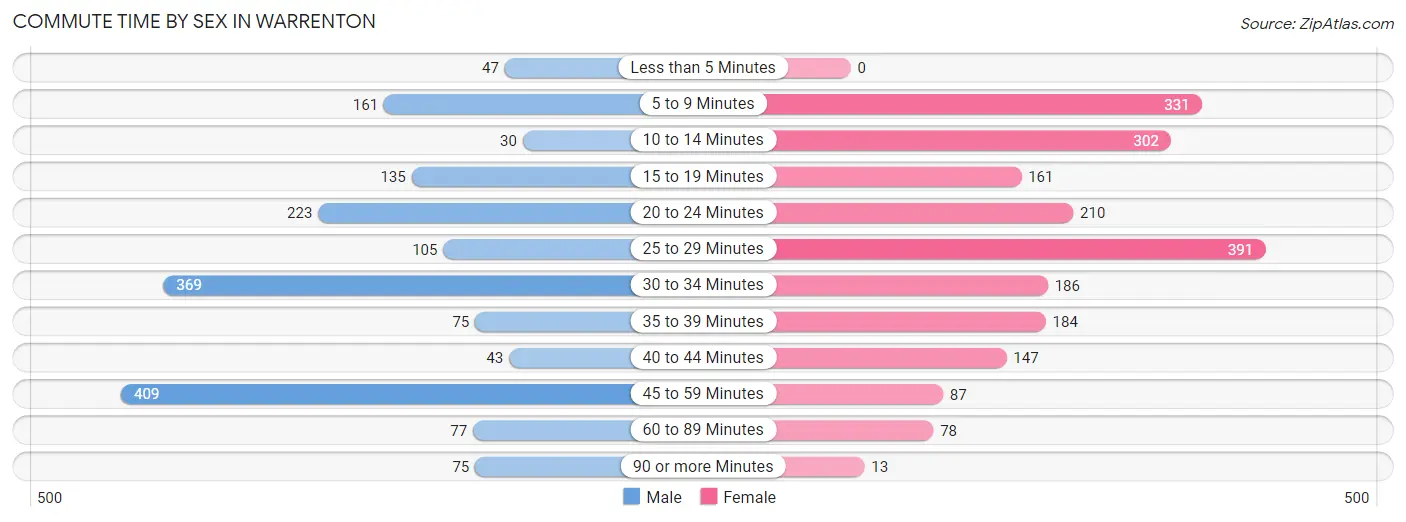
| Commute Time | Male | Female |
| Less than 5 Minutes | 47 (2.7%) | 0 (0.0%) |
| 5 to 9 Minutes | 161 (9.2%) | 331 (15.8%) |
| 10 to 14 Minutes | 30 (1.7%) | 302 (14.4%) |
| 15 to 19 Minutes | 135 (7.7%) | 161 (7.7%) |
| 20 to 24 Minutes | 223 (12.8%) | 210 (10.1%) |
| 25 to 29 Minutes | 105 (6.0%) | 391 (18.7%) |
| 30 to 34 Minutes | 369 (21.1%) | 186 (8.9%) |
| 35 to 39 Minutes | 75 (4.3%) | 184 (8.8%) |
| 40 to 44 Minutes | 43 (2.5%) | 147 (7.0%) |
| 45 to 59 Minutes | 409 (23.4%) | 87 (4.2%) |
| 60 to 89 Minutes | 77 (4.4%) | 78 (3.7%) |
| 90 or more Minutes | 75 (4.3%) | 13 (0.6%) |
Time of Departure to Work by Sex in Warrenton
The most frequent times of departure to work in Warrenton are 6:30 AM to 6:59 AM (444, 25.4%) for males and 4:00 PM to 11:59 PM (440, 21.0%) for females.
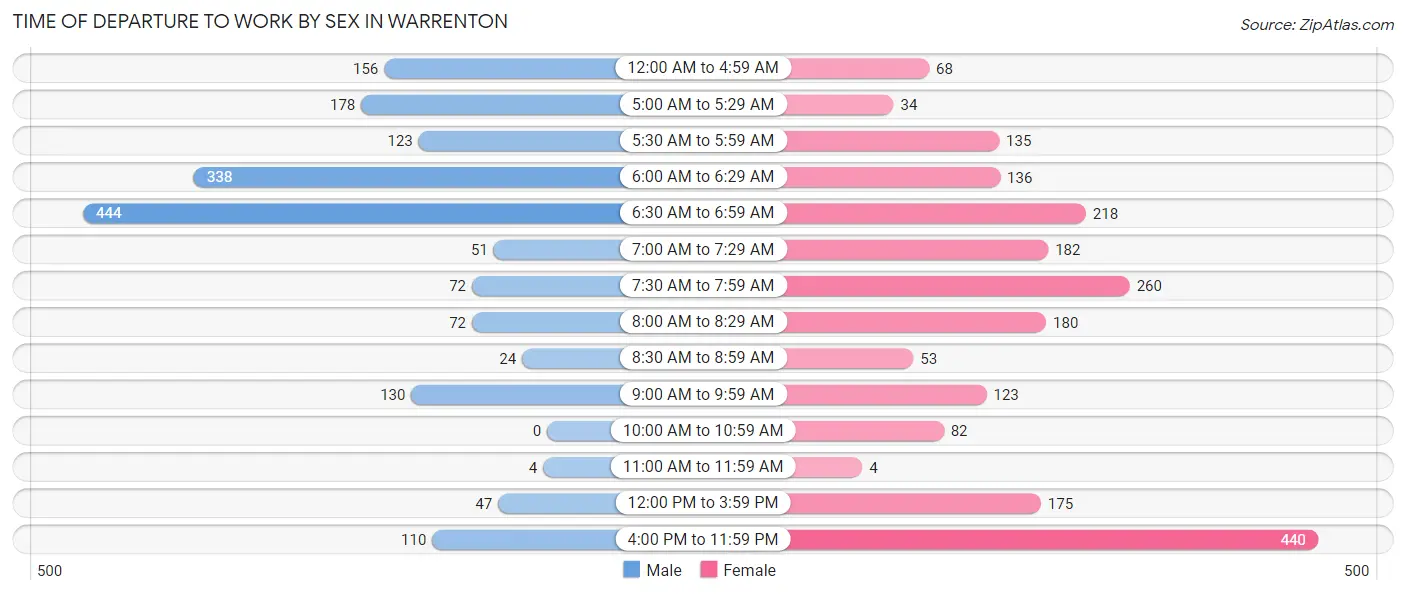
| Time of Departure | Male | Female |
| 12:00 AM to 4:59 AM | 156 (8.9%) | 68 (3.3%) |
| 5:00 AM to 5:29 AM | 178 (10.2%) | 34 (1.6%) |
| 5:30 AM to 5:59 AM | 123 (7.0%) | 135 (6.5%) |
| 6:00 AM to 6:29 AM | 338 (19.3%) | 136 (6.5%) |
| 6:30 AM to 6:59 AM | 444 (25.4%) | 218 (10.4%) |
| 7:00 AM to 7:29 AM | 51 (2.9%) | 182 (8.7%) |
| 7:30 AM to 7:59 AM | 72 (4.1%) | 260 (12.4%) |
| 8:00 AM to 8:29 AM | 72 (4.1%) | 180 (8.6%) |
| 8:30 AM to 8:59 AM | 24 (1.4%) | 53 (2.5%) |
| 9:00 AM to 9:59 AM | 130 (7.4%) | 123 (5.9%) |
| 10:00 AM to 10:59 AM | 0 (0.0%) | 82 (3.9%) |
| 11:00 AM to 11:59 AM | 4 (0.2%) | 4 (0.2%) |
| 12:00 PM to 3:59 PM | 47 (2.7%) | 175 (8.4%) |
| 4:00 PM to 11:59 PM | 110 (6.3%) | 440 (21.0%) |
| Total | 1,749 (100.0%) | 2,090 (100.0%) |
Housing Occupancy in Warrenton
Occupancy by Ownership in Warrenton
Of the total 3,201 dwellings in Warrenton, owner-occupied units account for 1,996 (62.4%), while renter-occupied units make up 1,205 (37.6%).
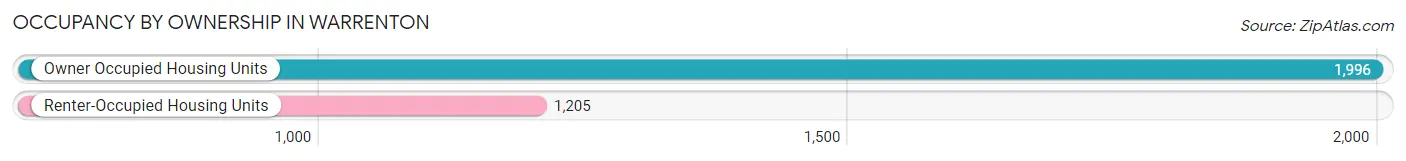
| Occupancy | # Housing Units | % Housing Units |
| Owner Occupied Housing Units | 1,996 | 62.4% |
| Renter-Occupied Housing Units | 1,205 | 37.6% |
| Total Occupied Housing Units | 3,201 | 100.0% |
Occupancy by Household Size in Warrenton
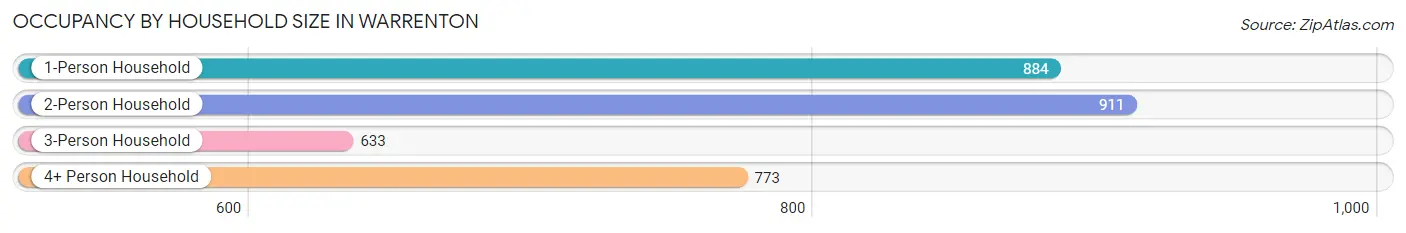
| Household Size | # Housing Units | % Housing Units |
| 1-Person Household | 884 | 27.6% |
| 2-Person Household | 911 | 28.5% |
| 3-Person Household | 633 | 19.8% |
| 4+ Person Household | 773 | 24.1% |
| Total Housing Units | 3,201 | 100.0% |
Occupancy by Ownership by Household Size in Warrenton
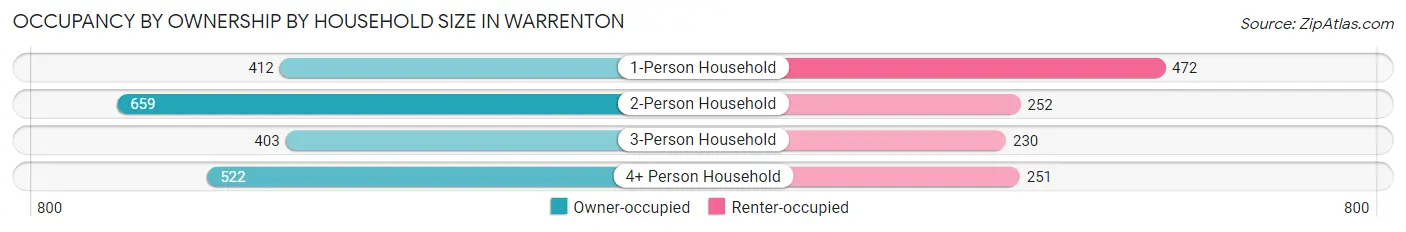
| Household Size | Owner-occupied | Renter-occupied |
| 1-Person Household | 412 (46.6%) | 472 (53.4%) |
| 2-Person Household | 659 (72.3%) | 252 (27.7%) |
| 3-Person Household | 403 (63.7%) | 230 (36.3%) |
| 4+ Person Household | 522 (67.5%) | 251 (32.5%) |
| Total Housing Units | 1,996 (62.4%) | 1,205 (37.6%) |
Occupancy by Educational Attainment in Warrenton
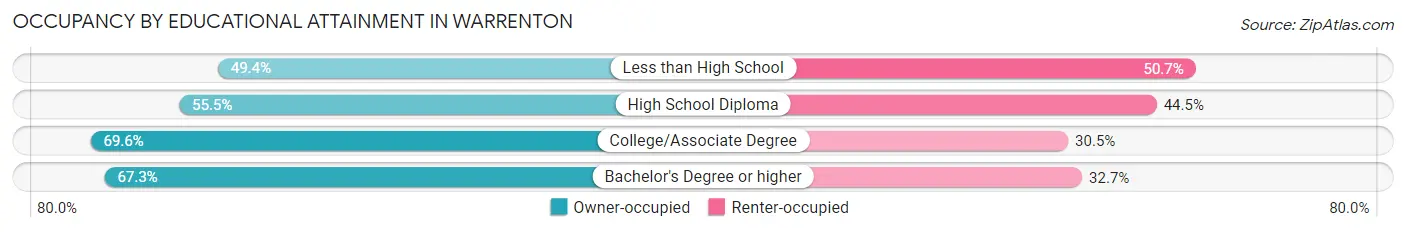
| Household Size | Owner-occupied | Renter-occupied |
| Less than High School | 152 (49.3%) | 156 (50.6%) |
| High School Diploma | 611 (55.5%) | 490 (44.5%) |
| College/Associate Degree | 829 (69.6%) | 363 (30.4%) |
| Bachelor's Degree or higher | 404 (67.3%) | 196 (32.7%) |
Occupancy by Age of Householder in Warrenton
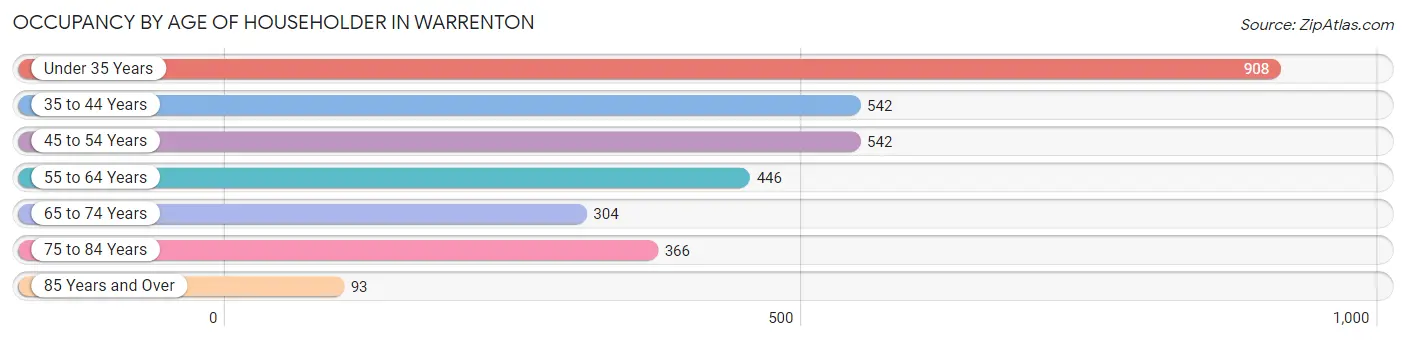
| Age Bracket | # Households | % Households |
| Under 35 Years | 908 | 28.4% |
| 35 to 44 Years | 542 | 16.9% |
| 45 to 54 Years | 542 | 16.9% |
| 55 to 64 Years | 446 | 13.9% |
| 65 to 74 Years | 304 | 9.5% |
| 75 to 84 Years | 366 | 11.4% |
| 85 Years and Over | 93 | 2.9% |
| Total | 3,201 | 100.0% |
Housing Finances in Warrenton
Median Income by Occupancy in Warrenton
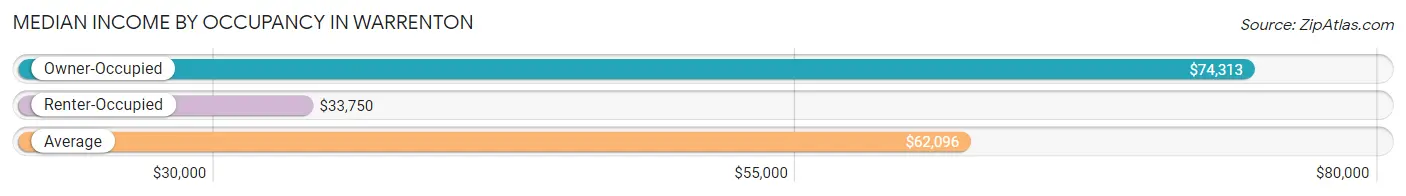
| Occupancy Type | # Households | Median Income |
| Owner-Occupied | 1,996 (62.4%) | $74,313 |
| Renter-Occupied | 1,205 (37.6%) | $33,750 |
| Average | 3,201 (100.0%) | $62,096 |
Occupancy by Householder Income Bracket in Warrenton
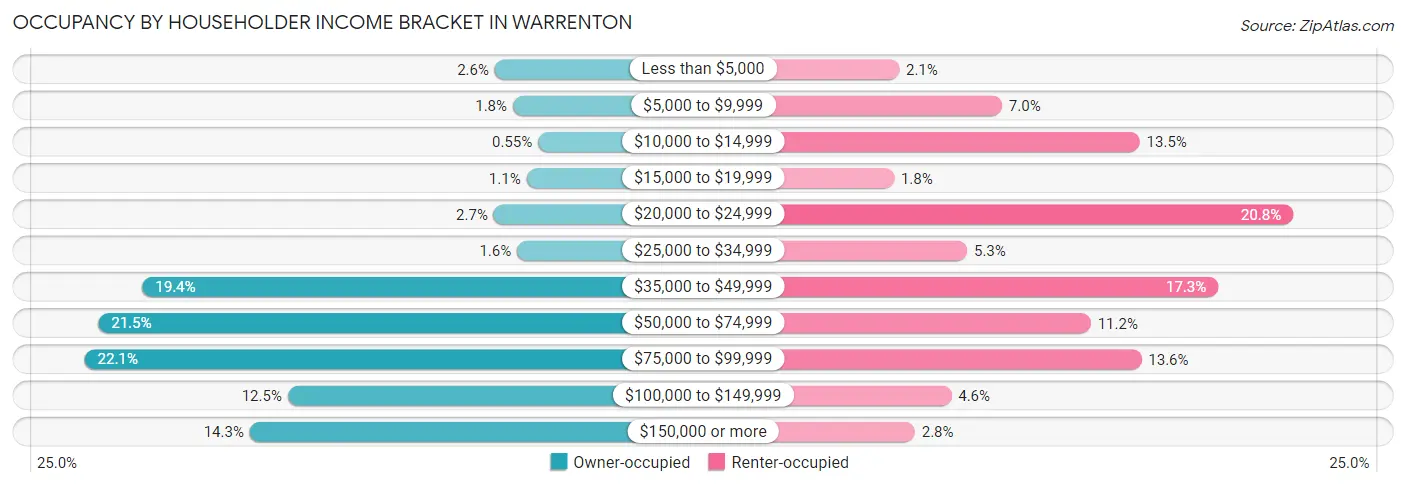
| Income Bracket | Owner-occupied | Renter-occupied |
| Less than $5,000 | 52 (2.6%) | 25 (2.1%) |
| $5,000 to $9,999 | 35 (1.8%) | 84 (7.0%) |
| $10,000 to $14,999 | 11 (0.5%) | 163 (13.5%) |
| $15,000 to $19,999 | 22 (1.1%) | 22 (1.8%) |
| $20,000 to $24,999 | 53 (2.7%) | 251 (20.8%) |
| $25,000 to $34,999 | 31 (1.5%) | 64 (5.3%) |
| $35,000 to $49,999 | 387 (19.4%) | 208 (17.3%) |
| $50,000 to $74,999 | 429 (21.5%) | 135 (11.2%) |
| $75,000 to $99,999 | 442 (22.1%) | 164 (13.6%) |
| $100,000 to $149,999 | 249 (12.5%) | 55 (4.6%) |
| $150,000 or more | 285 (14.3%) | 34 (2.8%) |
| Total | 1,996 (100.0%) | 1,205 (100.0%) |
Monthly Housing Cost Tiers in Warrenton
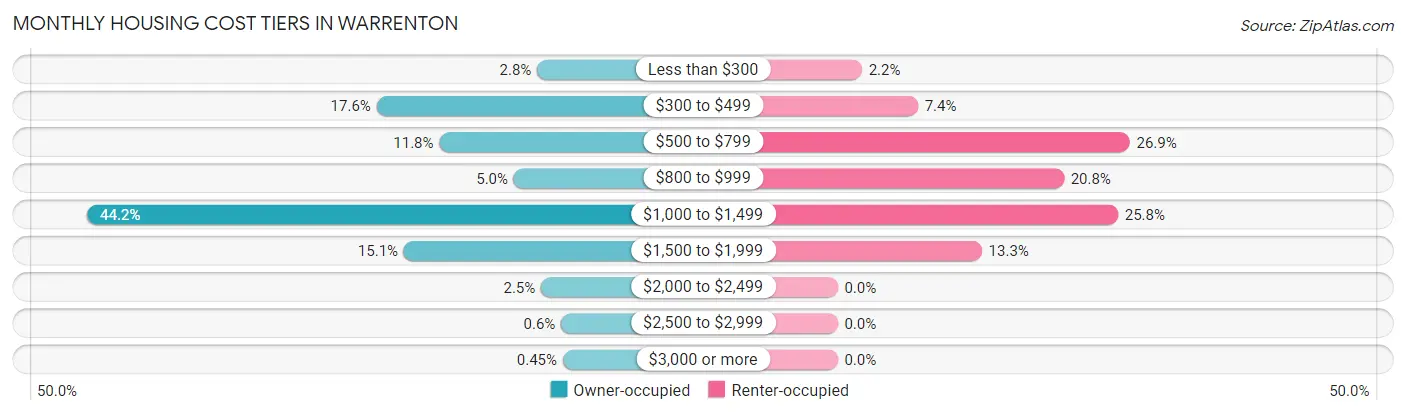
| Monthly Cost | Owner-occupied | Renter-occupied |
| Less than $300 | 56 (2.8%) | 27 (2.2%) |
| $300 to $499 | 351 (17.6%) | 89 (7.4%) |
| $500 to $799 | 236 (11.8%) | 324 (26.9%) |
| $800 to $999 | 99 (5.0%) | 251 (20.8%) |
| $1,000 to $1,499 | 883 (44.2%) | 311 (25.8%) |
| $1,500 to $1,999 | 301 (15.1%) | 160 (13.3%) |
| $2,000 to $2,499 | 49 (2.5%) | 0 (0.0%) |
| $2,500 to $2,999 | 12 (0.6%) | 0 (0.0%) |
| $3,000 or more | 9 (0.4%) | 0 (0.0%) |
| Total | 1,996 (100.0%) | 1,205 (100.0%) |
Physical Housing Characteristics in Warrenton
Housing Structures in Warrenton
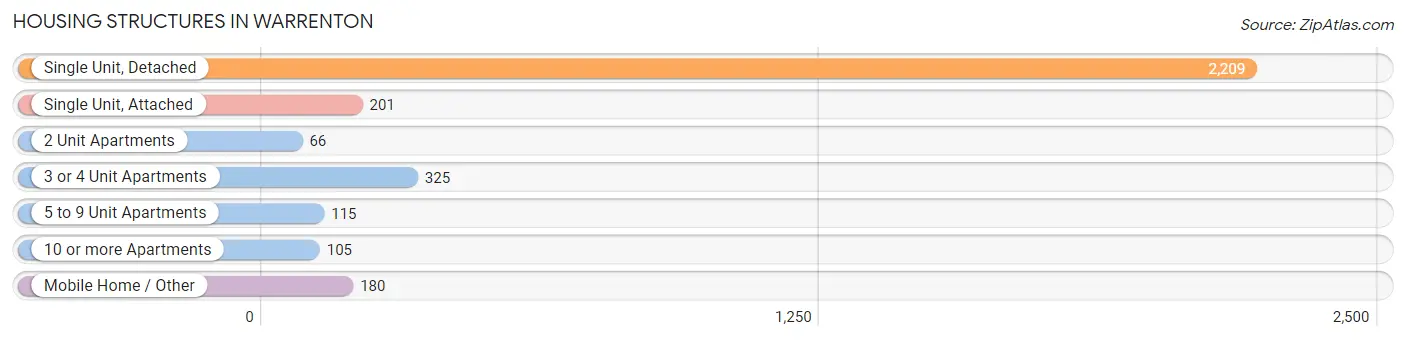
| Structure Type | # Housing Units | % Housing Units |
| Single Unit, Detached | 2,209 | 69.0% |
| Single Unit, Attached | 201 | 6.3% |
| 2 Unit Apartments | 66 | 2.1% |
| 3 or 4 Unit Apartments | 325 | 10.2% |
| 5 to 9 Unit Apartments | 115 | 3.6% |
| 10 or more Apartments | 105 | 3.3% |
| Mobile Home / Other | 180 | 5.6% |
| Total | 3,201 | 100.0% |
Housing Structures by Occupancy in Warrenton
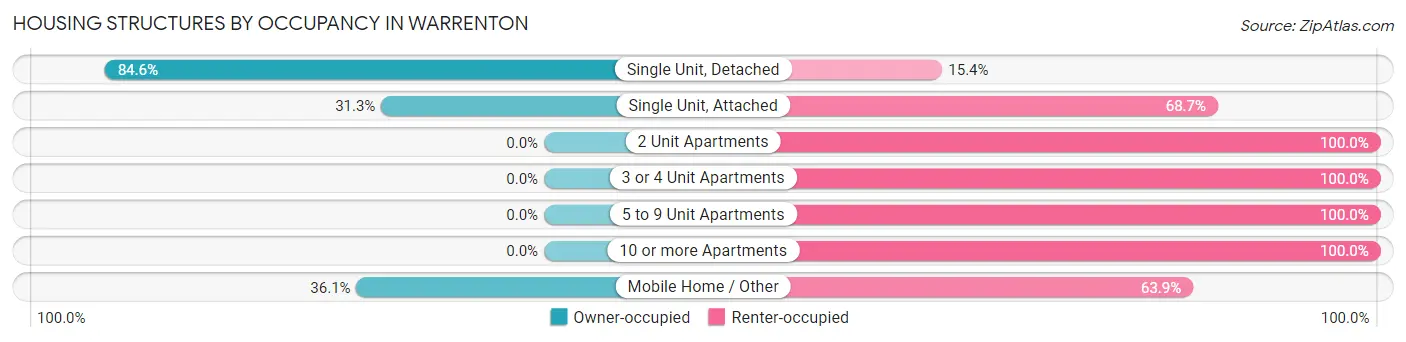
| Structure Type | Owner-occupied | Renter-occupied |
| Single Unit, Detached | 1,868 (84.6%) | 341 (15.4%) |
| Single Unit, Attached | 63 (31.3%) | 138 (68.7%) |
| 2 Unit Apartments | 0 (0.0%) | 66 (100.0%) |
| 3 or 4 Unit Apartments | 0 (0.0%) | 325 (100.0%) |
| 5 to 9 Unit Apartments | 0 (0.0%) | 115 (100.0%) |
| 10 or more Apartments | 0 (0.0%) | 105 (100.0%) |
| Mobile Home / Other | 65 (36.1%) | 115 (63.9%) |
| Total | 1,996 (62.4%) | 1,205 (37.6%) |
Housing Structures by Number of Rooms in Warrenton
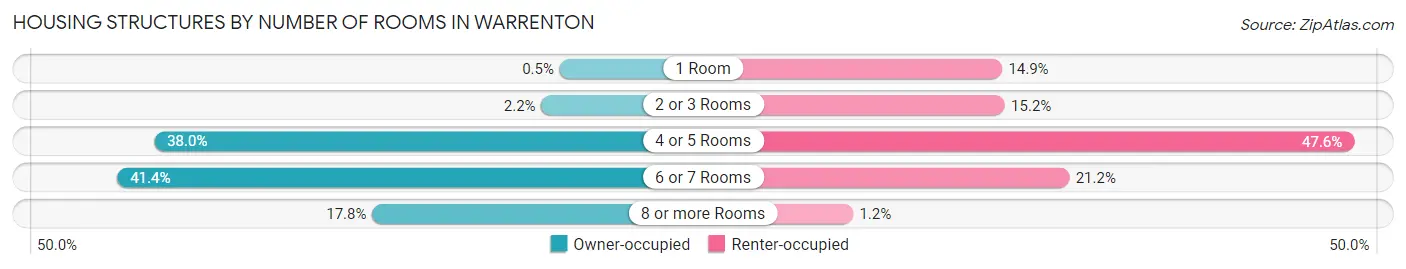
| Number of Rooms | Owner-occupied | Renter-occupied |
| 1 Room | 10 (0.5%) | 180 (14.9%) |
| 2 or 3 Rooms | 44 (2.2%) | 183 (15.2%) |
| 4 or 5 Rooms | 759 (38.0%) | 573 (47.5%) |
| 6 or 7 Rooms | 827 (41.4%) | 255 (21.2%) |
| 8 or more Rooms | 356 (17.8%) | 14 (1.2%) |
| Total | 1,996 (100.0%) | 1,205 (100.0%) |
Housing Structure by Heating Type in Warrenton
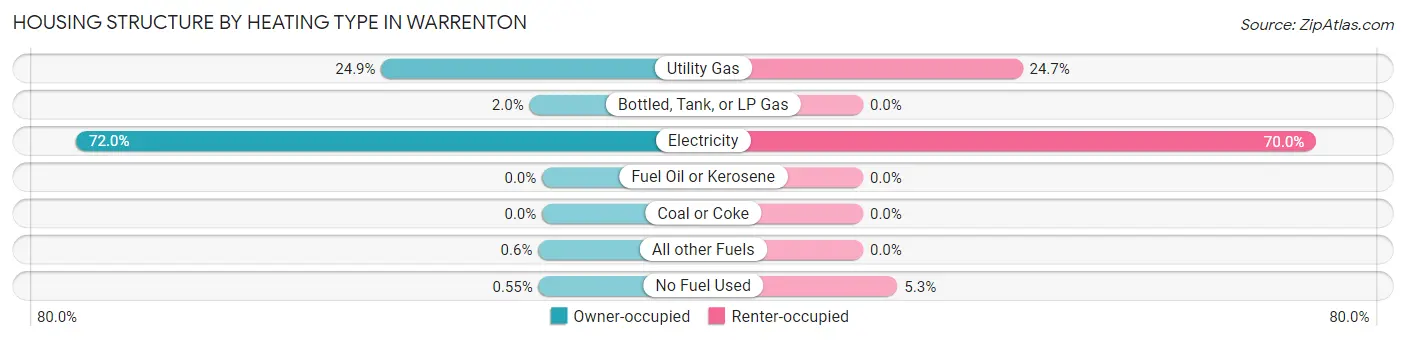
| Heating Type | Owner-occupied | Renter-occupied |
| Utility Gas | 496 (24.8%) | 297 (24.6%) |
| Bottled, Tank, or LP Gas | 39 (1.9%) | 0 (0.0%) |
| Electricity | 1,438 (72.0%) | 844 (70.0%) |
| Fuel Oil or Kerosene | 0 (0.0%) | 0 (0.0%) |
| Coal or Coke | 0 (0.0%) | 0 (0.0%) |
| All other Fuels | 12 (0.6%) | 0 (0.0%) |
| No Fuel Used | 11 (0.5%) | 64 (5.3%) |
| Total | 1,996 (100.0%) | 1,205 (100.0%) |
Household Vehicle Usage in Warrenton
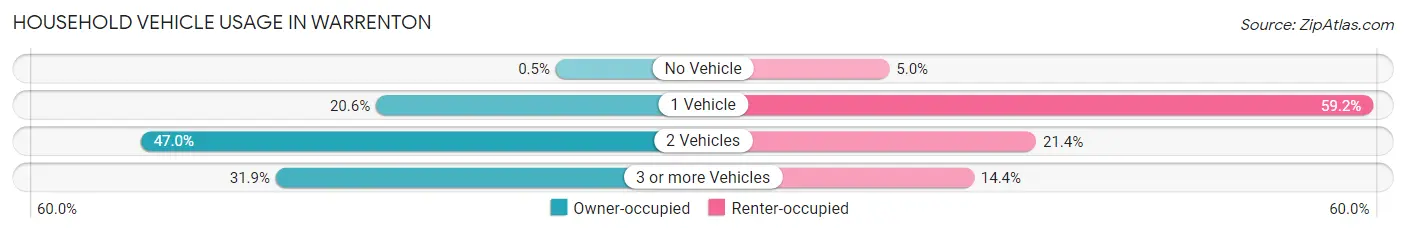
| Vehicles per Household | Owner-occupied | Renter-occupied |
| No Vehicle | 10 (0.5%) | 60 (5.0%) |
| 1 Vehicle | 412 (20.6%) | 713 (59.2%) |
| 2 Vehicles | 938 (47.0%) | 258 (21.4%) |
| 3 or more Vehicles | 636 (31.9%) | 174 (14.4%) |
| Total | 1,996 (100.0%) | 1,205 (100.0%) |
Real Estate & Mortgages in Warrenton
Real Estate and Mortgage Overview in Warrenton
| Characteristic | Without Mortgage | With Mortgage |
| Housing Units | 589 | 1,407 |
| Median Property Value | $175,200 | $169,200 |
| Median Household Income | $46,539 | $217 |
| Monthly Housing Costs | $449 | $9 |
| Real Estate Taxes | $1,745 | $47 |
Property Value by Mortgage Status in Warrenton
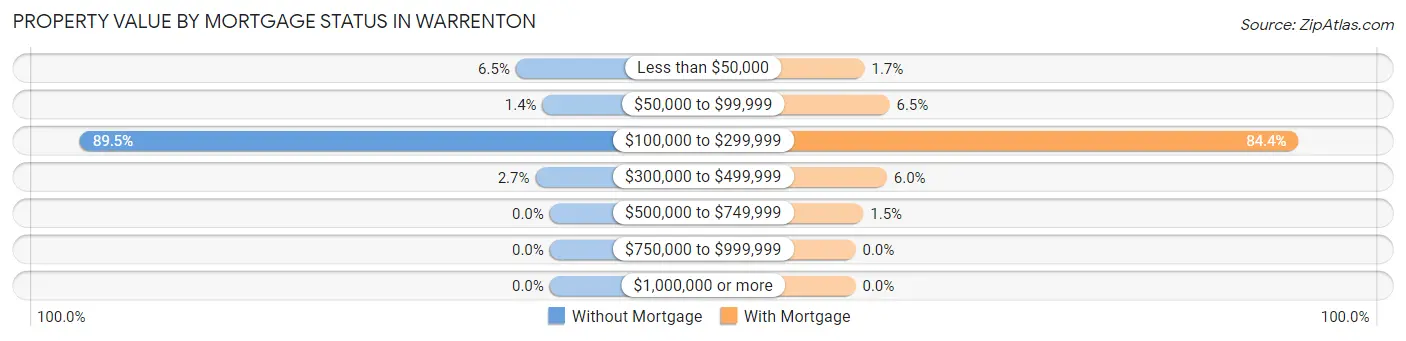
| Property Value | Without Mortgage | With Mortgage |
| Less than $50,000 | 38 (6.5%) | 24 (1.7%) |
| $50,000 to $99,999 | 8 (1.4%) | 91 (6.5%) |
| $100,000 to $299,999 | 527 (89.5%) | 1,187 (84.4%) |
| $300,000 to $499,999 | 16 (2.7%) | 84 (6.0%) |
| $500,000 to $749,999 | 0 (0.0%) | 21 (1.5%) |
| $750,000 to $999,999 | 0 (0.0%) | 0 (0.0%) |
| $1,000,000 or more | 0 (0.0%) | 0 (0.0%) |
| Total | 589 (100.0%) | 1,407 (100.0%) |
Household Income by Mortgage Status in Warrenton
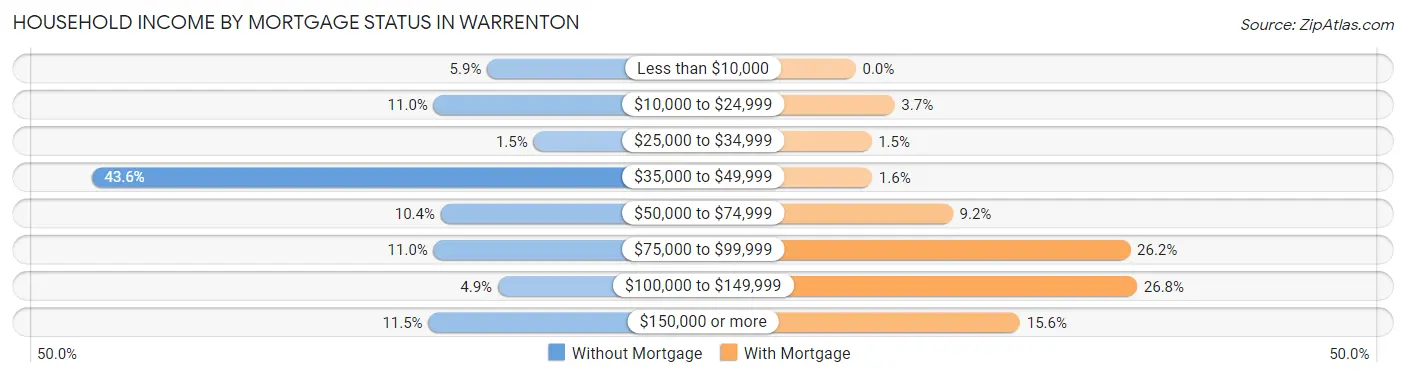
| Household Income | Without Mortgage | With Mortgage |
| Less than $10,000 | 35 (5.9%) | 0 (0.0%) |
| $10,000 to $24,999 | 65 (11.0%) | 52 (3.7%) |
| $25,000 to $34,999 | 9 (1.5%) | 21 (1.5%) |
| $35,000 to $49,999 | 257 (43.6%) | 22 (1.6%) |
| $50,000 to $74,999 | 61 (10.4%) | 130 (9.2%) |
| $75,000 to $99,999 | 65 (11.0%) | 368 (26.2%) |
| $100,000 to $149,999 | 29 (4.9%) | 377 (26.8%) |
| $150,000 or more | 68 (11.5%) | 220 (15.6%) |
| Total | 589 (100.0%) | 1,407 (100.0%) |
Property Value to Household Income Ratio in Warrenton
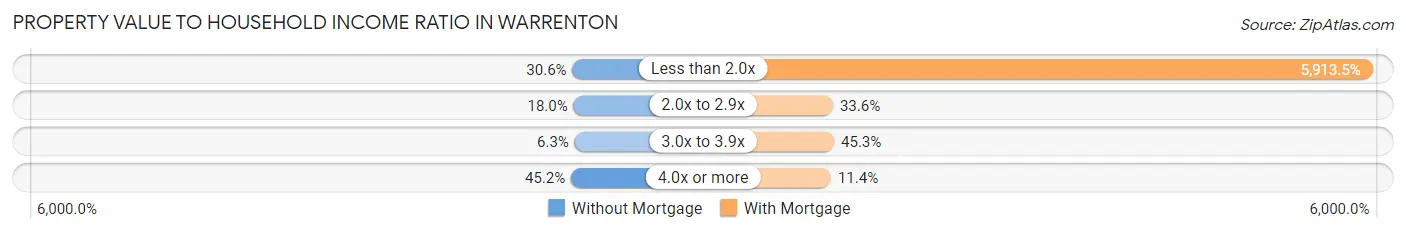
| Value-to-Income Ratio | Without Mortgage | With Mortgage |
| Less than 2.0x | 180 (30.6%) | 83,203 (5,913.5%) |
| 2.0x to 2.9x | 106 (18.0%) | 472 (33.6%) |
| 3.0x to 3.9x | 37 (6.3%) | 638 (45.3%) |
| 4.0x or more | 266 (45.2%) | 161 (11.4%) |
| Total | 589 (100.0%) | 1,407 (100.0%) |
Real Estate Taxes by Mortgage Status in Warrenton
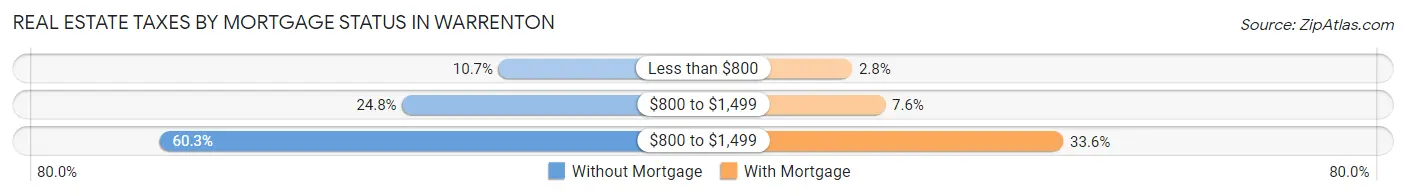
| Property Taxes | Without Mortgage | With Mortgage |
| Less than $800 | 63 (10.7%) | 39 (2.8%) |
| $800 to $1,499 | 146 (24.8%) | 107 (7.6%) |
| $800 to $1,499 | 355 (60.3%) | 473 (33.6%) |
| Total | 589 (100.0%) | 1,407 (100.0%) |
Health & Disability in Warrenton
Health Insurance Coverage by Age in Warrenton
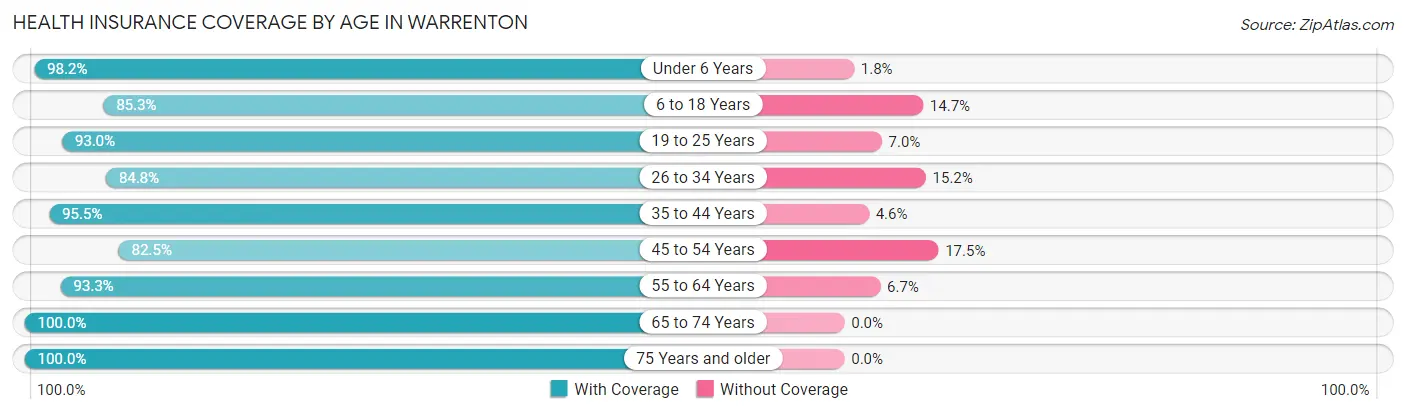
| Age Bracket | With Coverage | Without Coverage |
| Under 6 Years | 771 (98.2%) | 14 (1.8%) |
| 6 to 18 Years | 1,444 (85.3%) | 248 (14.7%) |
| 19 to 25 Years | 722 (93.0%) | 54 (7.0%) |
| 26 to 34 Years | 1,142 (84.8%) | 204 (15.2%) |
| 35 to 44 Years | 965 (95.5%) | 46 (4.5%) |
| 45 to 54 Years | 852 (82.5%) | 181 (17.5%) |
| 55 to 64 Years | 601 (93.3%) | 43 (6.7%) |
| 65 to 74 Years | 439 (100.0%) | 0 (0.0%) |
| 75 Years and older | 746 (100.0%) | 0 (0.0%) |
| Total | 7,682 (90.7%) | 790 (9.3%) |
Health Insurance Coverage by Citizenship Status in Warrenton
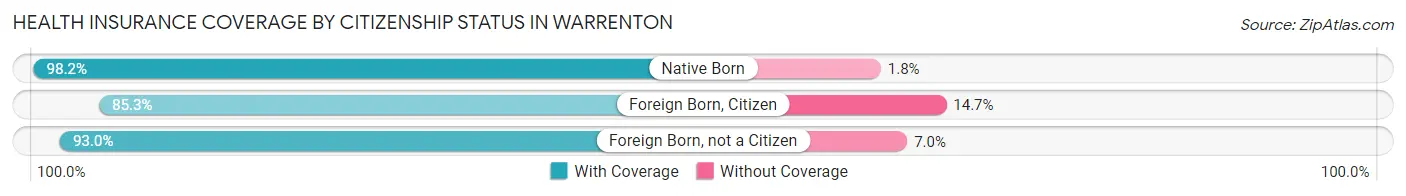
| Citizenship Status | With Coverage | Without Coverage |
| Native Born | 771 (98.2%) | 14 (1.8%) |
| Foreign Born, Citizen | 1,444 (85.3%) | 248 (14.7%) |
| Foreign Born, not a Citizen | 722 (93.0%) | 54 (7.0%) |
Health Insurance Coverage by Household Income in Warrenton
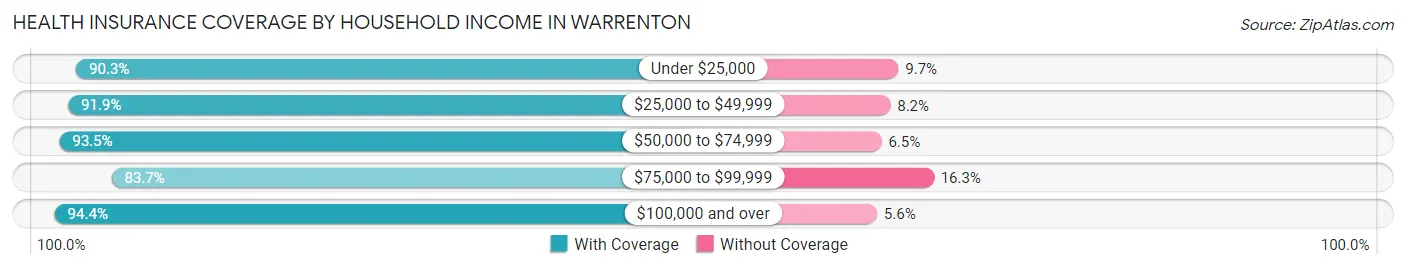
| Household Income | With Coverage | Without Coverage |
| Under $25,000 | 1,169 (90.3%) | 125 (9.7%) |
| $25,000 to $49,999 | 1,217 (91.8%) | 108 (8.2%) |
| $50,000 to $74,999 | 1,813 (93.5%) | 126 (6.5%) |
| $75,000 to $99,999 | 1,620 (83.7%) | 315 (16.3%) |
| $100,000 and over | 1,822 (94.4%) | 109 (5.6%) |
Public vs Private Health Insurance Coverage by Age in Warrenton
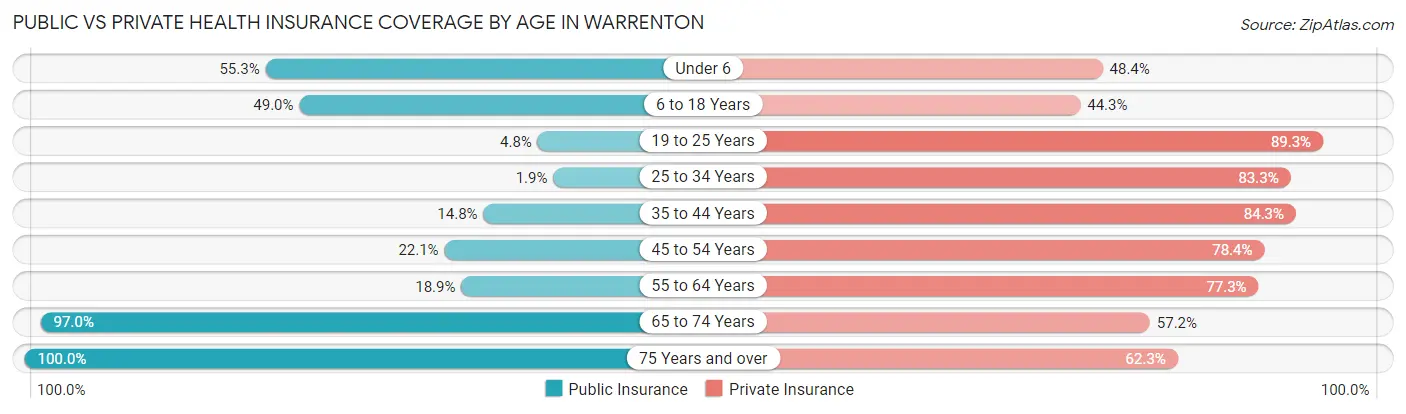
| Age Bracket | Public Insurance | Private Insurance |
| Under 6 | 434 (55.3%) | 380 (48.4%) |
| 6 to 18 Years | 829 (49.0%) | 749 (44.3%) |
| 19 to 25 Years | 37 (4.8%) | 693 (89.3%) |
| 25 to 34 Years | 25 (1.9%) | 1,121 (83.3%) |
| 35 to 44 Years | 150 (14.8%) | 852 (84.3%) |
| 45 to 54 Years | 228 (22.1%) | 810 (78.4%) |
| 55 to 64 Years | 122 (18.9%) | 498 (77.3%) |
| 65 to 74 Years | 426 (97.0%) | 251 (57.2%) |
| 75 Years and over | 746 (100.0%) | 465 (62.3%) |
| Total | 2,997 (35.4%) | 5,819 (68.7%) |
Disability Status by Sex by Age in Warrenton
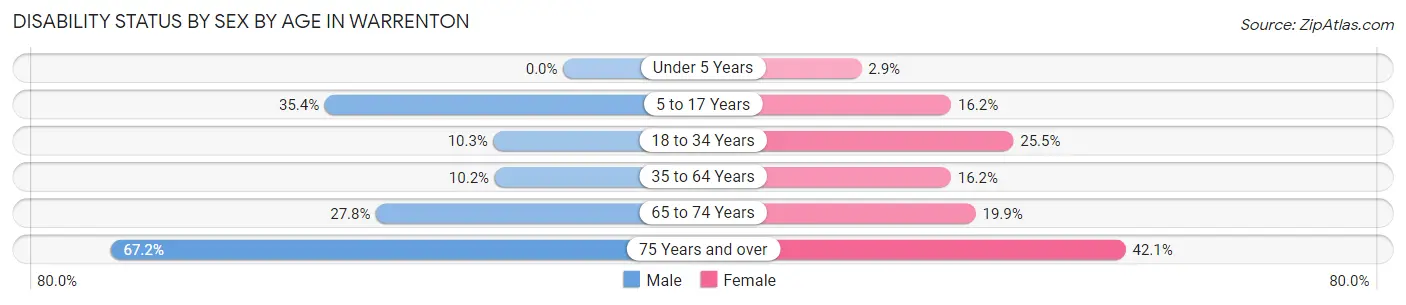
| Age Bracket | Male | Female |
| Under 5 Years | 0 (0.0%) | 10 (2.9%) |
| 5 to 17 Years | 241 (35.4%) | 170 (16.2%) |
| 18 to 34 Years | 106 (10.3%) | 299 (25.5%) |
| 35 to 64 Years | 120 (10.2%) | 244 (16.2%) |
| 65 to 74 Years | 45 (27.8%) | 55 (19.9%) |
| 75 Years and over | 160 (67.2%) | 214 (42.1%) |
Disability Class by Sex by Age in Warrenton
Disability Class: Hearing Difficulty
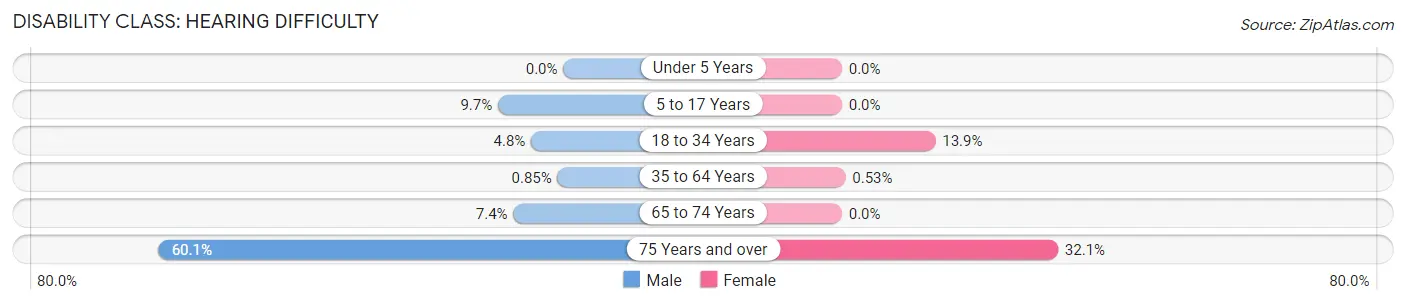
| Age Bracket | Male | Female |
| Under 5 Years | 0 (0.0%) | 0 (0.0%) |
| 5 to 17 Years | 66 (9.7%) | 0 (0.0%) |
| 18 to 34 Years | 49 (4.8%) | 163 (13.9%) |
| 35 to 64 Years | 10 (0.9%) | 8 (0.5%) |
| 65 to 74 Years | 12 (7.4%) | 0 (0.0%) |
| 75 Years and over | 143 (60.1%) | 163 (32.1%) |
Disability Class: Vision Difficulty
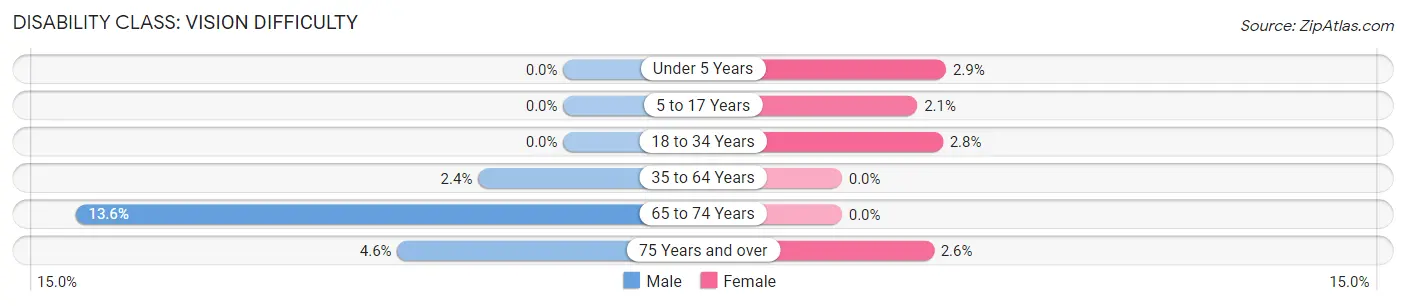
| Age Bracket | Male | Female |
| Under 5 Years | 0 (0.0%) | 10 (2.9%) |
| 5 to 17 Years | 0 (0.0%) | 22 (2.1%) |
| 18 to 34 Years | 0 (0.0%) | 33 (2.8%) |
| 35 to 64 Years | 28 (2.4%) | 0 (0.0%) |
| 65 to 74 Years | 22 (13.6%) | 0 (0.0%) |
| 75 Years and over | 11 (4.6%) | 13 (2.6%) |
Disability Class: Cognitive Difficulty
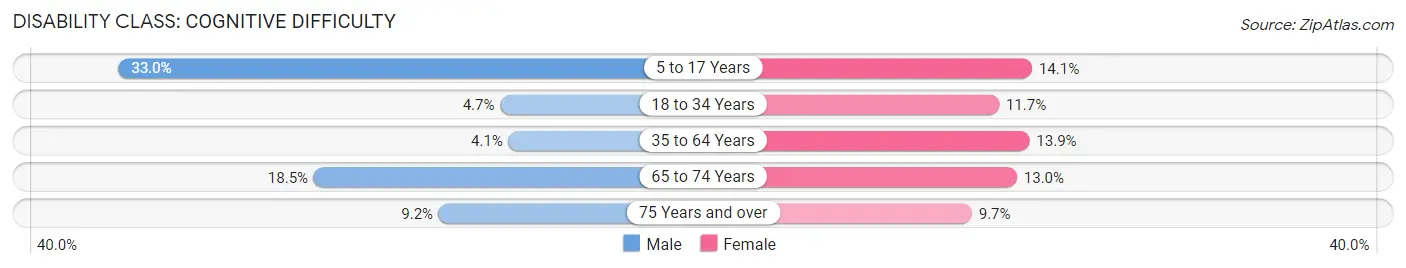
| Age Bracket | Male | Female |
| 5 to 17 Years | 225 (33.0%) | 148 (14.1%) |
| 18 to 34 Years | 48 (4.7%) | 137 (11.7%) |
| 35 to 64 Years | 48 (4.1%) | 210 (13.9%) |
| 65 to 74 Years | 30 (18.5%) | 36 (13.0%) |
| 75 Years and over | 22 (9.2%) | 49 (9.7%) |
Disability Class: Ambulatory Difficulty
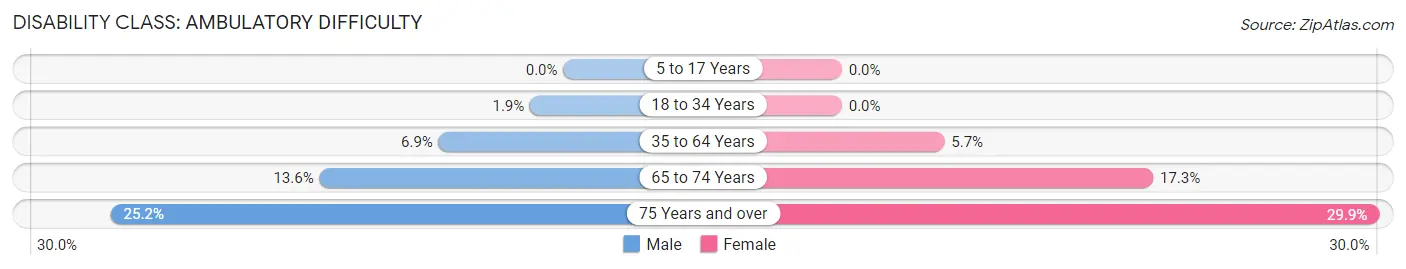
| Age Bracket | Male | Female |
| 5 to 17 Years | 0 (0.0%) | 0 (0.0%) |
| 18 to 34 Years | 19 (1.8%) | 0 (0.0%) |
| 35 to 64 Years | 82 (6.9%) | 86 (5.7%) |
| 65 to 74 Years | 22 (13.6%) | 48 (17.3%) |
| 75 Years and over | 60 (25.2%) | 152 (29.9%) |
Disability Class: Self-Care Difficulty
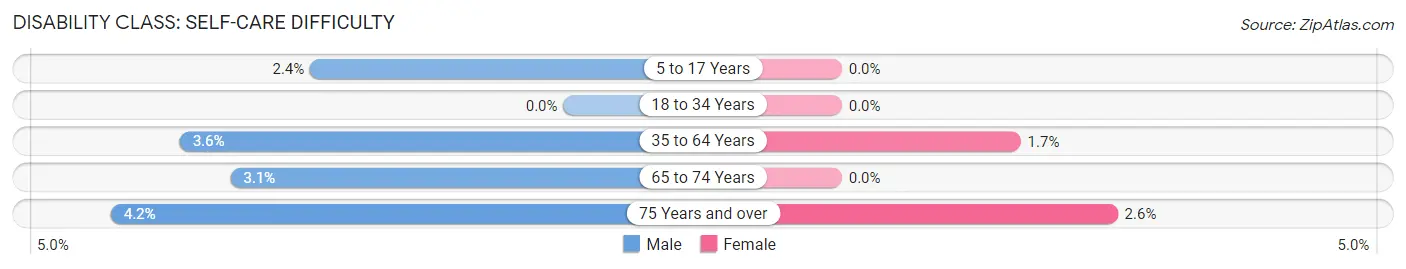
| Age Bracket | Male | Female |
| 5 to 17 Years | 16 (2.4%) | 0 (0.0%) |
| 18 to 34 Years | 0 (0.0%) | 0 (0.0%) |
| 35 to 64 Years | 42 (3.6%) | 25 (1.7%) |
| 65 to 74 Years | 5 (3.1%) | 0 (0.0%) |
| 75 Years and over | 10 (4.2%) | 13 (2.6%) |
Technology Access in Warrenton
Computing Device Access in Warrenton
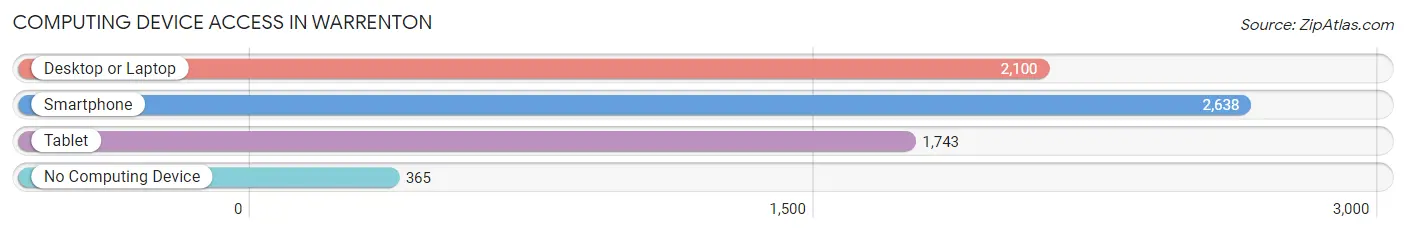
| Device Type | # Households | % Households |
| Desktop or Laptop | 2,100 | 65.6% |
| Smartphone | 2,638 | 82.4% |
| Tablet | 1,743 | 54.4% |
| No Computing Device | 365 | 11.4% |
| Total | 3,201 | 100.0% |
Internet Access in Warrenton
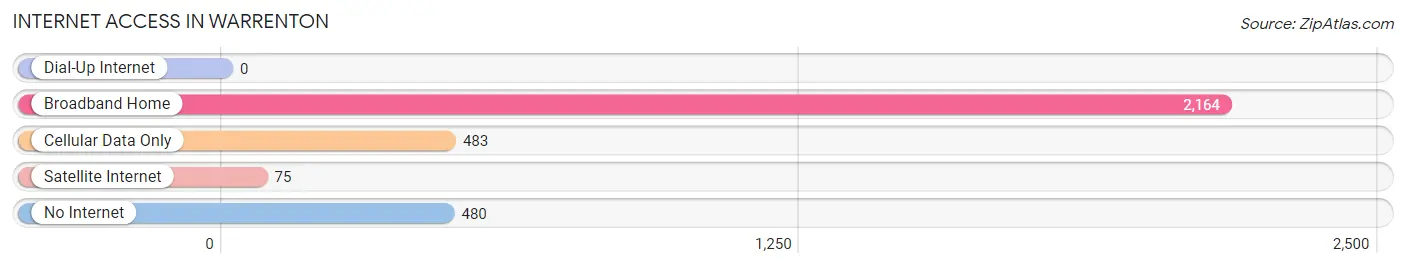
| Internet Type | # Households | % Households |
| Dial-Up Internet | 0 | 0.0% |
| Broadband Home | 2,164 | 67.6% |
| Cellular Data Only | 483 | 15.1% |
| Satellite Internet | 75 | 2.3% |
| No Internet | 480 | 15.0% |
| Total | 3,201 | 100.0% |
Warrenton Summary
Warrenton, Missouri is a small city located in Warren County, Missouri, United States. It is situated approximately 50 miles west of St. Louis and is part of the St. Louis Metropolitan Statistical Area. The city has a population of approximately 8,000 people and is the county seat of Warren County.
History
The area that is now Warrenton was first settled in the early 1800s by French and German immigrants. The town was originally known as “L’Eglise”, which means “the church” in French. The town was renamed Warrenton in 1818 in honor of General Joseph Warren, a Revolutionary War hero.
In 1819, the town was officially incorporated and the first post office was established. The town grew rapidly in the mid-1800s, becoming a center for trade and commerce. The town was also home to several churches, schools, and businesses.
In the late 1800s, the town began to decline due to the construction of the Missouri Pacific Railroad, which bypassed Warrenton. The town’s population decreased and many businesses closed.
In the early 1900s, the town began to experience a resurgence. The construction of the Warrenton-Fulton State Highway in the 1920s helped to bring new businesses and residents to the area. The town also experienced a population boom in the 1950s and 1960s due to the growth of nearby St. Louis.
Geography
Warrenton is located in Warren County, Missouri, approximately 50 miles west of St. Louis. The city is situated on the Missouri River and is surrounded by rolling hills and farmland. The city has a total area of 4.2 square miles, all of which is land.
The climate in Warrenton is classified as humid continental, with hot, humid summers and cold, snowy winters. The average annual temperature is 54 degrees Fahrenheit and the average annual precipitation is 40 inches.
Economy
The economy of Warrenton is largely based on agriculture and manufacturing. The city is home to several large farms and agricultural businesses, as well as several manufacturing plants. The city is also home to several retail stores, restaurants, and other businesses.
The city’s largest employer is the Warrenton-Fulton State Highway, which employs over 1,000 people. Other major employers include the Warrenton-Fulton School District, the Warren County Courthouse, and several local businesses.
Demographics
As of the 2010 census, Warrenton had a population of 8,000 people. The racial makeup of the city was 95.3% White, 1.2% African American, 0.7% Native American, 0.5% Asian, 0.1% Pacific Islander, 0.7% from other races, and 1.5% from two or more races. Hispanic or Latino of any race were 2.2% of the population.
The median household income in Warrenton was $45,000, and the median family income was $51,000. The per capita income was $20,000. About 10.3% of the population was below the poverty line.
Conclusion
Warrenton, Missouri is a small city located in Warren County, Missouri, United States. It is situated approximately 50 miles west of St. Louis and is part of the St. Louis Metropolitan Statistical Area. The city has a population of approximately 8,000 people and is the county seat of Warren County. The economy of Warrenton is largely based on agriculture and manufacturing, and the city is home to several large farms and agricultural businesses, as well as several manufacturing plants. The racial makeup of the city is predominantly White, with a small percentage of African American, Native American, Asian, and Pacific Islander residents. The median household income in Warrenton is $45,000, and the median family income is $51,000.
Common Questions
What is Per Capita Income in Warrenton?
Per Capita income in Warrenton is $26,622.
What is the Median Family Income in Warrenton?
Median Family Income in Warrenton is $69,401.
What is the Median Household income in Warrenton?
Median Household Income in Warrenton is $62,096.
What is Income or Wage Gap in Warrenton?
Income or Wage Gap in Warrenton is 25.8%.
Women in Warrenton earn 74.2 cents for every dollar earned by a man.
What is Inequality or Gini Index in Warrenton?
Inequality or Gini Index in Warrenton is 0.41.
What is the Total Population of Warrenton?
Total Population of Warrenton is 8,648.
What is the Total Male Population of Warrenton?
Total Male Population of Warrenton is 3,734.
What is the Total Female Population of Warrenton?
Total Female Population of Warrenton is 4,914.
What is the Ratio of Males per 100 Females in Warrenton?
There are 75.99 Males per 100 Females in Warrenton.
What is the Ratio of Females per 100 Males in Warrenton?
There are 131.60 Females per 100 Males in Warrenton.
What is the Median Population Age in Warrenton?
Median Population Age in Warrenton is 32.0 Years.
What is the Average Family Size in Warrenton
Average Family Size in Warrenton is 3.3 People.
What is the Average Household Size in Warrenton
Average Household Size in Warrenton is 2.6 People.
How Large is the Labor Force in Warrenton?
There are 4,354 People in the Labor Forcein in Warrenton.
What is the Percentage of People in the Labor Force in Warrenton?
67.2% of People are in the Labor Force in Warrenton.
What is the Unemployment Rate in Warrenton?
Unemployment Rate in Warrenton is 5.2%.