Jackson, MO Map & Demographics
Jackson Map
Jackson Overview
$35,811
PER CAPITA INCOME
$85,471
AVG FAMILY INCOME
$72,500
AVG HOUSEHOLD INCOME
38.6%
WAGE / INCOME GAP [ % ]
61.4¢/ $1
WAGE / INCOME GAP [ $ ]
0.43
INEQUALITY / GINI INDEX
15,394
TOTAL POPULATION
7,543
MALE POPULATION
7,851
FEMALE POPULATION
96.08
MALES / 100 FEMALES
104.08
FEMALES / 100 MALES
35.0
MEDIAN AGE
3.0
AVG FAMILY SIZE
2.5
AVG HOUSEHOLD SIZE
7,805
LABOR FORCE [ PEOPLE ]
66.4%
PERCENT IN LABOR FORCE
3.8%
UNEMPLOYMENT RATE
Jackson Zip Codes
Jackson Area Codes
Income in Jackson
Income Overview in Jackson
Per Capita Income in Jackson is $35,811, while median incomes of families and households are $85,471 and $72,500 respectively.
| Characteristic | Number | Measure |
| Per Capita Income | 15,394 | $35,811 |
| Median Family Income | 4,261 | $85,471 |
| Mean Family Income | 4,261 | $106,185 |
| Median Household Income | 5,928 | $72,500 |
| Mean Household Income | 5,928 | $92,594 |
| Income Deficit | 4,261 | $0 |
| Wage / Income Gap (%) | 15,394 | 38.59% |
| Wage / Income Gap ($) | 15,394 | 61.41¢ per $1 |
| Gini / Inequality Index | 15,394 | 0.43 |
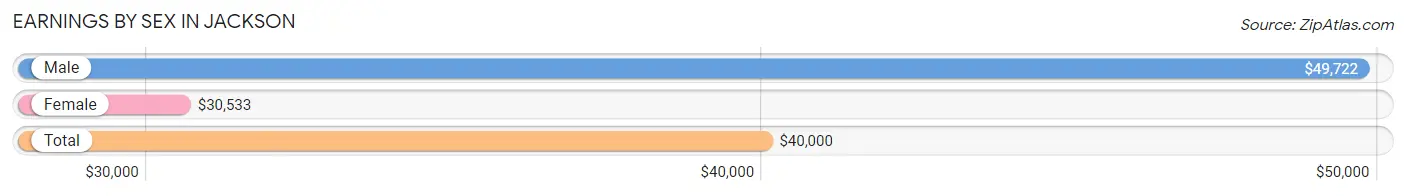
Earnings by Sex in Jackson
Average Earnings in Jackson are $40,000, $49,722 for men and $30,533 for women, a difference of 38.6%.
| Sex | Number | Average Earnings |
| Male | 4,190 (51.0%) | $49,722 |
| Female | 4,020 (49.0%) | $30,533 |
| Total | 8,210 (100.0%) | $40,000 |
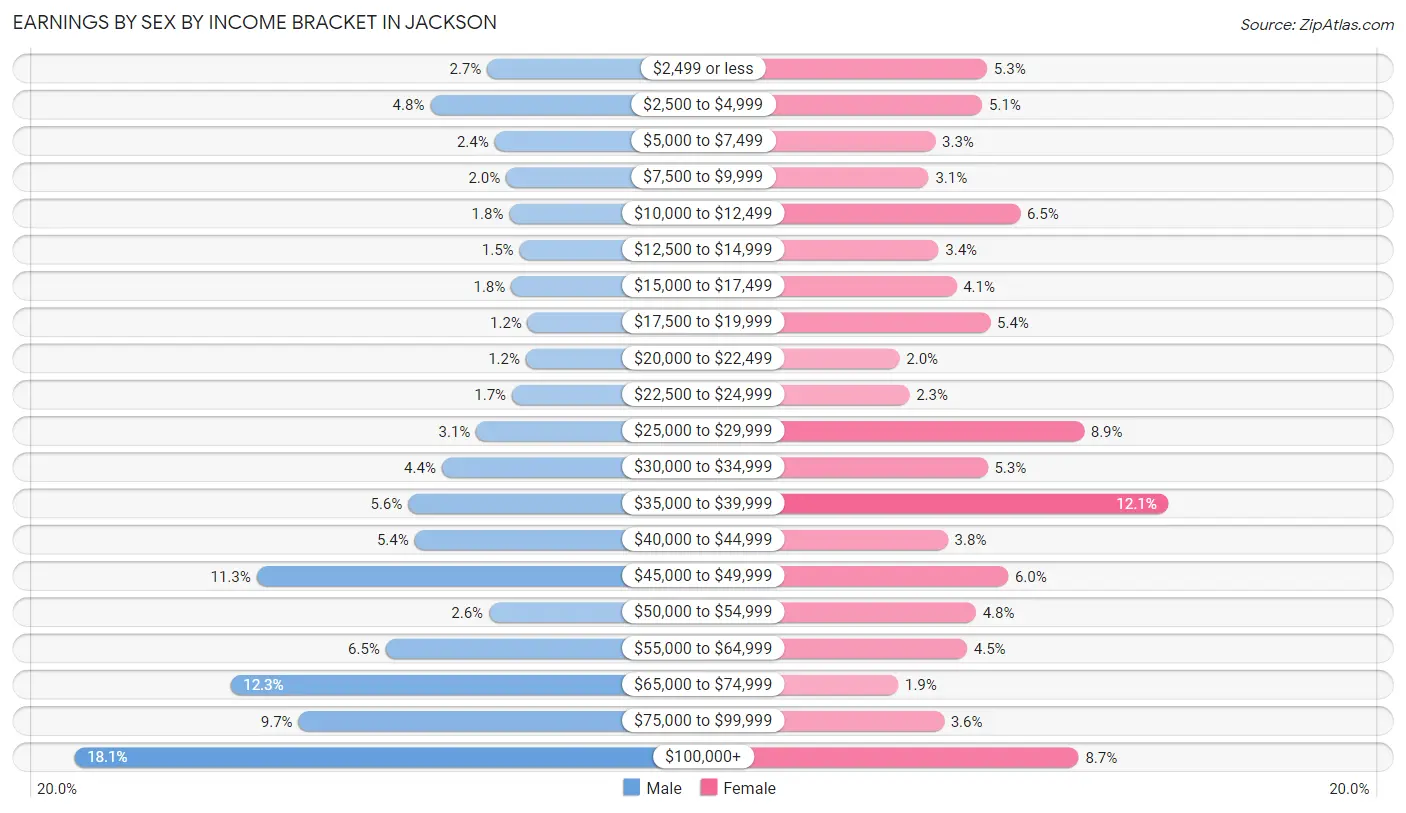
Earnings by Sex by Income Bracket in Jackson
The most common earnings brackets in Jackson are $100,000+ for men (760 | 18.1%) and $35,000 to $39,999 for women (485 | 12.1%).
| Income | Male | Female |
| $2,499 or less | 112 (2.7%) | 211 (5.2%) |
| $2,500 to $4,999 | 201 (4.8%) | 204 (5.1%) |
| $5,000 to $7,499 | 100 (2.4%) | 133 (3.3%) |
| $7,500 to $9,999 | 82 (2.0%) | 123 (3.1%) |
| $10,000 to $12,499 | 77 (1.8%) | 261 (6.5%) |
| $12,500 to $14,999 | 61 (1.5%) | 138 (3.4%) |
| $15,000 to $17,499 | 74 (1.8%) | 165 (4.1%) |
| $17,500 to $19,999 | 48 (1.1%) | 216 (5.4%) |
| $20,000 to $22,499 | 51 (1.2%) | 79 (2.0%) |
| $22,500 to $24,999 | 73 (1.7%) | 94 (2.3%) |
| $25,000 to $29,999 | 129 (3.1%) | 357 (8.9%) |
| $30,000 to $34,999 | 183 (4.4%) | 212 (5.3%) |
| $35,000 to $39,999 | 236 (5.6%) | 485 (12.1%) |
| $40,000 to $44,999 | 226 (5.4%) | 152 (3.8%) |
| $45,000 to $49,999 | 474 (11.3%) | 243 (6.0%) |
| $50,000 to $54,999 | 109 (2.6%) | 194 (4.8%) |
| $55,000 to $64,999 | 271 (6.5%) | 181 (4.5%) |
| $65,000 to $74,999 | 515 (12.3%) | 77 (1.9%) |
| $75,000 to $99,999 | 408 (9.7%) | 146 (3.6%) |
| $100,000+ | 760 (18.1%) | 349 (8.7%) |
| Total | 4,190 (100.0%) | 4,020 (100.0%) |
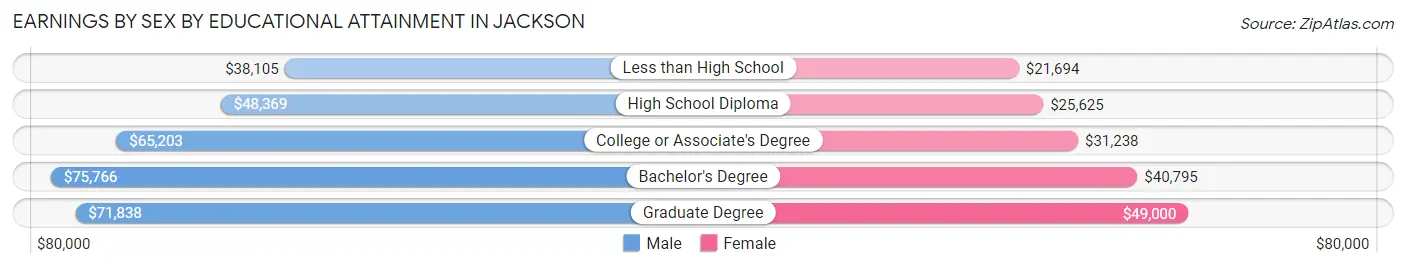
Earnings by Sex by Educational Attainment in Jackson
Average earnings in Jackson are $56,667 for men and $36,009 for women, a difference of 36.5%. Men with an educational attainment of bachelor's degree enjoy the highest average annual earnings of $75,766, while those with less than high school education earn the least with $38,105. Women with an educational attainment of graduate degree earn the most with the average annual earnings of $49,000, while those with less than high school education have the smallest earnings of $21,694.
| Educational Attainment | Male Income | Female Income |
| Less than High School | $38,105 | $21,694 |
| High School Diploma | $48,369 | $25,625 |
| College or Associate's Degree | $65,203 | $31,238 |
| Bachelor's Degree | $75,766 | $40,795 |
| Graduate Degree | $71,838 | $49,000 |
| Total | $56,667 | $36,009 |
Family Income in Jackson
Family Income Brackets in Jackson
According to the Jackson family income data, there are 980 families falling into the $100,000 to $149,999 income range, which is the most common income bracket and makes up 23.0% of all families. Conversely, the less than $10,000 income bracket is the least frequent group with only 38 families (0.9%) belonging to this category.
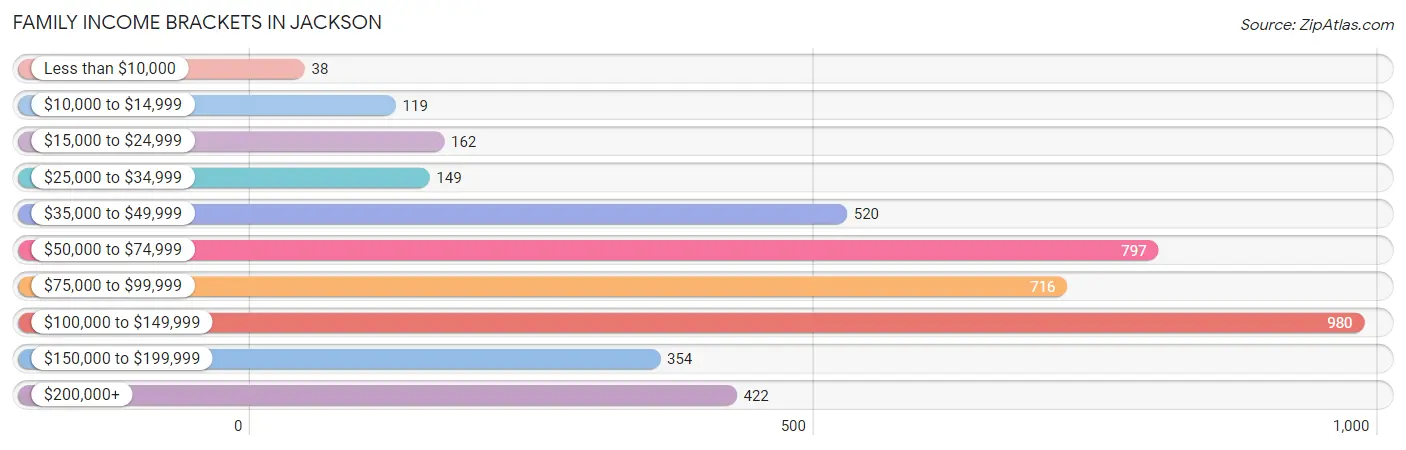
| Income Bracket | # Families | % Families |
| Less than $10,000 | 38 | 0.9% |
| $10,000 to $14,999 | 119 | 2.8% |
| $15,000 to $24,999 | 162 | 3.8% |
| $25,000 to $34,999 | 149 | 3.5% |
| $35,000 to $49,999 | 520 | 12.2% |
| $50,000 to $74,999 | 797 | 18.7% |
| $75,000 to $99,999 | 716 | 16.8% |
| $100,000 to $149,999 | 980 | 23.0% |
| $150,000 to $199,999 | 354 | 8.3% |
| $200,000+ | 422 | 9.9% |
Family Income by Famaliy Size in Jackson
5-person families (209 | 4.9%) account for the highest median family income in Jackson with $124,375 per family, while 2-person families (2,019 | 47.4%) have the highest median income of $35,453 per family member.
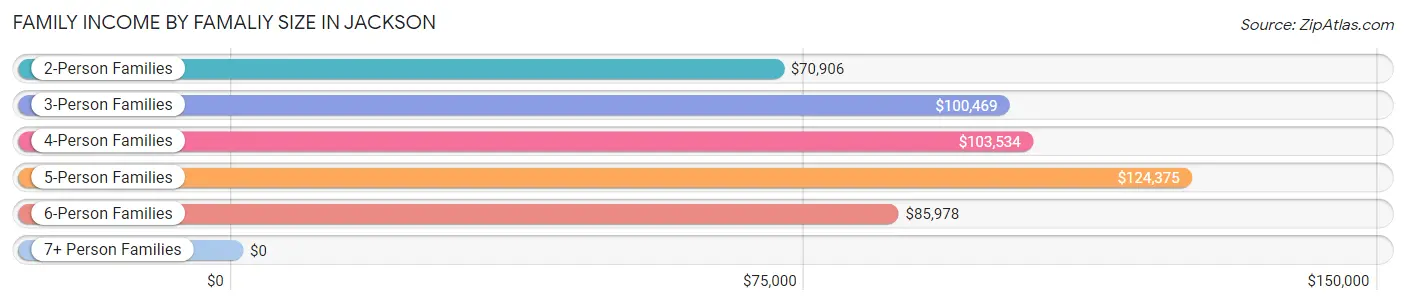
| Income Bracket | # Families | Median Income |
| 2-Person Families | 2,019 (47.4%) | $70,906 |
| 3-Person Families | 966 (22.7%) | $100,469 |
| 4-Person Families | 912 (21.4%) | $103,534 |
| 5-Person Families | 209 (4.9%) | $124,375 |
| 6-Person Families | 130 (3.0%) | $85,978 |
| 7+ Person Families | 25 (0.6%) | $0 |
| Total | 4,261 (100.0%) | $85,471 |
Family Income by Number of Earners in Jackson
The median family income in Jackson is $85,471, with families comprising 3+ earners (323) having the highest median family income of $128,869, while families with no earners (408) have the lowest median family income of $39,082, accounting for 7.6% and 9.6% of families, respectively.
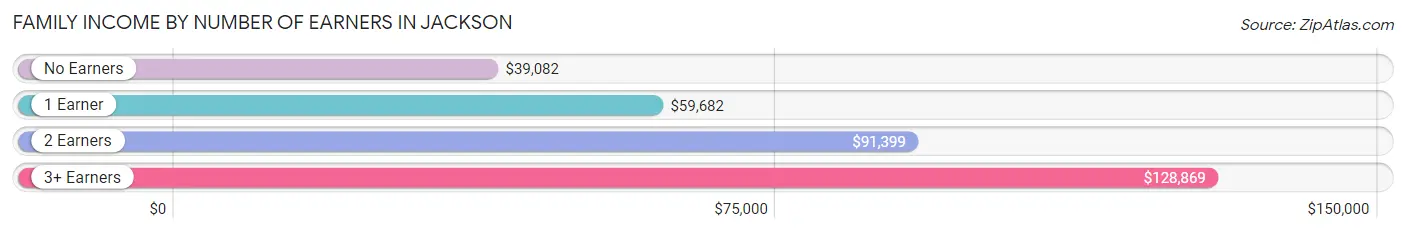
| Number of Earners | # Families | Median Income |
| No Earners | 408 (9.6%) | $39,082 |
| 1 Earner | 1,235 (29.0%) | $59,682 |
| 2 Earners | 2,295 (53.9%) | $91,399 |
| 3+ Earners | 323 (7.6%) | $128,869 |
| Total | 4,261 (100.0%) | $85,471 |
Household Income in Jackson
Household Income Brackets in Jackson
With 1,091 households falling in the category, the $50,000 to $74,999 income range is the most frequent in Jackson, accounting for 18.4% of all households. In contrast, only 213 households (3.6%) fall into the $10,000 to $14,999 income bracket, making it the least populous group.
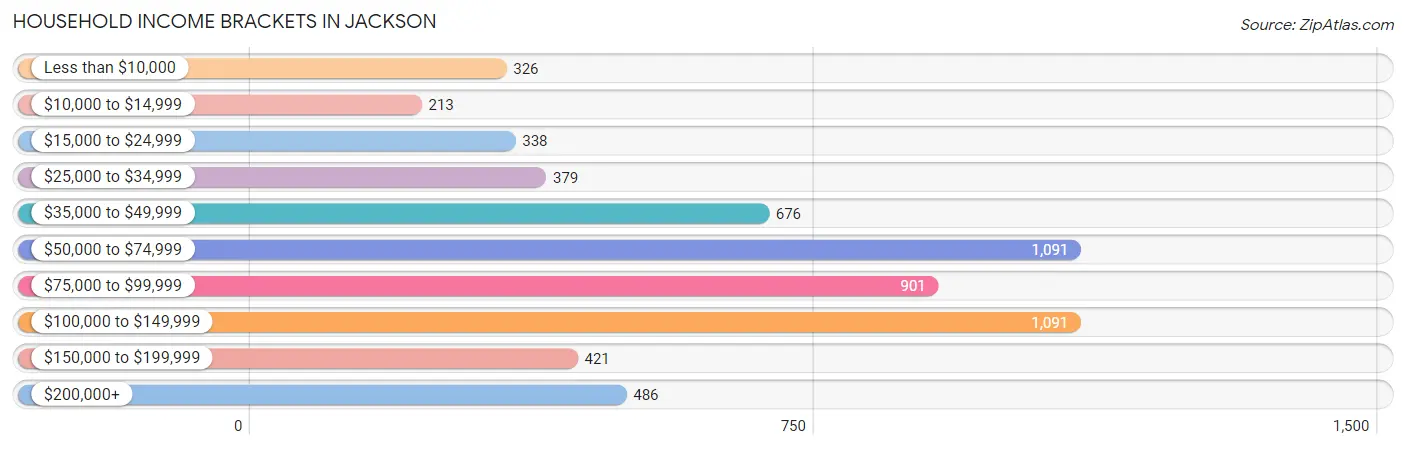
| Income Bracket | # Households | % Households |
| Less than $10,000 | 326 | 5.5% |
| $10,000 to $14,999 | 213 | 3.6% |
| $15,000 to $24,999 | 338 | 5.7% |
| $25,000 to $34,999 | 379 | 6.4% |
| $35,000 to $49,999 | 676 | 11.4% |
| $50,000 to $74,999 | 1,091 | 18.4% |
| $75,000 to $99,999 | 901 | 15.2% |
| $100,000 to $149,999 | 1,091 | 18.4% |
| $150,000 to $199,999 | 421 | 7.1% |
| $200,000+ | 486 | 8.2% |
Household Income by Householder Age in Jackson
The median household income in Jackson is $72,500, with the highest median household income of $95,313 found in the 45 to 64 years age bracket for the primary householder. A total of 1,726 households (29.1%) fall into this category. Meanwhile, the 15 to 24 years age bracket for the primary householder has the lowest median household income of $0, with 236 households (4.0%) in this group.
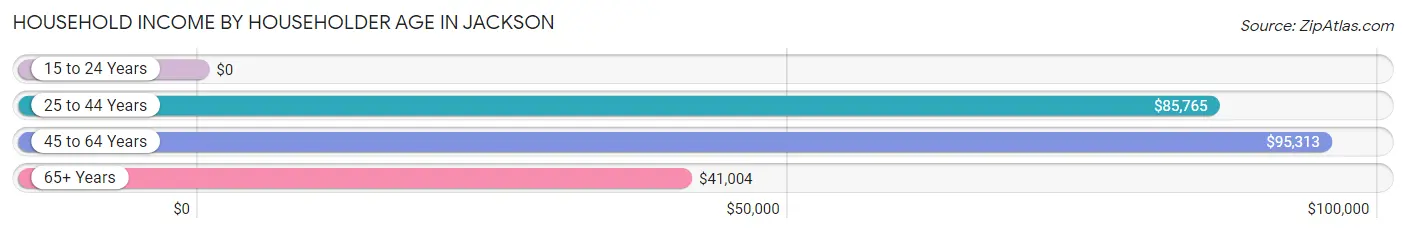
| Income Bracket | # Households | Median Income |
| 15 to 24 Years | 236 (4.0%) | $0 |
| 25 to 44 Years | 2,401 (40.5%) | $85,765 |
| 45 to 64 Years | 1,726 (29.1%) | $95,313 |
| 65+ Years | 1,565 (26.4%) | $41,004 |
| Total | 5,928 (100.0%) | $72,500 |
Poverty in Jackson
Income Below Poverty by Sex and Age in Jackson
With 4.1% poverty level for males and 12.5% for females among the residents of Jackson, 18 to 24 year old males and 15 year old females are the most vulnerable to poverty, with 70 males (15.5%) and 51 females (66.2%) in their respective age groups living below the poverty level.
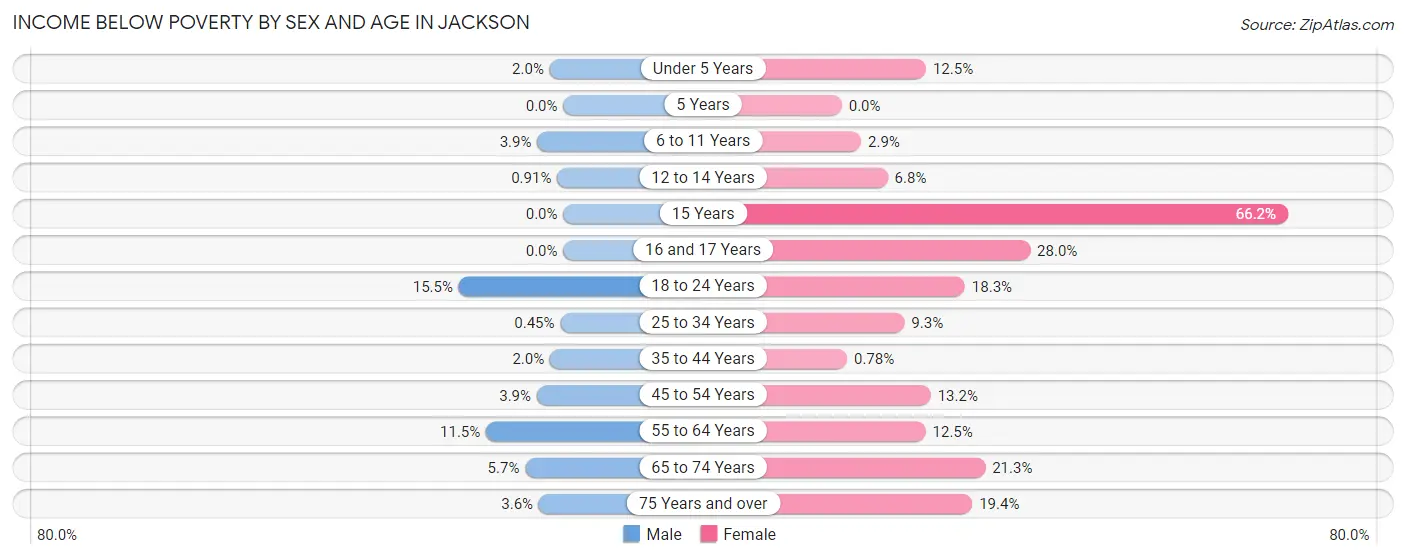
| Age Bracket | Male | Female |
| Under 5 Years | 11 (2.0%) | 64 (12.5%) |
| 5 Years | 0 (0.0%) | 0 (0.0%) |
| 6 to 11 Years | 27 (3.9%) | 17 (2.9%) |
| 12 to 14 Years | 4 (0.9%) | 26 (6.8%) |
| 15 Years | 0 (0.0%) | 51 (66.2%) |
| 16 and 17 Years | 0 (0.0%) | 66 (28.0%) |
| 18 to 24 Years | 70 (15.5%) | 132 (18.3%) |
| 25 to 34 Years | 5 (0.4%) | 108 (9.3%) |
| 35 to 44 Years | 22 (2.0%) | 8 (0.8%) |
| 45 to 54 Years | 28 (3.9%) | 118 (13.2%) |
| 55 to 64 Years | 88 (11.5%) | 89 (12.4%) |
| 65 to 74 Years | 29 (5.7%) | 170 (21.3%) |
| 75 Years and over | 15 (3.6%) | 110 (19.4%) |
| Total | 299 (4.1%) | 959 (12.5%) |
Income Above Poverty by Sex and Age in Jackson
According to the poverty statistics in Jackson, males aged 5 years and females aged 35 to 44 years are the age groups that are most secure financially, with 100.0% of males and 99.2% of females in these age groups living above the poverty line.
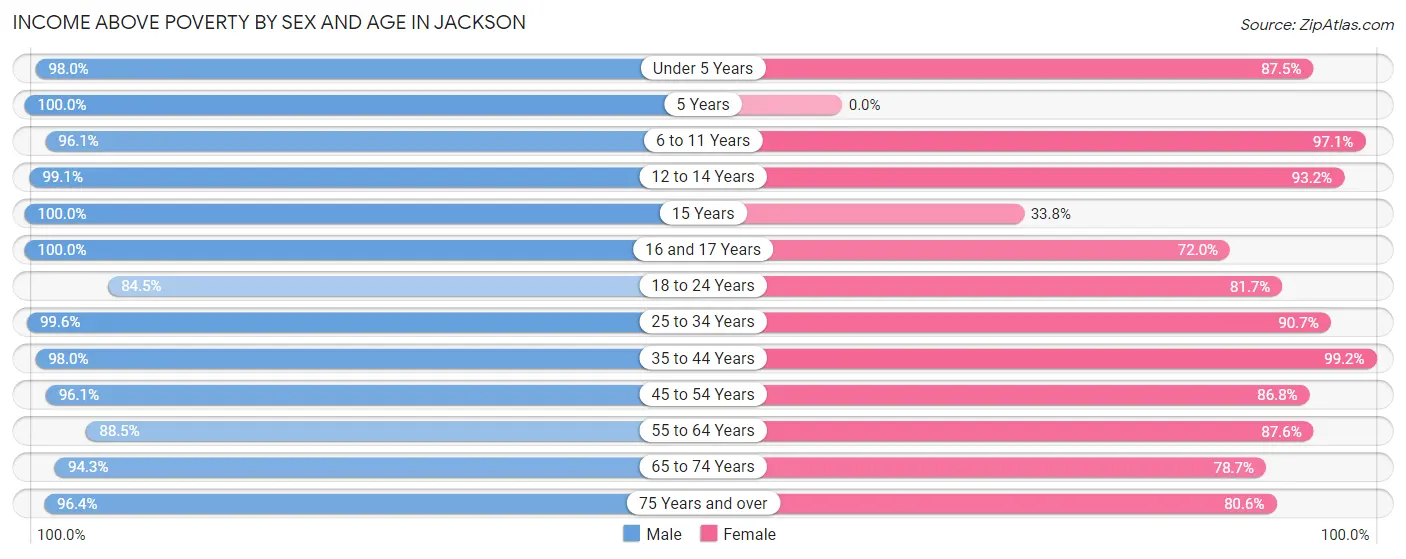
| Age Bracket | Male | Female |
| Under 5 Years | 533 (98.0%) | 448 (87.5%) |
| 5 Years | 104 (100.0%) | 0 (0.0%) |
| 6 to 11 Years | 670 (96.1%) | 576 (97.1%) |
| 12 to 14 Years | 436 (99.1%) | 356 (93.2%) |
| 15 Years | 197 (100.0%) | 26 (33.8%) |
| 16 and 17 Years | 259 (100.0%) | 170 (72.0%) |
| 18 to 24 Years | 381 (84.5%) | 590 (81.7%) |
| 25 to 34 Years | 1,101 (99.6%) | 1,053 (90.7%) |
| 35 to 44 Years | 1,097 (98.0%) | 1,016 (99.2%) |
| 45 to 54 Years | 684 (96.1%) | 775 (86.8%) |
| 55 to 64 Years | 679 (88.5%) | 626 (87.5%) |
| 65 to 74 Years | 483 (94.3%) | 628 (78.7%) |
| 75 Years and over | 398 (96.4%) | 458 (80.6%) |
| Total | 7,022 (95.9%) | 6,722 (87.5%) |
Income Below Poverty Among Married-Couple Families in Jackson
The poverty statistics for married-couple families in Jackson show that 1.3% or 43 of the total 3,387 families live below the poverty line. Families with 3 or 4 children have the highest poverty rate of 3.1%, comprising of 8 families. On the other hand, families with 5 or more children have the lowest poverty rate of 0.0%, which includes 0 families.
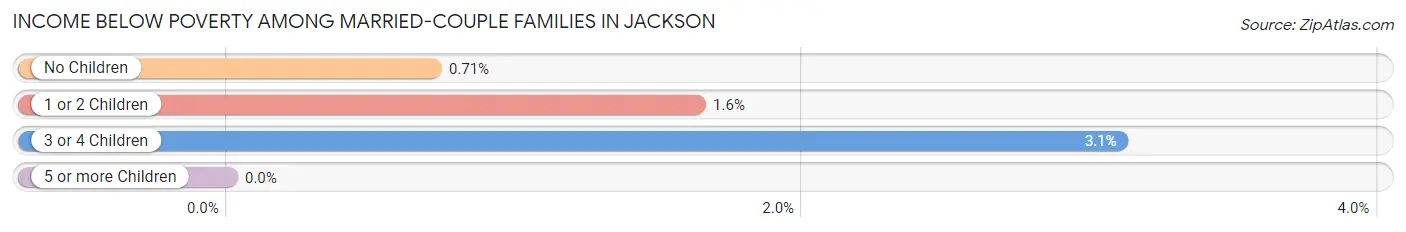
| Children | Above Poverty | Below Poverty |
| No Children | 1,680 (99.3%) | 12 (0.7%) |
| 1 or 2 Children | 1,389 (98.4%) | 23 (1.6%) |
| 3 or 4 Children | 250 (96.9%) | 8 (3.1%) |
| 5 or more Children | 25 (100.0%) | 0 (0.0%) |
| Total | 3,344 (98.7%) | 43 (1.3%) |
Income Below Poverty Among Single-Parent Households in Jackson
According to the poverty data in Jackson, 24.3% or 75 single-father households and 26.9% or 152 single-mother households are living below the poverty line. Among single-father households, those with 1 or 2 children have the highest poverty rate, with 66 households (68.8%) experiencing poverty. Likewise, among single-mother households, those with 3 or 4 children have the highest poverty rate, with 5 households (100.0%) falling below the poverty line.
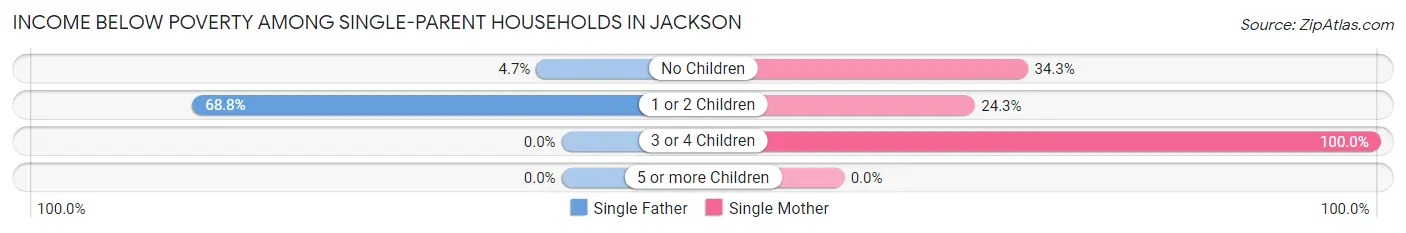
| Children | Single Father | Single Mother |
| No Children | 9 (4.7%) | 37 (34.3%) |
| 1 or 2 Children | 66 (68.8%) | 110 (24.3%) |
| 3 or 4 Children | 0 (0.0%) | 5 (100.0%) |
| 5 or more Children | 0 (0.0%) | 0 (0.0%) |
| Total | 75 (24.3%) | 152 (26.9%) |
Income Below Poverty Among Married-Couple vs Single-Parent Households in Jackson
The poverty data for Jackson shows that 43 of the married-couple family households (1.3%) and 227 of the single-parent households (26.0%) are living below the poverty level. Within the married-couple family households, those with 3 or 4 children have the highest poverty rate, with 8 households (3.1%) falling below the poverty line. Among the single-parent households, those with 1 or 2 children have the highest poverty rate, with 176 household (32.1%) living below poverty.
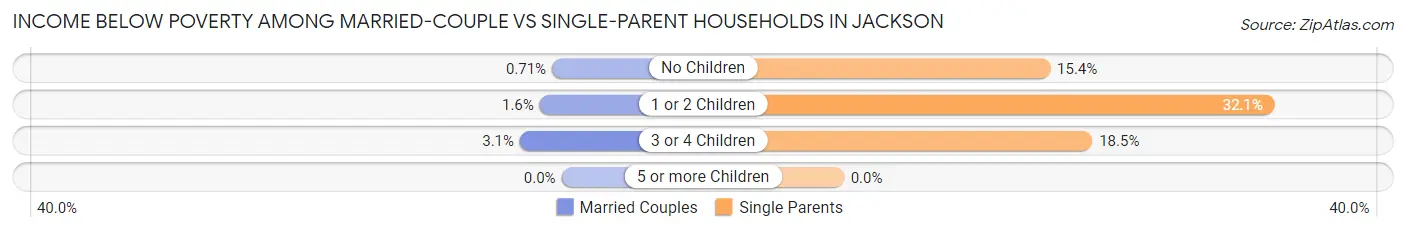
| Children | Married-Couple Families | Single-Parent Households |
| No Children | 12 (0.7%) | 46 (15.4%) |
| 1 or 2 Children | 23 (1.6%) | 176 (32.1%) |
| 3 or 4 Children | 8 (3.1%) | 5 (18.5%) |
| 5 or more Children | 0 (0.0%) | 0 (0.0%) |
| Total | 43 (1.3%) | 227 (26.0%) |
Race in Jackson
The most populous races in Jackson are White / Caucasian (14,102 | 91.6%), Two or more Races (769 | 5.0%), and Hispanic or Latino (410 | 2.7%).
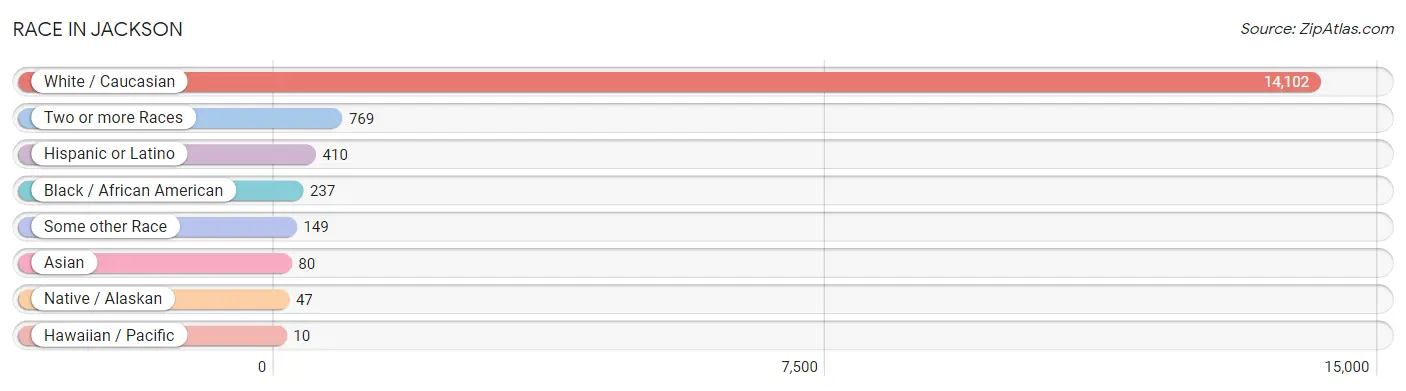
| Race | # Population | % Population |
| Asian | 80 | 0.5% |
| Black / African American | 237 | 1.5% |
| Hawaiian / Pacific | 10 | 0.1% |
| Hispanic or Latino | 410 | 2.7% |
| Native / Alaskan | 47 | 0.3% |
| White / Caucasian | 14,102 | 91.6% |
| Two or more Races | 769 | 5.0% |
| Some other Race | 149 | 1.0% |
| Total | 15,394 | 100.0% |
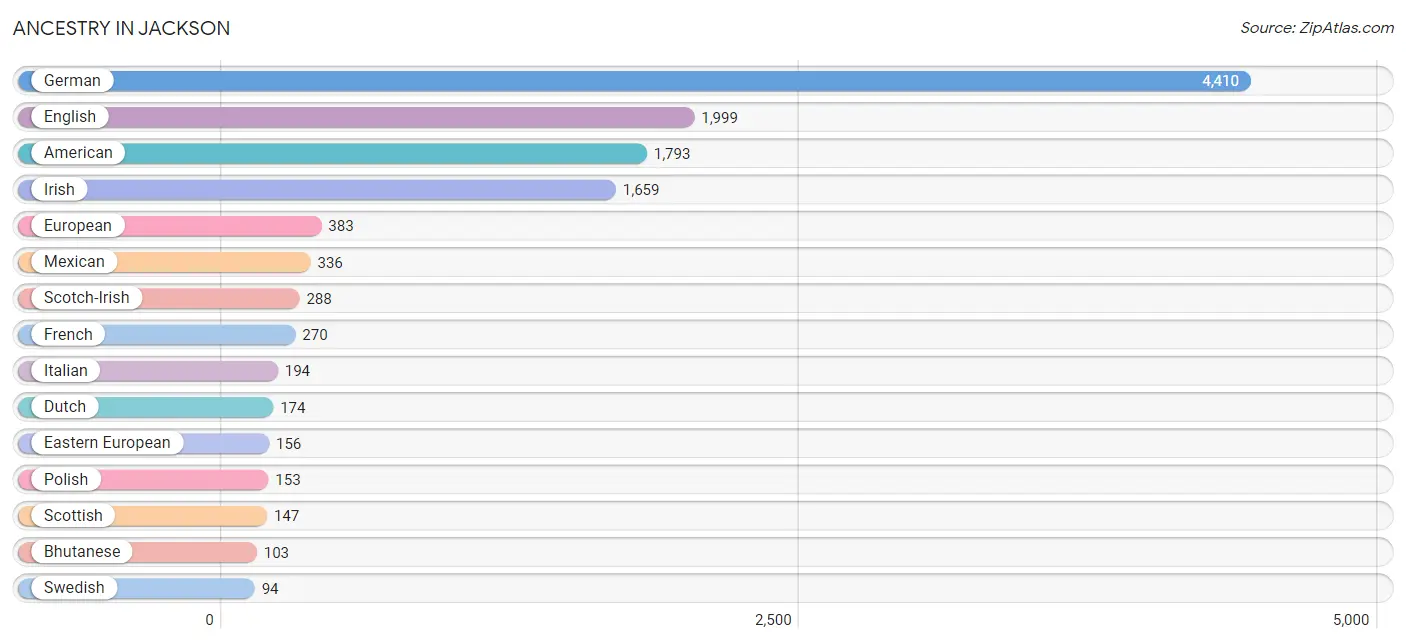
Ancestry in Jackson
The most populous ancestries reported in Jackson are German (4,410 | 28.6%), English (1,999 | 13.0%), American (1,793 | 11.7%), Irish (1,659 | 10.8%), and European (383 | 2.5%), together accounting for 66.6% of all Jackson residents.
| Ancestry | # Population | % Population |
| African | 64 | 0.4% |
| American | 1,793 | 11.7% |
| Apache | 14 | 0.1% |
| Bhutanese | 103 | 0.7% |
| Blackfeet | 5 | 0.0% |
| British | 40 | 0.3% |
| Cherokee | 26 | 0.2% |
| Colombian | 20 | 0.1% |
| Cuban | 31 | 0.2% |
| Czech | 57 | 0.4% |
| Dutch | 174 | 1.1% |
| Eastern European | 156 | 1.0% |
| Ecuadorian | 18 | 0.1% |
| English | 1,999 | 13.0% |
| European | 383 | 2.5% |
| French | 270 | 1.8% |
| French Canadian | 21 | 0.1% |
| German | 4,410 | 28.6% |
| Greek | 31 | 0.2% |
| Guamanian / Chamorro | 10 | 0.1% |
| Hungarian | 6 | 0.0% |
| Indian (Asian) | 40 | 0.3% |
| Irish | 1,659 | 10.8% |
| Italian | 194 | 1.3% |
| Korean | 72 | 0.5% |
| Lithuanian | 17 | 0.1% |
| Mexican | 336 | 2.2% |
| Northern European | 16 | 0.1% |
| Norwegian | 39 | 0.3% |
| Osage | 47 | 0.3% |
| Pakistani | 8 | 0.1% |
| Peruvian | 5 | 0.0% |
| Polish | 153 | 1.0% |
| Scandinavian | 31 | 0.2% |
| Scotch-Irish | 288 | 1.9% |
| Scottish | 147 | 0.9% |
| Serbian | 15 | 0.1% |
| South American | 43 | 0.3% |
| Sri Lankan | 20 | 0.1% |
| Subsaharan African | 64 | 0.4% |
| Swedish | 94 | 0.6% |
| Thai | 19 | 0.1% |
| Welsh | 35 | 0.2% | View All 43 Rows |
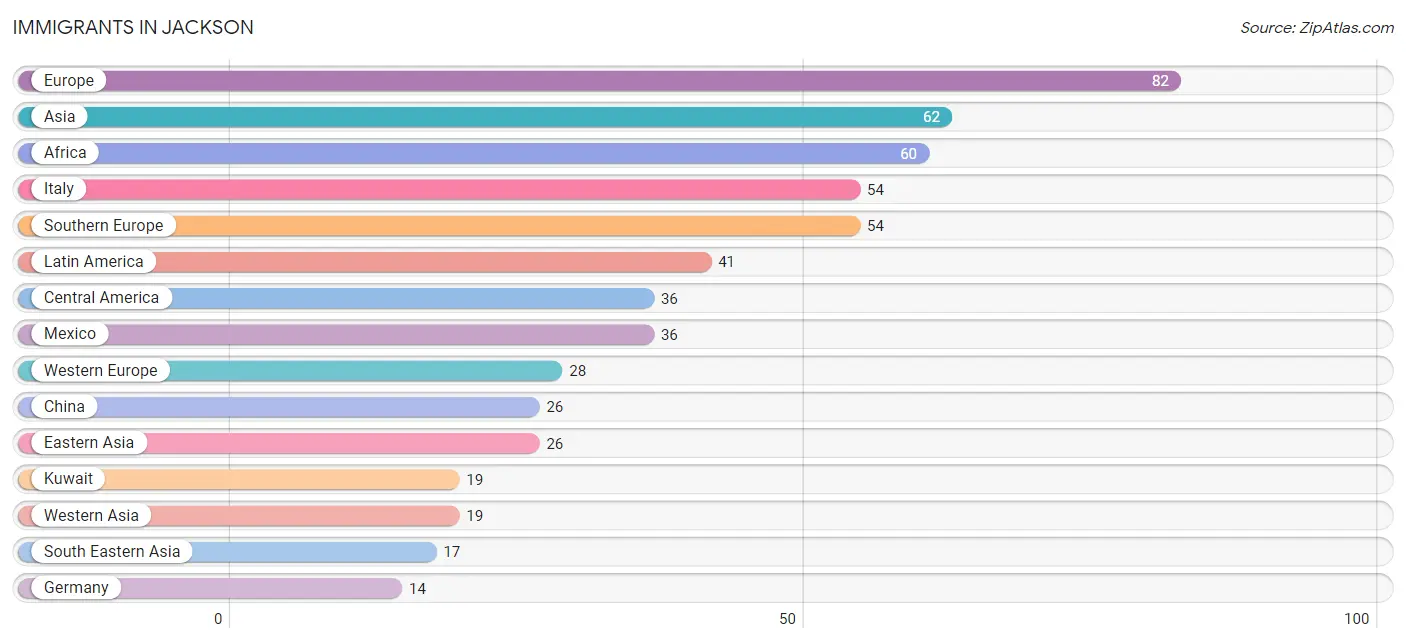
Immigrants in Jackson
The most numerous immigrant groups reported in Jackson came from Europe (82 | 0.5%), Asia (62 | 0.4%), Africa (60 | 0.4%), Italy (54 | 0.4%), and Southern Europe (54 | 0.4%), together accounting for 2.0% of all Jackson residents.
| Immigration Origin | # Population | % Population |
| Africa | 60 | 0.4% |
| Asia | 62 | 0.4% |
| Central America | 36 | 0.2% |
| China | 26 | 0.2% |
| Eastern Asia | 26 | 0.2% |
| Europe | 82 | 0.5% |
| Germany | 14 | 0.1% |
| Italy | 54 | 0.4% |
| Kuwait | 19 | 0.1% |
| Latin America | 41 | 0.3% |
| Mexico | 36 | 0.2% |
| Netherlands | 14 | 0.1% |
| Peru | 5 | 0.0% |
| Philippines | 9 | 0.1% |
| South America | 5 | 0.0% |
| South Eastern Asia | 17 | 0.1% |
| Southern Europe | 54 | 0.4% |
| Thailand | 8 | 0.1% |
| Western Asia | 19 | 0.1% |
| Western Europe | 28 | 0.2% | View All 20 Rows |
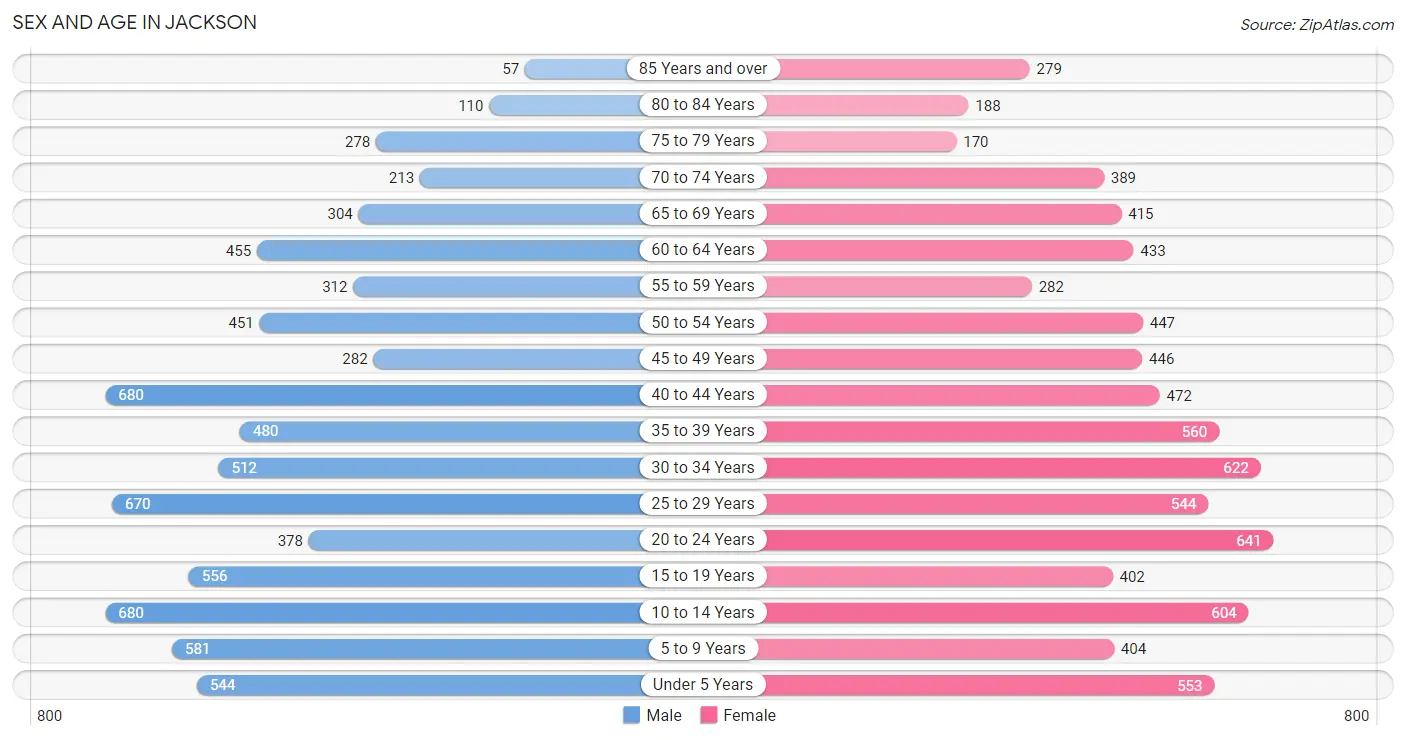
Sex and Age in Jackson
Sex and Age in Jackson
The most populous age groups in Jackson are 10 to 14 Years (680 | 9.0%) for men and 20 to 24 Years (641 | 8.2%) for women.
| Age Bracket | Male | Female |
| Under 5 Years | 544 (7.2%) | 553 (7.0%) |
| 5 to 9 Years | 581 (7.7%) | 404 (5.1%) |
| 10 to 14 Years | 680 (9.0%) | 604 (7.7%) |
| 15 to 19 Years | 556 (7.4%) | 402 (5.1%) |
| 20 to 24 Years | 378 (5.0%) | 641 (8.2%) |
| 25 to 29 Years | 670 (8.9%) | 544 (6.9%) |
| 30 to 34 Years | 512 (6.8%) | 622 (7.9%) |
| 35 to 39 Years | 480 (6.4%) | 560 (7.1%) |
| 40 to 44 Years | 680 (9.0%) | 472 (6.0%) |
| 45 to 49 Years | 282 (3.7%) | 446 (5.7%) |
| 50 to 54 Years | 451 (6.0%) | 447 (5.7%) |
| 55 to 59 Years | 312 (4.1%) | 282 (3.6%) |
| 60 to 64 Years | 455 (6.0%) | 433 (5.5%) |
| 65 to 69 Years | 304 (4.0%) | 415 (5.3%) |
| 70 to 74 Years | 213 (2.8%) | 389 (5.0%) |
| 75 to 79 Years | 278 (3.7%) | 170 (2.2%) |
| 80 to 84 Years | 110 (1.5%) | 188 (2.4%) |
| 85 Years and over | 57 (0.8%) | 279 (3.5%) |
| Total | 7,543 (100.0%) | 7,851 (100.0%) |
Families and Households in Jackson
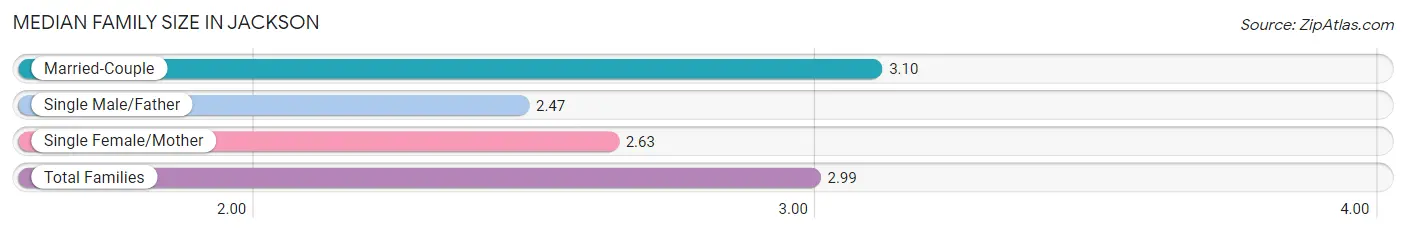
Median Family Size in Jackson
The median family size in Jackson is 2.99 persons per family, with married-couple families (3,387 | 79.5%) accounting for the largest median family size of 3.1 persons per family. On the other hand, single male/father families (309 | 7.2%) represent the smallest median family size with 2.47 persons per family.
| Family Type | # Families | Family Size |
| Married-Couple | 3,387 (79.5%) | 3.10 |
| Single Male/Father | 309 (7.2%) | 2.47 |
| Single Female/Mother | 565 (13.3%) | 2.63 |
| Total Families | 4,261 (100.0%) | 2.99 |
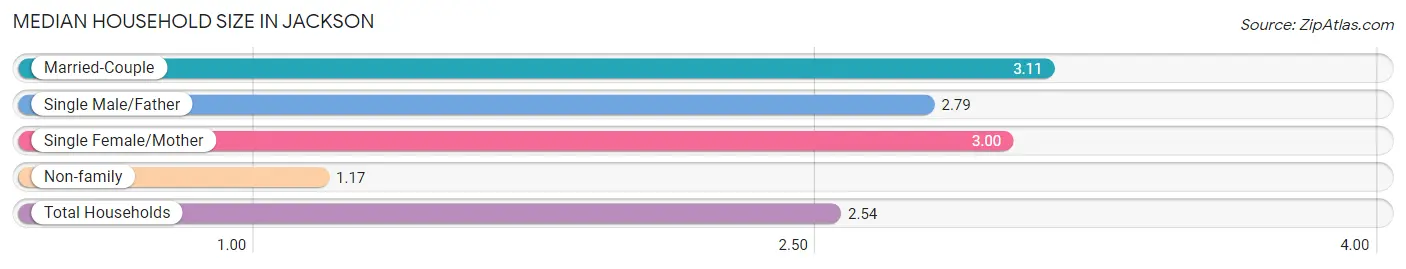
Median Household Size in Jackson
The median household size in Jackson is 2.54 persons per household, with married-couple households (3,387 | 57.1%) accounting for the largest median household size of 3.11 persons per household. non-family households (1,667 | 28.1%) represent the smallest median household size with 1.17 persons per household.
| Household Type | # Households | Household Size |
| Married-Couple | 3,387 (57.1%) | 3.11 |
| Single Male/Father | 309 (5.2%) | 2.79 |
| Single Female/Mother | 565 (9.5%) | 3.00 |
| Non-family | 1,667 (28.1%) | 1.17 |
| Total Households | 5,928 (100.0%) | 2.54 |
Household Size by Marriage Status in Jackson
Out of a total of 5,928 households in Jackson, 4,261 (71.9%) are family households, while 1,667 (28.1%) are nonfamily households. The most numerous type of family households are 2-person households, comprising 1,877, and the most common type of nonfamily households are 1-person households, comprising 1,414.
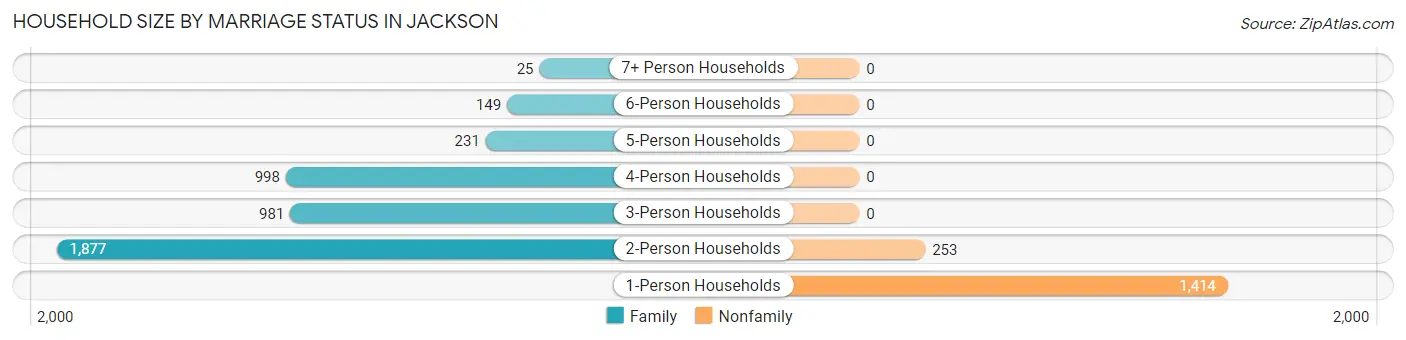
| Household Size | Family Households | Nonfamily Households |
| 1-Person Households | - | 1,414 (23.8%) |
| 2-Person Households | 1,877 (31.7%) | 253 (4.3%) |
| 3-Person Households | 981 (16.6%) | 0 (0.0%) |
| 4-Person Households | 998 (16.8%) | 0 (0.0%) |
| 5-Person Households | 231 (3.9%) | 0 (0.0%) |
| 6-Person Households | 149 (2.5%) | 0 (0.0%) |
| 7+ Person Households | 25 (0.4%) | 0 (0.0%) |
| Total | 4,261 (71.9%) | 1,667 (28.1%) |
Female Fertility in Jackson
Fertility by Age in Jackson
Average fertility rate in Jackson is 90.0 births per 1,000 women. Women in the age bracket of 20 to 34 years have the highest fertility rate with 164.0 births per 1,000 women. Women in the age bracket of 20 to 34 years acount for 88.1% of all women with births.
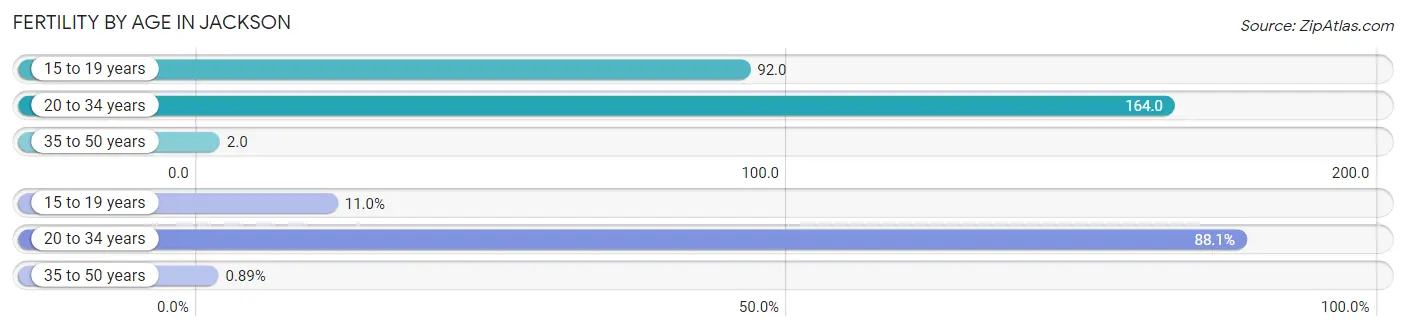
| Age Bracket | Women with Births | Births / 1,000 Women |
| 15 to 19 years | 37 (11.0%) | 92.0 |
| 20 to 34 years | 296 (88.1%) | 164.0 |
| 35 to 50 years | 3 (0.9%) | 2.0 |
| Total | 336 (100.0%) | 90.0 |
Fertility by Age by Marriage Status in Jackson
86.9% of women with births (336) in Jackson are married. The highest percentage of unmarried women with births falls into 15 to 19 years age bracket with 100.0% of them unmarried at the time of birth, while the lowest percentage of unmarried women with births belong to 35 to 50 years age bracket with 0.0% of them unmarried.
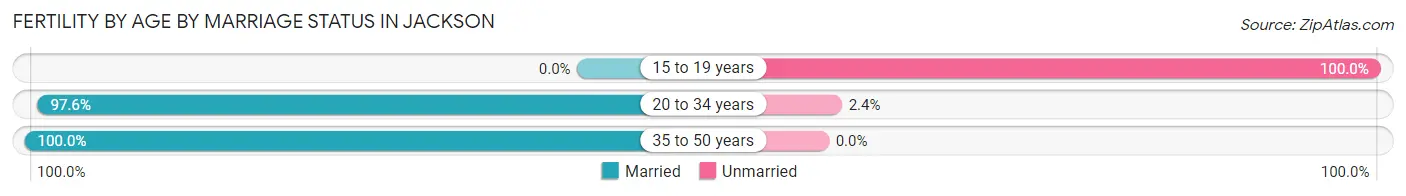
| Age Bracket | Married | Unmarried |
| 15 to 19 years | 0 (0.0%) | 37 (100.0%) |
| 20 to 34 years | 289 (97.6%) | 7 (2.4%) |
| 35 to 50 years | 3 (100.0%) | 0 (0.0%) |
| Total | 292 (86.9%) | 44 (13.1%) |
Fertility by Education in Jackson
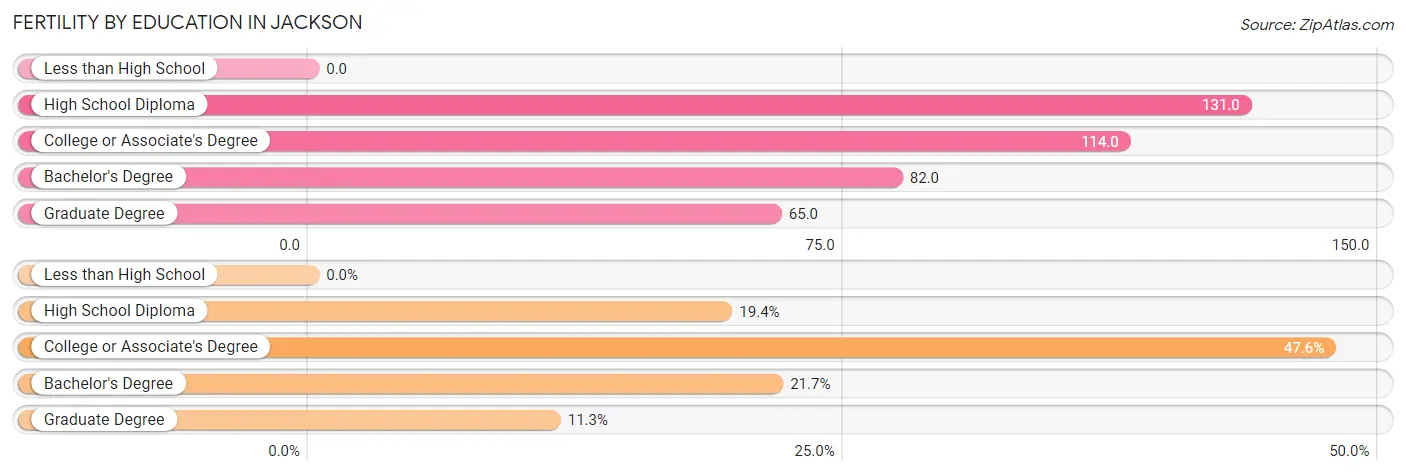
| Educational Attainment | Women with Births | Births / 1,000 Women |
| Less than High School | 0 (0.0%) | 0.0 |
| High School Diploma | 65 (19.4%) | 131.0 |
| College or Associate's Degree | 160 (47.6%) | 114.0 |
| Bachelor's Degree | 73 (21.7%) | 82.0 |
| Graduate Degree | 38 (11.3%) | 65.0 |
| Total | 336 (100.0%) | 90.0 |
Fertility by Education by Marriage Status in Jackson
13.1% of women with births in Jackson are unmarried. Women with the educational attainment of college or associate's degree are most likely to be married with 100.0% of them married at childbirth, while women with the educational attainment of high school diploma are least likely to be married with 67.7% of them unmarried at childbirth.
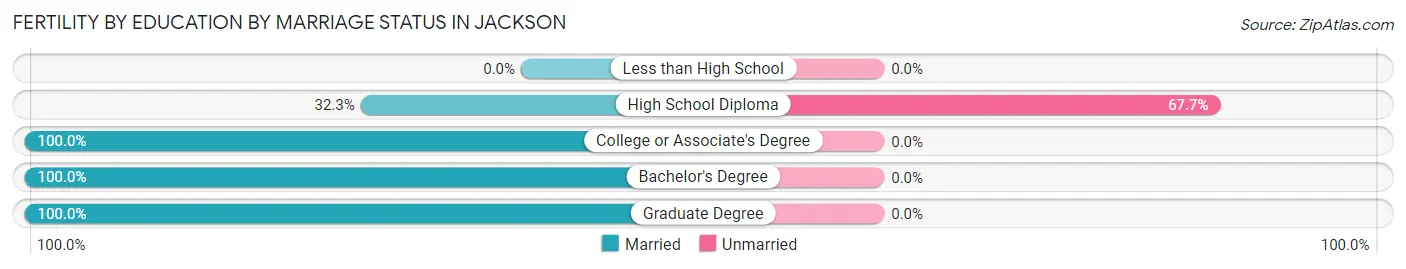
| Educational Attainment | Married | Unmarried |
| Less than High School | 0 (0.0%) | 0 (0.0%) |
| High School Diploma | 21 (32.3%) | 44 (67.7%) |
| College or Associate's Degree | 160 (100.0%) | 0 (0.0%) |
| Bachelor's Degree | 73 (100.0%) | 0 (0.0%) |
| Graduate Degree | 38 (100.0%) | 0 (0.0%) |
| Total | 292 (86.9%) | 44 (13.1%) |
Employment Characteristics in Jackson
Employment by Class of Employer in Jackson
Among the 7,441 employed individuals in Jackson, private company employees (4,684 | 62.9%), not-for-profit organizations (991 | 13.3%), and local government employees (576 | 7.7%) make up the most common classes of employment.
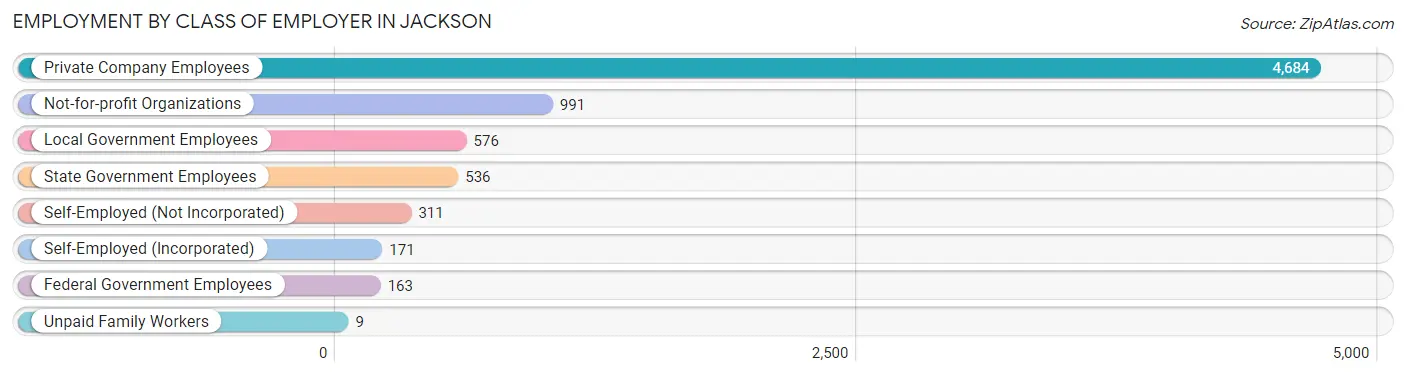
| Employer Class | # Employees | % Employees |
| Private Company Employees | 4,684 | 62.9% |
| Self-Employed (Incorporated) | 171 | 2.3% |
| Self-Employed (Not Incorporated) | 311 | 4.2% |
| Not-for-profit Organizations | 991 | 13.3% |
| Local Government Employees | 576 | 7.7% |
| State Government Employees | 536 | 7.2% |
| Federal Government Employees | 163 | 2.2% |
| Unpaid Family Workers | 9 | 0.1% |
| Total | 7,441 | 100.0% |
Employment Status by Age in Jackson
According to the labor force statistics for Jackson, out of the total population over 16 years of age (11,754), 66.4% or 7,805 individuals are in the labor force, with 3.8% or 297 of them unemployed. The age group with the highest labor force participation rate is 35 to 44 years, with 93.0% or 2,039 individuals in the labor force. Within the labor force, the 16 to 19 years age range has the highest percentage of unemployed individuals, with 11.8% or 36 of them being unemployed.
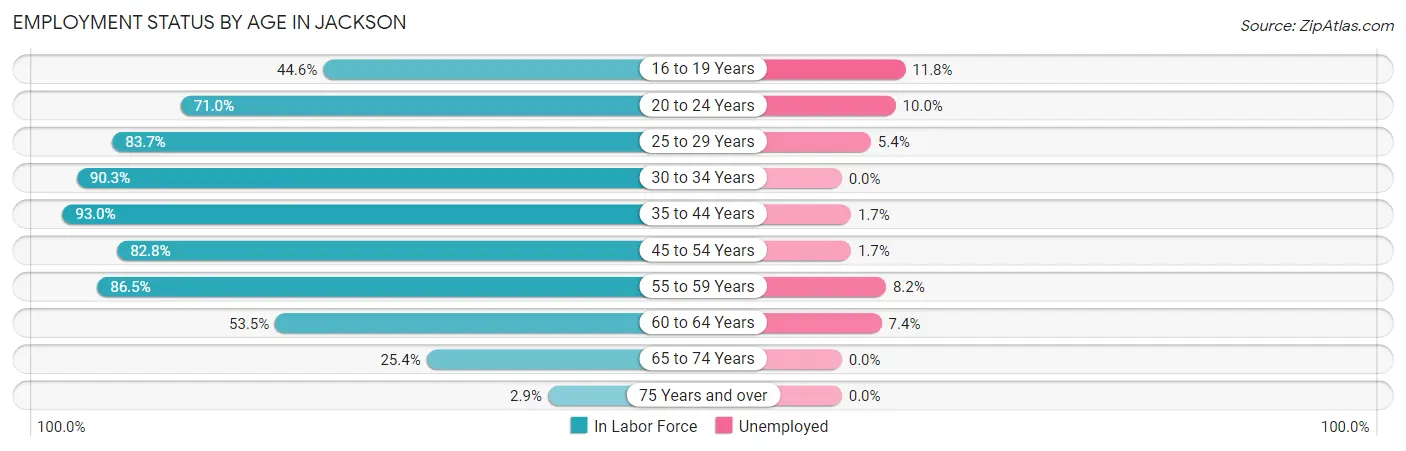
| Age Bracket | In Labor Force | Unemployed |
| 16 to 19 Years | 305 (44.6%) | 36 (11.8%) |
| 20 to 24 Years | 723 (71.0%) | 72 (10.0%) |
| 25 to 29 Years | 1,016 (83.7%) | 55 (5.4%) |
| 30 to 34 Years | 1,024 (90.3%) | 0 (0.0%) |
| 35 to 44 Years | 2,039 (93.0%) | 35 (1.7%) |
| 45 to 54 Years | 1,346 (82.8%) | 23 (1.7%) |
| 55 to 59 Years | 514 (86.5%) | 42 (8.2%) |
| 60 to 64 Years | 475 (53.5%) | 35 (7.4%) |
| 65 to 74 Years | 336 (25.4%) | 0 (0.0%) |
| 75 Years and over | 31 (2.9%) | 0 (0.0%) |
| Total | 7,805 (66.4%) | 297 (3.8%) |
Employment Status by Educational Attainment in Jackson
According to labor force statistics for Jackson, 83.9% of individuals (6,417) out of the total population between 25 and 64 years of age (7,648) are in the labor force, with 2.9% or 186 of them being unemployed. The group with the highest labor force participation rate are those with the educational attainment of bachelor's degree or higher, with 93.0% or 2,871 individuals in the labor force. Within the labor force, individuals with high school diploma education have the highest percentage of unemployment, with 6.4% or 95 of them being unemployed.
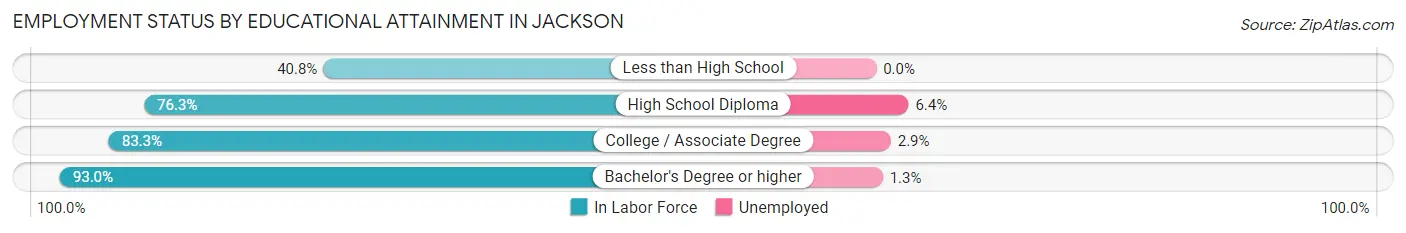
| Educational Attainment | In Labor Force | Unemployed |
| Less than High School | 115 (40.8%) | 0 (0.0%) |
| High School Diploma | 1,483 (76.3%) | 124 (6.4%) |
| College / Associate Degree | 1,946 (83.3%) | 68 (2.9%) |
| Bachelor's Degree or higher | 2,871 (93.0%) | 40 (1.3%) |
| Total | 6,417 (83.9%) | 222 (2.9%) |
Employment Occupations by Sex in Jackson
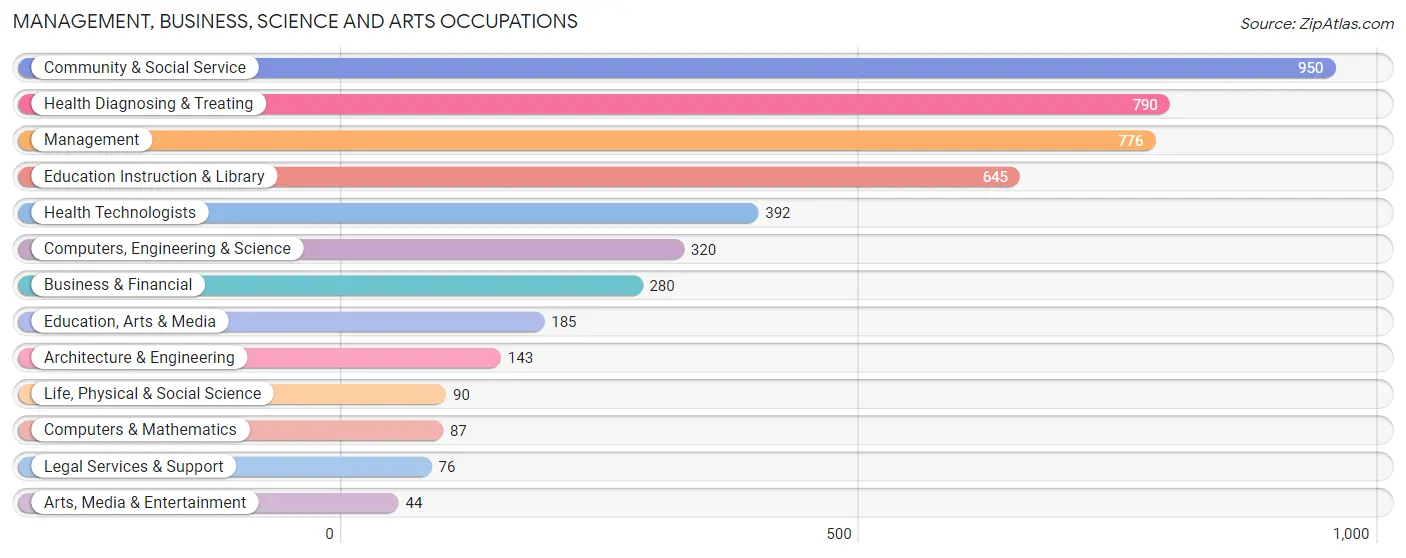
Management, Business, Science and Arts Occupations
The most common Management, Business, Science and Arts occupations in Jackson are Community & Social Service (950 | 12.7%), Health Diagnosing & Treating (790 | 10.5%), Management (776 | 10.4%), Education Instruction & Library (645 | 8.6%), and Health Technologists (392 | 5.2%).
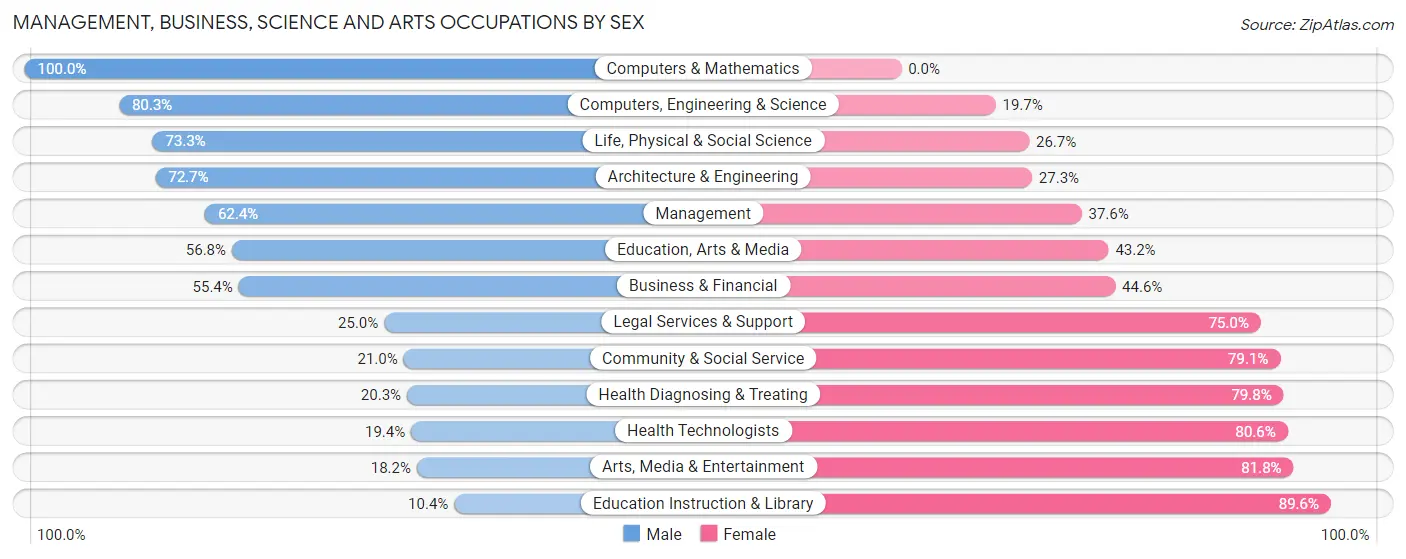
Management, Business, Science and Arts Occupations by Sex
Within the Management, Business, Science and Arts occupations in Jackson, the most male-oriented occupations are Computers & Mathematics (100.0%), Computers, Engineering & Science (80.3%), and Life, Physical & Social Science (73.3%), while the most female-oriented occupations are Education Instruction & Library (89.6%), Arts, Media & Entertainment (81.8%), and Health Technologists (80.6%).
| Occupation | Male | Female |
| Management | 484 (62.4%) | 292 (37.6%) |
| Business & Financial | 155 (55.4%) | 125 (44.6%) |
| Computers, Engineering & Science | 257 (80.3%) | 63 (19.7%) |
| Computers & Mathematics | 87 (100.0%) | 0 (0.0%) |
| Architecture & Engineering | 104 (72.7%) | 39 (27.3%) |
| Life, Physical & Social Science | 66 (73.3%) | 24 (26.7%) |
| Community & Social Service | 199 (20.9%) | 751 (79.0%) |
| Education, Arts & Media | 105 (56.8%) | 80 (43.2%) |
| Legal Services & Support | 19 (25.0%) | 57 (75.0%) |
| Education Instruction & Library | 67 (10.4%) | 578 (89.6%) |
| Arts, Media & Entertainment | 8 (18.2%) | 36 (81.8%) |
| Health Diagnosing & Treating | 160 (20.3%) | 630 (79.7%) |
| Health Technologists | 76 (19.4%) | 316 (80.6%) |
| Total (Category) | 1,255 (40.3%) | 1,861 (59.7%) |
| Total (Overall) | 3,781 (50.5%) | 3,706 (49.5%) |
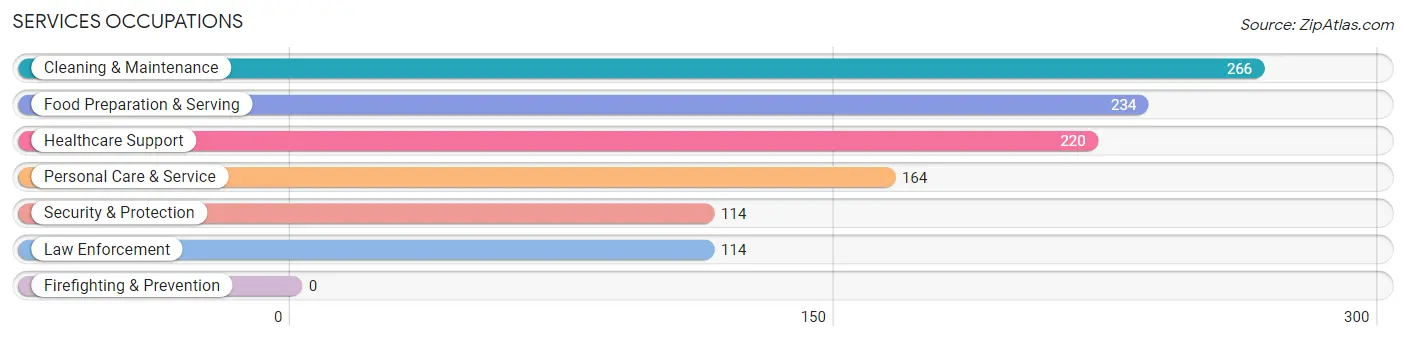
Services Occupations
The most common Services occupations in Jackson are Cleaning & Maintenance (266 | 3.5%), Food Preparation & Serving (234 | 3.1%), Healthcare Support (220 | 2.9%), Personal Care & Service (164 | 2.2%), and Security & Protection (114 | 1.5%).
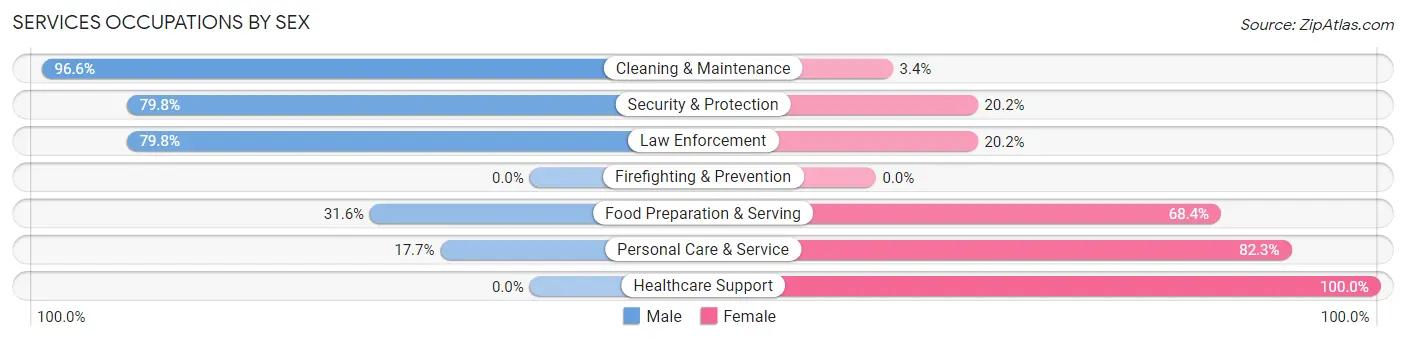
Services Occupations by Sex
Within the Services occupations in Jackson, the most male-oriented occupations are Cleaning & Maintenance (96.6%), Security & Protection (79.8%), and Law Enforcement (79.8%), while the most female-oriented occupations are Healthcare Support (100.0%), Personal Care & Service (82.3%), and Food Preparation & Serving (68.4%).
| Occupation | Male | Female |
| Healthcare Support | 0 (0.0%) | 220 (100.0%) |
| Security & Protection | 91 (79.8%) | 23 (20.2%) |
| Firefighting & Prevention | 0 (0.0%) | 0 (0.0%) |
| Law Enforcement | 91 (79.8%) | 23 (20.2%) |
| Food Preparation & Serving | 74 (31.6%) | 160 (68.4%) |
| Cleaning & Maintenance | 257 (96.6%) | 9 (3.4%) |
| Personal Care & Service | 29 (17.7%) | 135 (82.3%) |
| Total (Category) | 451 (45.2%) | 547 (54.8%) |
| Total (Overall) | 3,781 (50.5%) | 3,706 (49.5%) |
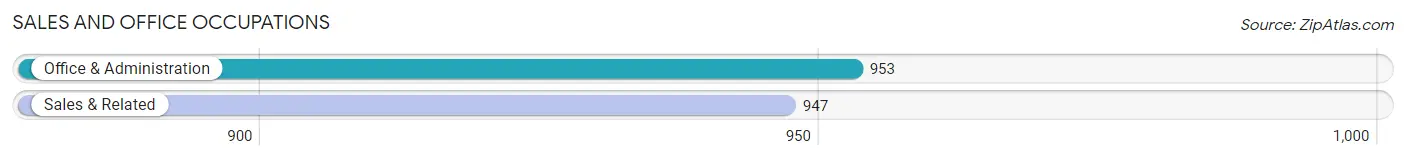
Sales and Office Occupations
The most common Sales and Office occupations in Jackson are Office & Administration (953 | 12.7%), and Sales & Related (947 | 12.7%).
Sales and Office Occupations by Sex
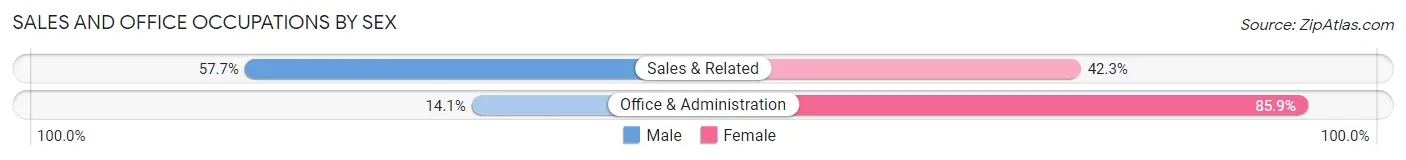
| Occupation | Male | Female |
| Sales & Related | 546 (57.7%) | 401 (42.3%) |
| Office & Administration | 134 (14.1%) | 819 (85.9%) |
| Total (Category) | 680 (35.8%) | 1,220 (64.2%) |
| Total (Overall) | 3,781 (50.5%) | 3,706 (49.5%) |
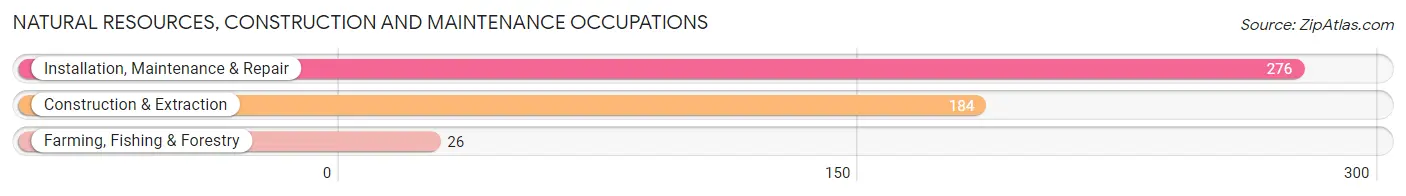
Natural Resources, Construction and Maintenance Occupations
The most common Natural Resources, Construction and Maintenance occupations in Jackson are Installation, Maintenance & Repair (276 | 3.7%), Construction & Extraction (184 | 2.5%), and Farming, Fishing & Forestry (26 | 0.4%).
Natural Resources, Construction and Maintenance Occupations by Sex
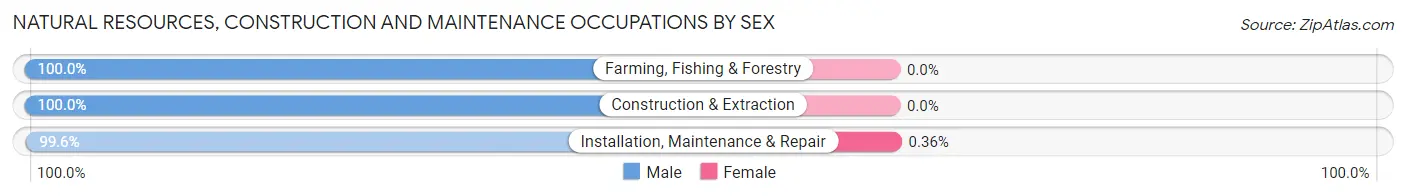
| Occupation | Male | Female |
| Farming, Fishing & Forestry | 26 (100.0%) | 0 (0.0%) |
| Construction & Extraction | 184 (100.0%) | 0 (0.0%) |
| Installation, Maintenance & Repair | 275 (99.6%) | 1 (0.4%) |
| Total (Category) | 485 (99.8%) | 1 (0.2%) |
| Total (Overall) | 3,781 (50.5%) | 3,706 (49.5%) |
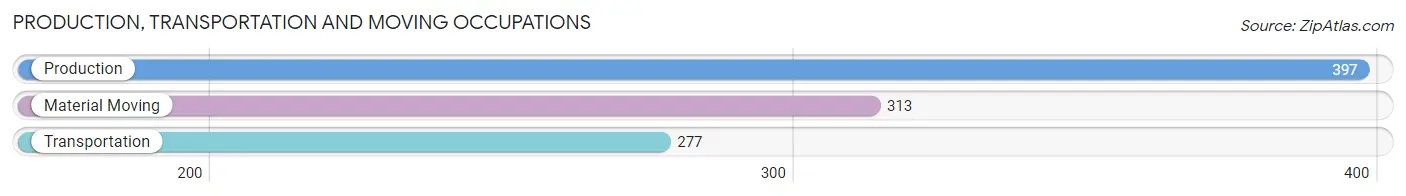
Production, Transportation and Moving Occupations
The most common Production, Transportation and Moving occupations in Jackson are Production (397 | 5.3%), Material Moving (313 | 4.2%), and Transportation (277 | 3.7%).
Production, Transportation and Moving Occupations by Sex
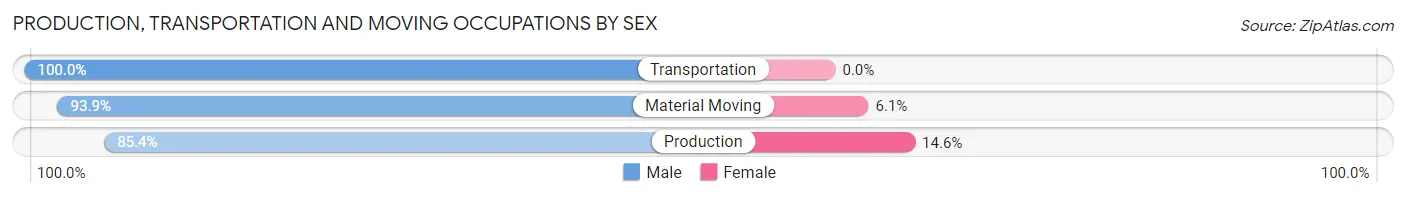
| Occupation | Male | Female |
| Production | 339 (85.4%) | 58 (14.6%) |
| Transportation | 277 (100.0%) | 0 (0.0%) |
| Material Moving | 294 (93.9%) | 19 (6.1%) |
| Total (Category) | 910 (92.2%) | 77 (7.8%) |
| Total (Overall) | 3,781 (50.5%) | 3,706 (49.5%) |
Employment Industries by Sex in Jackson
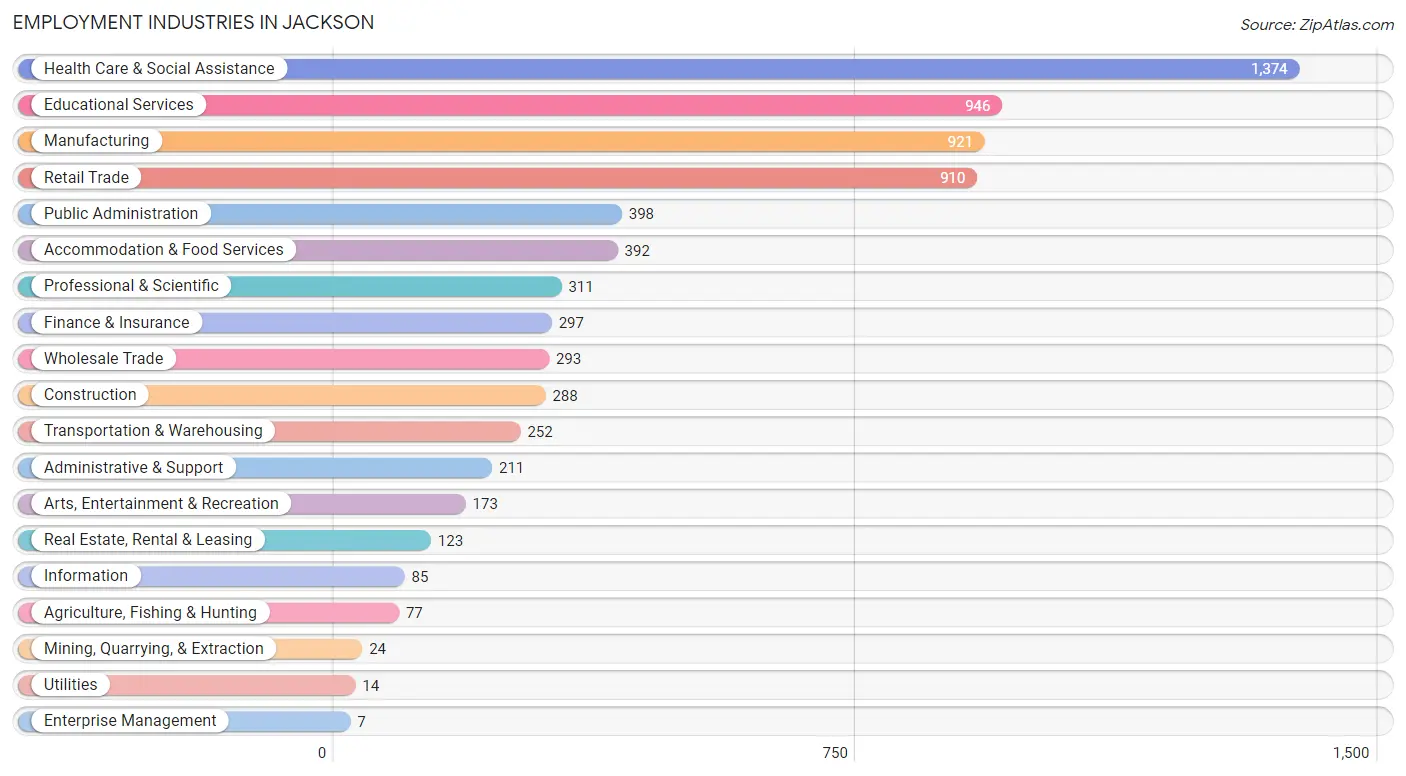
Employment Industries in Jackson
The major employment industries in Jackson include Health Care & Social Assistance (1,374 | 18.3%), Educational Services (946 | 12.6%), Manufacturing (921 | 12.3%), Retail Trade (910 | 12.1%), and Public Administration (398 | 5.3%).
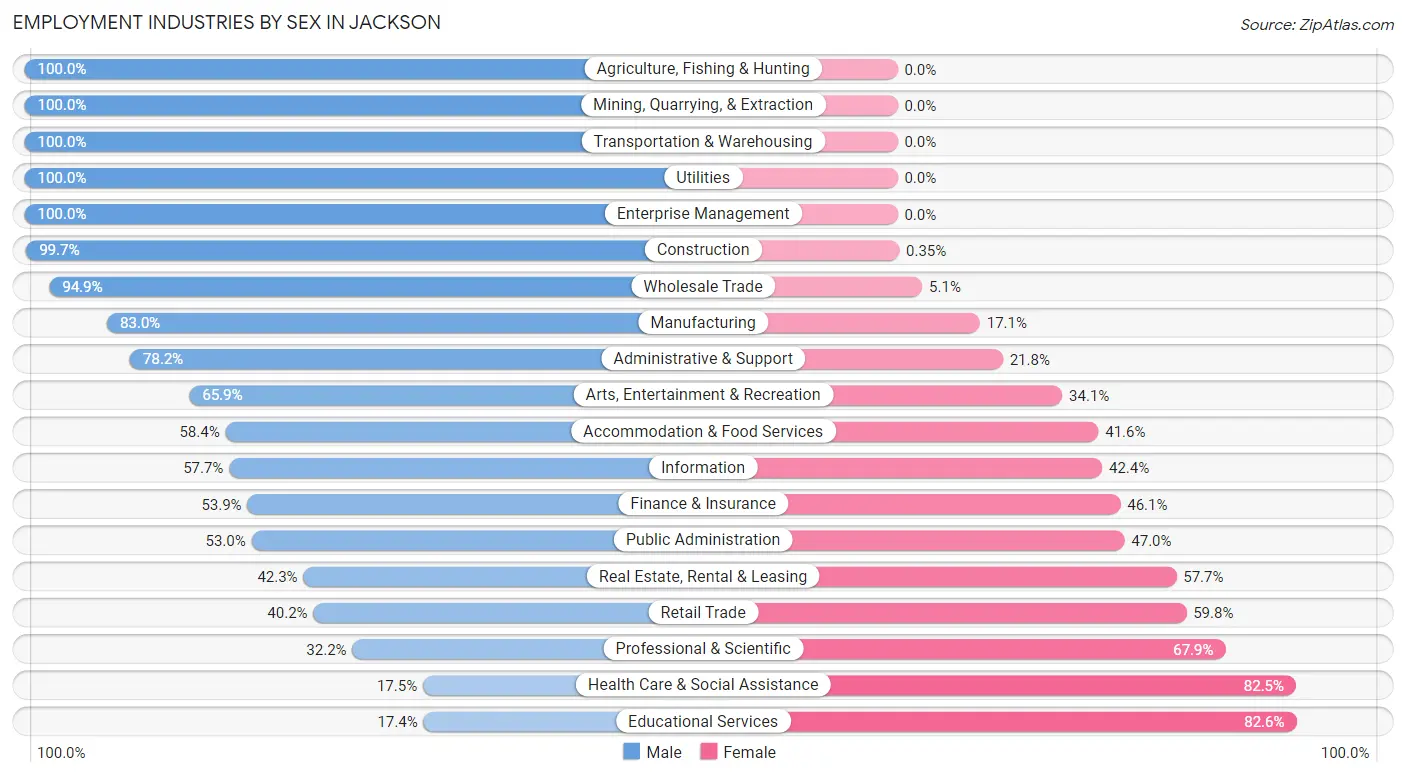
Employment Industries by Sex in Jackson
The Jackson industries that see more men than women are Agriculture, Fishing & Hunting (100.0%), Mining, Quarrying, & Extraction (100.0%), and Transportation & Warehousing (100.0%), whereas the industries that tend to have a higher number of women are Educational Services (82.6%), Health Care & Social Assistance (82.5%), and Professional & Scientific (67.8%).
| Industry | Male | Female |
| Agriculture, Fishing & Hunting | 77 (100.0%) | 0 (0.0%) |
| Mining, Quarrying, & Extraction | 24 (100.0%) | 0 (0.0%) |
| Construction | 287 (99.7%) | 1 (0.4%) |
| Manufacturing | 764 (83.0%) | 157 (17.1%) |
| Wholesale Trade | 278 (94.9%) | 15 (5.1%) |
| Retail Trade | 366 (40.2%) | 544 (59.8%) |
| Transportation & Warehousing | 252 (100.0%) | 0 (0.0%) |
| Utilities | 14 (100.0%) | 0 (0.0%) |
| Information | 49 (57.7%) | 36 (42.3%) |
| Finance & Insurance | 160 (53.9%) | 137 (46.1%) |
| Real Estate, Rental & Leasing | 52 (42.3%) | 71 (57.7%) |
| Professional & Scientific | 100 (32.2%) | 211 (67.8%) |
| Enterprise Management | 7 (100.0%) | 0 (0.0%) |
| Administrative & Support | 165 (78.2%) | 46 (21.8%) |
| Educational Services | 165 (17.4%) | 781 (82.6%) |
| Health Care & Social Assistance | 241 (17.5%) | 1,133 (82.5%) |
| Arts, Entertainment & Recreation | 114 (65.9%) | 59 (34.1%) |
| Accommodation & Food Services | 229 (58.4%) | 163 (41.6%) |
| Public Administration | 211 (53.0%) | 187 (47.0%) |
| Total | 3,781 (50.5%) | 3,706 (49.5%) |
Education in Jackson
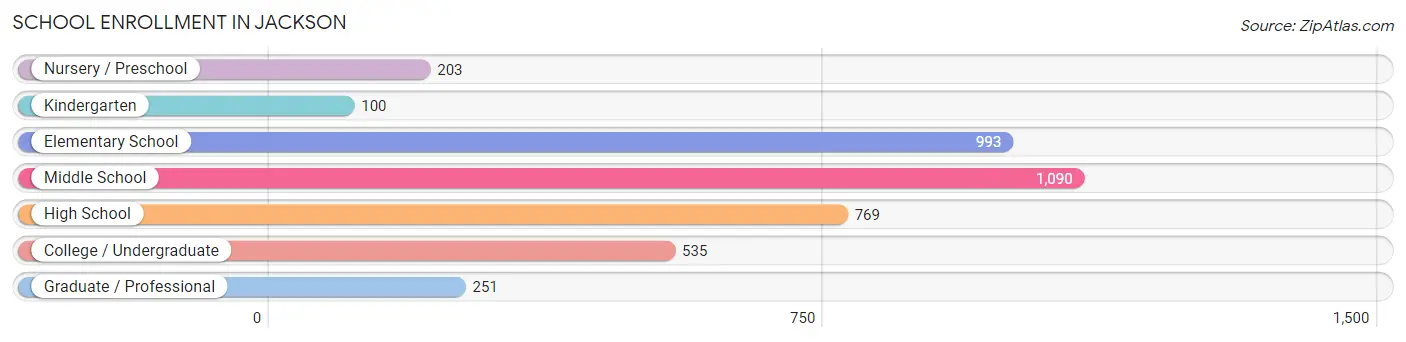
School Enrollment in Jackson
The most common levels of schooling among the 3,941 students in Jackson are middle school (1,090 | 27.7%), elementary school (993 | 25.2%), and high school (769 | 19.5%).
| School Level | # Students | % Students |
| Nursery / Preschool | 203 | 5.1% |
| Kindergarten | 100 | 2.5% |
| Elementary School | 993 | 25.2% |
| Middle School | 1,090 | 27.7% |
| High School | 769 | 19.5% |
| College / Undergraduate | 535 | 13.6% |
| Graduate / Professional | 251 | 6.4% |
| Total | 3,941 | 100.0% |
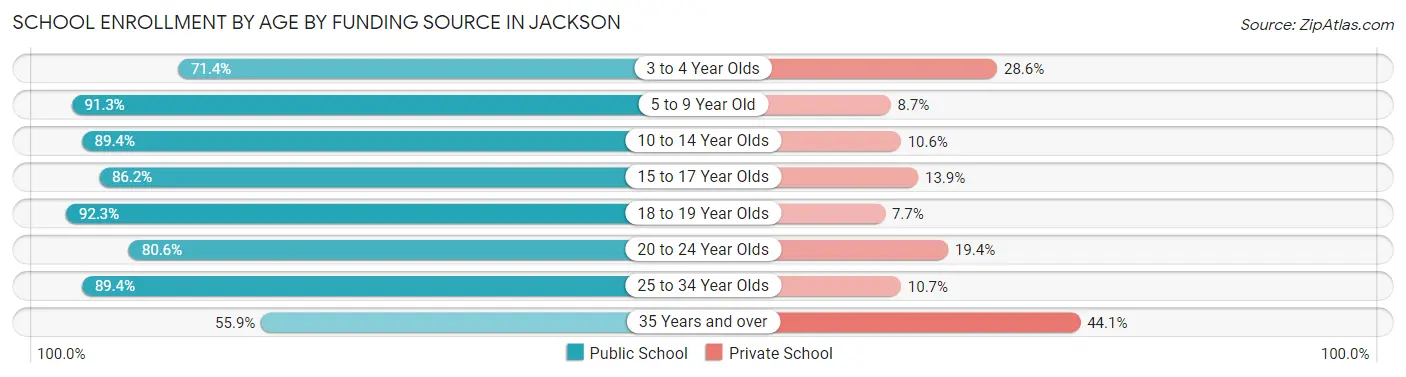
School Enrollment by Age by Funding Source in Jackson
Out of a total of 3,941 students who are enrolled in schools in Jackson, 536 (13.6%) attend a private institution, while the remaining 3,405 (86.4%) are enrolled in public schools. The age group of 35 years and over has the highest likelihood of being enrolled in private schools, with 63 (44.1% in the age bracket) enrolled. Conversely, the age group of 18 to 19 year olds has the lowest likelihood of being enrolled in a private school, with 84 (92.3% in the age bracket) attending a public institution.
| Age Bracket | Public School | Private School |
| 3 to 4 Year Olds | 110 (71.4%) | 44 (28.6%) |
| 5 to 9 Year Old | 899 (91.3%) | 86 (8.7%) |
| 10 to 14 Year Olds | 1,094 (89.4%) | 130 (10.6%) |
| 15 to 17 Year Olds | 622 (86.2%) | 100 (13.9%) |
| 18 to 19 Year Olds | 84 (92.3%) | 7 (7.7%) |
| 20 to 24 Year Olds | 365 (80.6%) | 88 (19.4%) |
| 25 to 34 Year Olds | 151 (89.3%) | 18 (10.6%) |
| 35 Years and over | 80 (55.9%) | 63 (44.1%) |
| Total | 3,405 (86.4%) | 536 (13.6%) |
Educational Attainment by Field of Study in Jackson
Education (1,191 | 29.8%), science & technology (694 | 17.3%), business (503 | 12.6%), arts & humanities (393 | 9.8%), and bio, nature & agricultural (261 | 6.5%) are the most common fields of study among 4,002 individuals in Jackson who have obtained a bachelor's degree or higher.
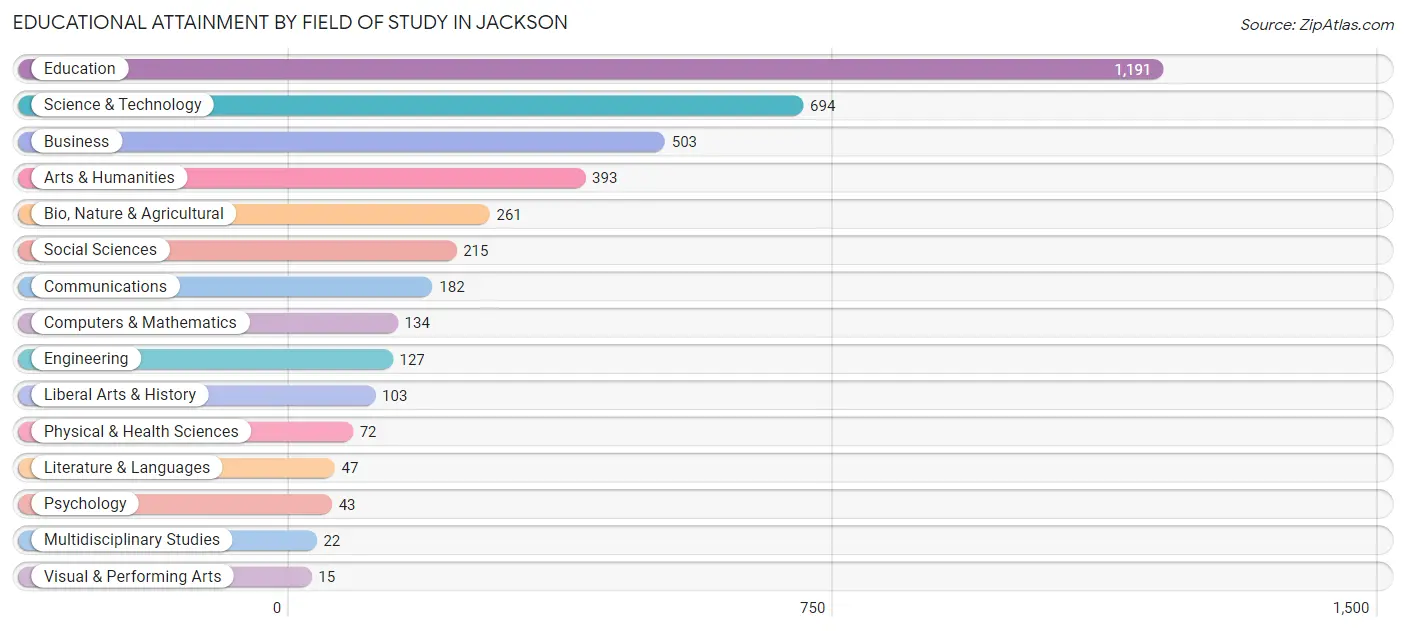
| Field of Study | # Graduates | % Graduates |
| Computers & Mathematics | 134 | 3.4% |
| Bio, Nature & Agricultural | 261 | 6.5% |
| Physical & Health Sciences | 72 | 1.8% |
| Psychology | 43 | 1.1% |
| Social Sciences | 215 | 5.4% |
| Engineering | 127 | 3.2% |
| Multidisciplinary Studies | 22 | 0.5% |
| Science & Technology | 694 | 17.3% |
| Business | 503 | 12.6% |
| Education | 1,191 | 29.8% |
| Literature & Languages | 47 | 1.2% |
| Liberal Arts & History | 103 | 2.6% |
| Visual & Performing Arts | 15 | 0.4% |
| Communications | 182 | 4.5% |
| Arts & Humanities | 393 | 9.8% |
| Total | 4,002 | 100.0% |
Transportation & Commute in Jackson
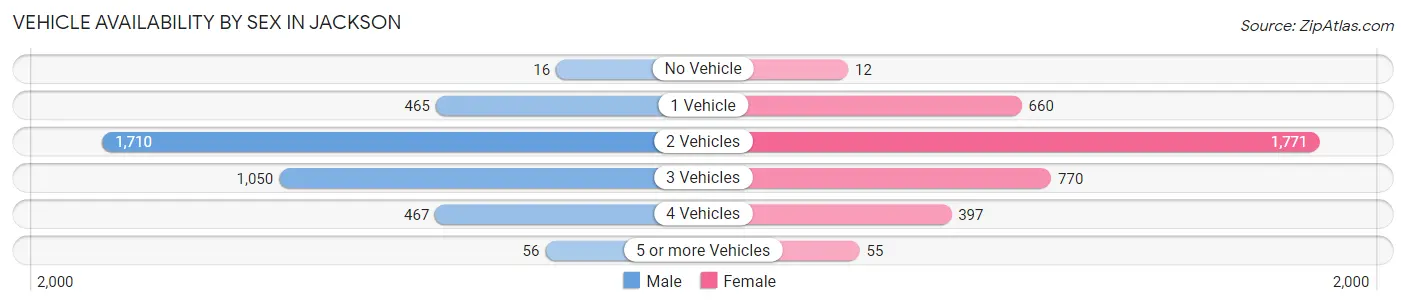
Vehicle Availability by Sex in Jackson
The most prevalent vehicle ownership categories in Jackson are males with 2 vehicles (1,710, accounting for 45.4%) and females with 2 vehicles (1,771, making up 46.7%).
| Vehicles Available | Male | Female |
| No Vehicle | 16 (0.4%) | 12 (0.3%) |
| 1 Vehicle | 465 (12.3%) | 660 (18.0%) |
| 2 Vehicles | 1,710 (45.4%) | 1,771 (48.3%) |
| 3 Vehicles | 1,050 (27.9%) | 770 (21.0%) |
| 4 Vehicles | 467 (12.4%) | 397 (10.8%) |
| 5 or more Vehicles | 56 (1.5%) | 55 (1.5%) |
| Total | 3,764 (100.0%) | 3,665 (100.0%) |
Commute Time in Jackson
The most frequently occuring commute durations in Jackson are 15 to 19 minutes (1,569 commuters, 23.0%), 20 to 24 minutes (1,512 commuters, 22.2%), and 10 to 14 minutes (1,109 commuters, 16.3%).
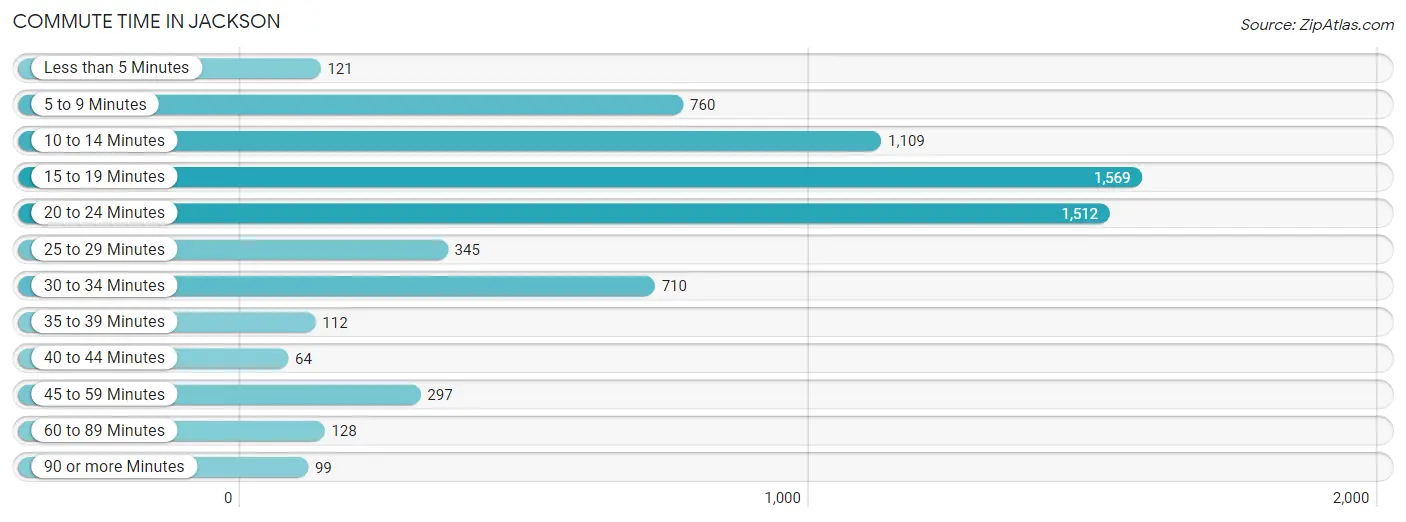
| Commute Time | # Commuters | % Commuters |
| Less than 5 Minutes | 121 | 1.8% |
| 5 to 9 Minutes | 760 | 11.1% |
| 10 to 14 Minutes | 1,109 | 16.3% |
| 15 to 19 Minutes | 1,569 | 23.0% |
| 20 to 24 Minutes | 1,512 | 22.2% |
| 25 to 29 Minutes | 345 | 5.1% |
| 30 to 34 Minutes | 710 | 10.4% |
| 35 to 39 Minutes | 112 | 1.6% |
| 40 to 44 Minutes | 64 | 0.9% |
| 45 to 59 Minutes | 297 | 4.3% |
| 60 to 89 Minutes | 128 | 1.9% |
| 90 or more Minutes | 99 | 1.5% |
Commute Time by Sex in Jackson
The most common commute times in Jackson are 20 to 24 minutes (796 commuters, 23.3%) for males and 15 to 19 minutes (883 commuters, 25.9%) for females.
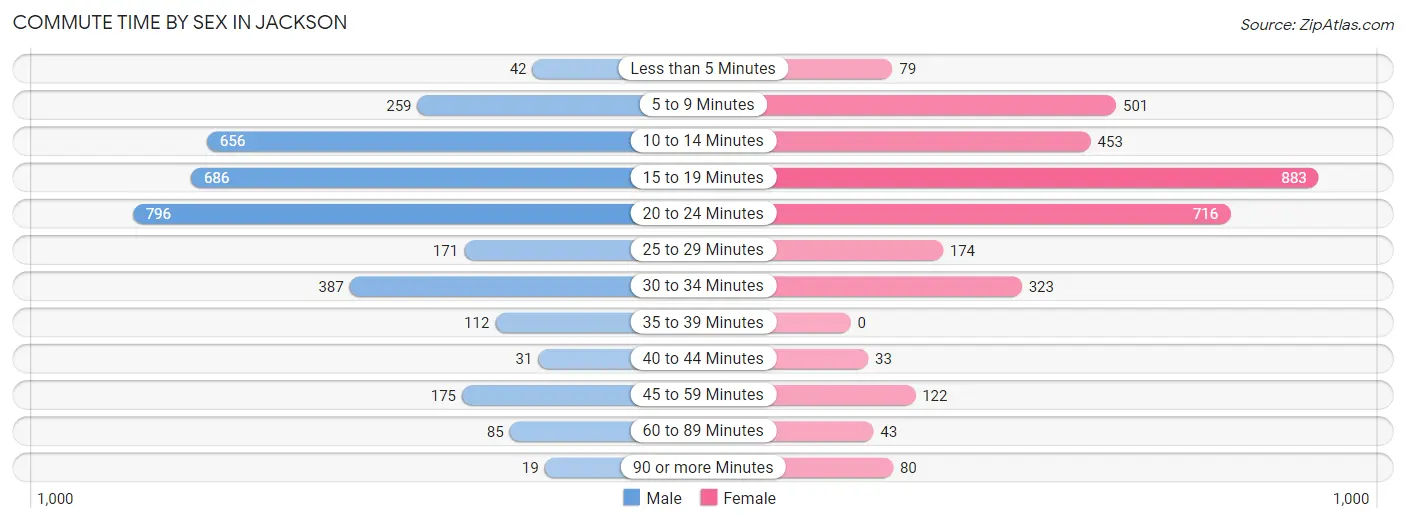
| Commute Time | Male | Female |
| Less than 5 Minutes | 42 (1.2%) | 79 (2.3%) |
| 5 to 9 Minutes | 259 (7.6%) | 501 (14.7%) |
| 10 to 14 Minutes | 656 (19.2%) | 453 (13.3%) |
| 15 to 19 Minutes | 686 (20.1%) | 883 (25.9%) |
| 20 to 24 Minutes | 796 (23.3%) | 716 (21.0%) |
| 25 to 29 Minutes | 171 (5.0%) | 174 (5.1%) |
| 30 to 34 Minutes | 387 (11.3%) | 323 (9.5%) |
| 35 to 39 Minutes | 112 (3.3%) | 0 (0.0%) |
| 40 to 44 Minutes | 31 (0.9%) | 33 (1.0%) |
| 45 to 59 Minutes | 175 (5.1%) | 122 (3.6%) |
| 60 to 89 Minutes | 85 (2.5%) | 43 (1.3%) |
| 90 or more Minutes | 19 (0.6%) | 80 (2.4%) |
Time of Departure to Work by Sex in Jackson
The most frequent times of departure to work in Jackson are 7:00 AM to 7:29 AM (671, 19.6%) for males and 7:00 AM to 7:29 AM (1,075, 31.6%) for females.
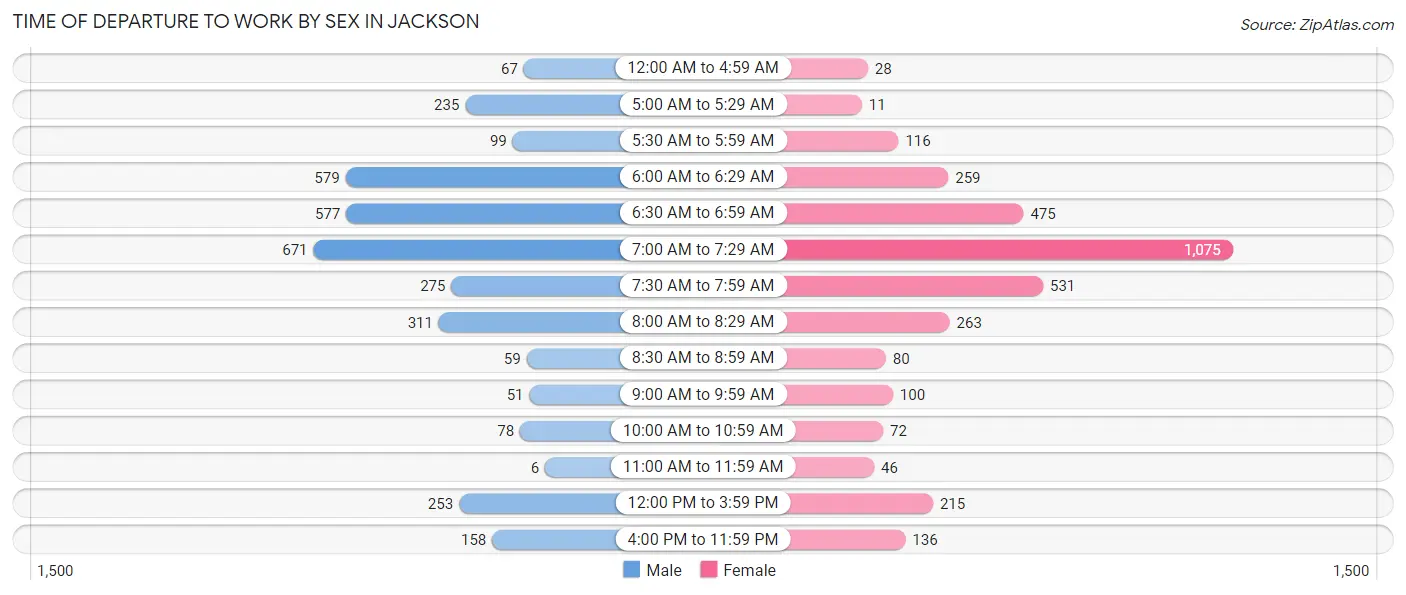
| Time of Departure | Male | Female |
| 12:00 AM to 4:59 AM | 67 (2.0%) | 28 (0.8%) |
| 5:00 AM to 5:29 AM | 235 (6.9%) | 11 (0.3%) |
| 5:30 AM to 5:59 AM | 99 (2.9%) | 116 (3.4%) |
| 6:00 AM to 6:29 AM | 579 (16.9%) | 259 (7.6%) |
| 6:30 AM to 6:59 AM | 577 (16.9%) | 475 (13.9%) |
| 7:00 AM to 7:29 AM | 671 (19.6%) | 1,075 (31.6%) |
| 7:30 AM to 7:59 AM | 275 (8.0%) | 531 (15.6%) |
| 8:00 AM to 8:29 AM | 311 (9.1%) | 263 (7.7%) |
| 8:30 AM to 8:59 AM | 59 (1.7%) | 80 (2.4%) |
| 9:00 AM to 9:59 AM | 51 (1.5%) | 100 (2.9%) |
| 10:00 AM to 10:59 AM | 78 (2.3%) | 72 (2.1%) |
| 11:00 AM to 11:59 AM | 6 (0.2%) | 46 (1.3%) |
| 12:00 PM to 3:59 PM | 253 (7.4%) | 215 (6.3%) |
| 4:00 PM to 11:59 PM | 158 (4.6%) | 136 (4.0%) |
| Total | 3,419 (100.0%) | 3,407 (100.0%) |
Housing Occupancy in Jackson
Occupancy by Ownership in Jackson
Of the total 5,928 dwellings in Jackson, owner-occupied units account for 4,164 (70.2%), while renter-occupied units make up 1,764 (29.8%).
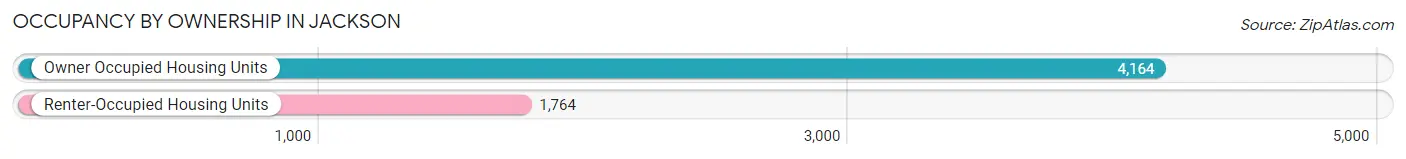
| Occupancy | # Housing Units | % Housing Units |
| Owner Occupied Housing Units | 4,164 | 70.2% |
| Renter-Occupied Housing Units | 1,764 | 29.8% |
| Total Occupied Housing Units | 5,928 | 100.0% |
Occupancy by Household Size in Jackson
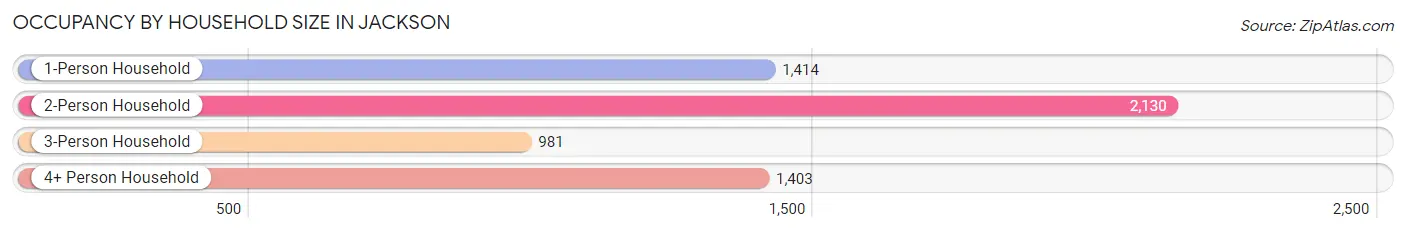
| Household Size | # Housing Units | % Housing Units |
| 1-Person Household | 1,414 | 23.8% |
| 2-Person Household | 2,130 | 35.9% |
| 3-Person Household | 981 | 16.6% |
| 4+ Person Household | 1,403 | 23.7% |
| Total Housing Units | 5,928 | 100.0% |
Occupancy by Ownership by Household Size in Jackson
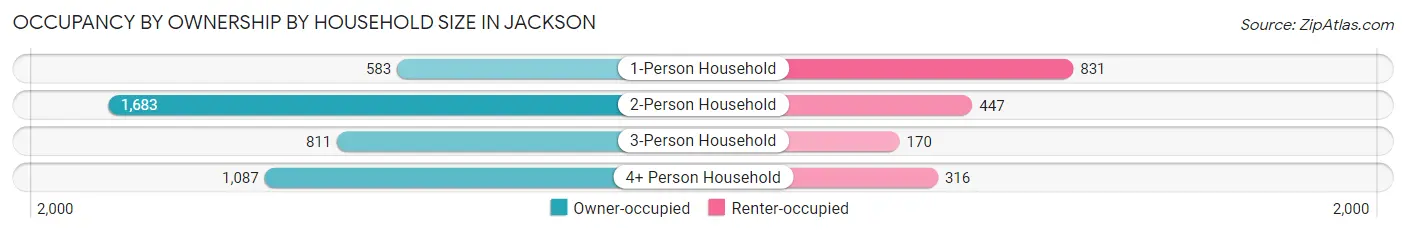
| Household Size | Owner-occupied | Renter-occupied |
| 1-Person Household | 583 (41.2%) | 831 (58.8%) |
| 2-Person Household | 1,683 (79.0%) | 447 (21.0%) |
| 3-Person Household | 811 (82.7%) | 170 (17.3%) |
| 4+ Person Household | 1,087 (77.5%) | 316 (22.5%) |
| Total Housing Units | 4,164 (70.2%) | 1,764 (29.8%) |
Occupancy by Educational Attainment in Jackson
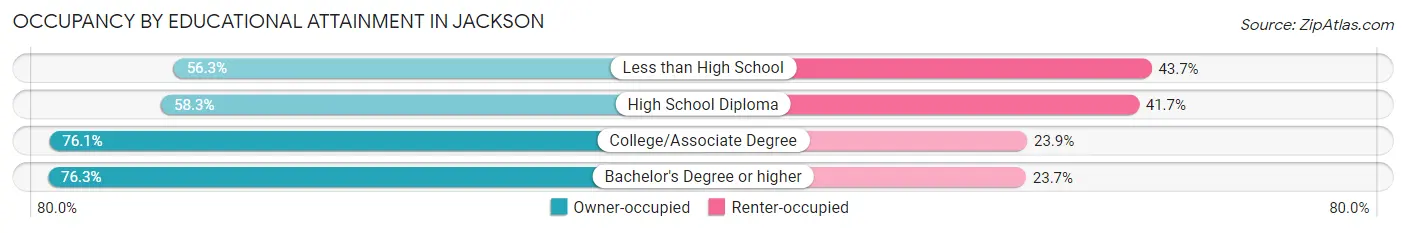
| Household Size | Owner-occupied | Renter-occupied |
| Less than High School | 231 (56.3%) | 179 (43.7%) |
| High School Diploma | 885 (58.3%) | 632 (41.7%) |
| College/Associate Degree | 1,275 (76.1%) | 401 (23.9%) |
| Bachelor's Degree or higher | 1,773 (76.3%) | 552 (23.7%) |
Occupancy by Age of Householder in Jackson
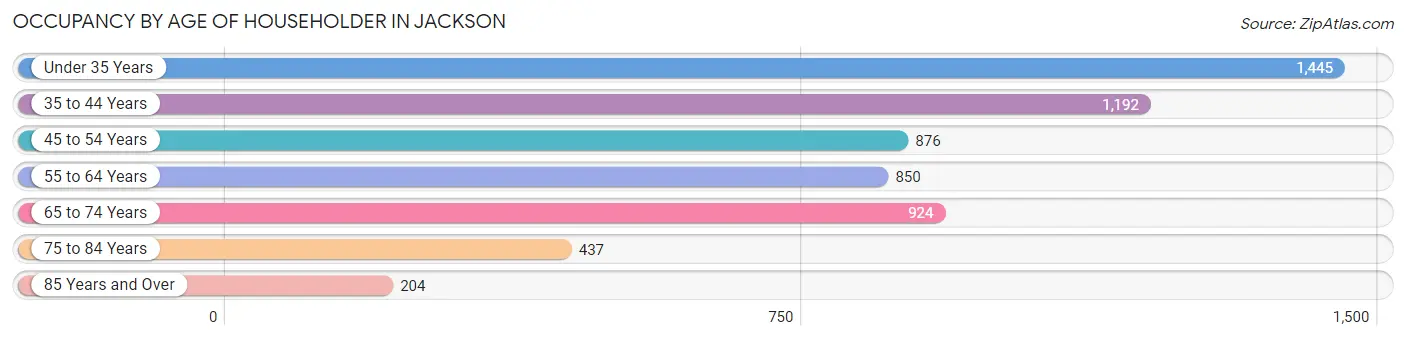
| Age Bracket | # Households | % Households |
| Under 35 Years | 1,445 | 24.4% |
| 35 to 44 Years | 1,192 | 20.1% |
| 45 to 54 Years | 876 | 14.8% |
| 55 to 64 Years | 850 | 14.3% |
| 65 to 74 Years | 924 | 15.6% |
| 75 to 84 Years | 437 | 7.4% |
| 85 Years and Over | 204 | 3.4% |
| Total | 5,928 | 100.0% |
Housing Finances in Jackson
Median Income by Occupancy in Jackson
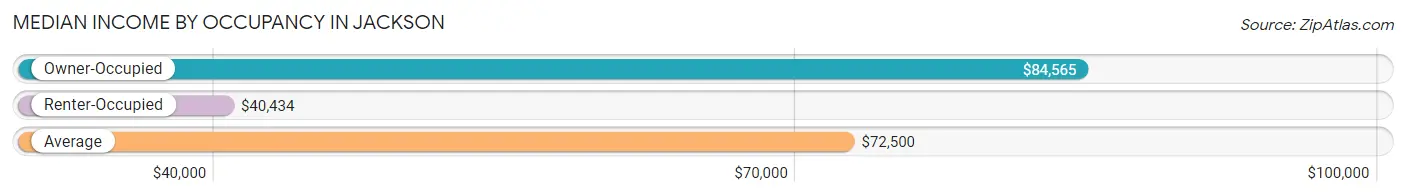
| Occupancy Type | # Households | Median Income |
| Owner-Occupied | 4,164 (70.2%) | $84,565 |
| Renter-Occupied | 1,764 (29.8%) | $40,434 |
| Average | 5,928 (100.0%) | $72,500 |
Occupancy by Householder Income Bracket in Jackson
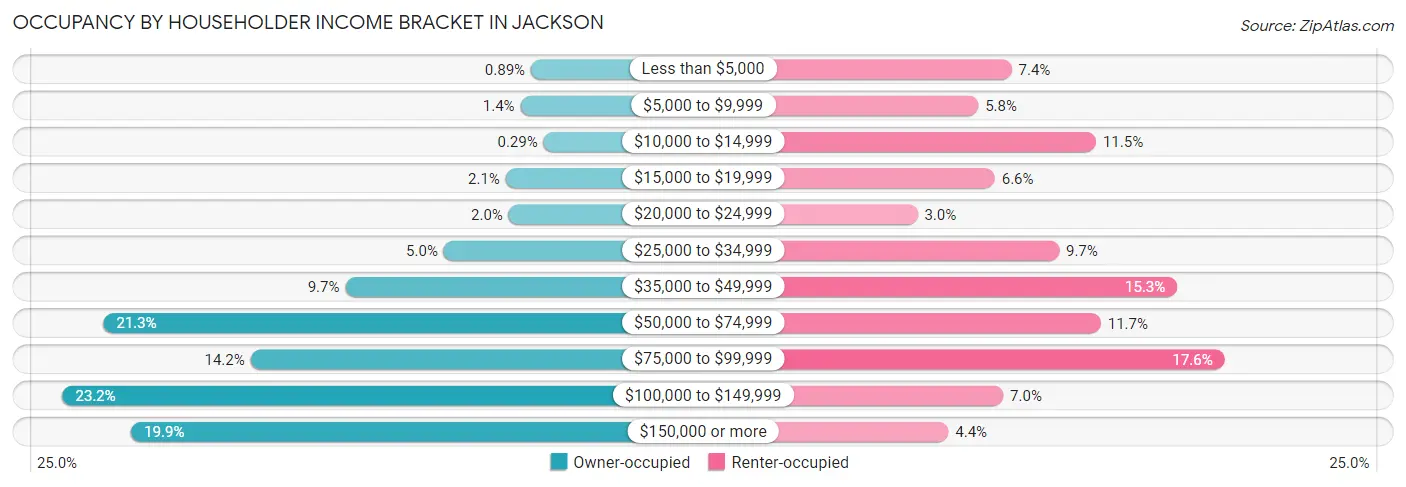
| Income Bracket | Owner-occupied | Renter-occupied |
| Less than $5,000 | 37 (0.9%) | 131 (7.4%) |
| $5,000 to $9,999 | 58 (1.4%) | 103 (5.8%) |
| $10,000 to $14,999 | 12 (0.3%) | 202 (11.5%) |
| $15,000 to $19,999 | 87 (2.1%) | 117 (6.6%) |
| $20,000 to $24,999 | 81 (1.9%) | 52 (2.9%) |
| $25,000 to $34,999 | 210 (5.0%) | 171 (9.7%) |
| $35,000 to $49,999 | 405 (9.7%) | 270 (15.3%) |
| $50,000 to $74,999 | 885 (21.2%) | 206 (11.7%) |
| $75,000 to $99,999 | 593 (14.2%) | 310 (17.6%) |
| $100,000 to $149,999 | 966 (23.2%) | 124 (7.0%) |
| $150,000 or more | 830 (19.9%) | 78 (4.4%) |
| Total | 4,164 (100.0%) | 1,764 (100.0%) |
Monthly Housing Cost Tiers in Jackson
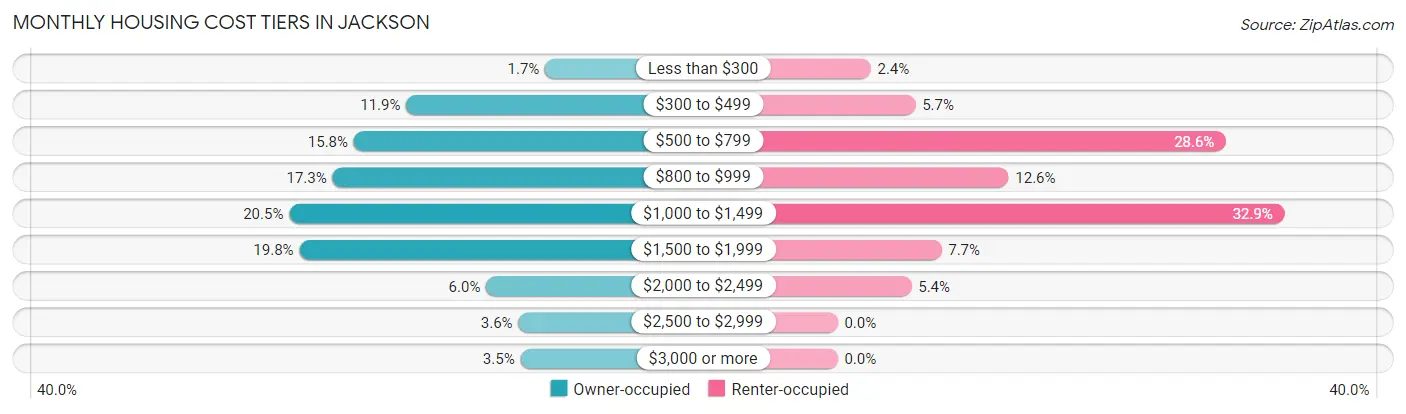
| Monthly Cost | Owner-occupied | Renter-occupied |
| Less than $300 | 69 (1.7%) | 43 (2.4%) |
| $300 to $499 | 495 (11.9%) | 101 (5.7%) |
| $500 to $799 | 656 (15.8%) | 505 (28.6%) |
| $800 to $999 | 721 (17.3%) | 222 (12.6%) |
| $1,000 to $1,499 | 854 (20.5%) | 581 (32.9%) |
| $1,500 to $1,999 | 823 (19.8%) | 135 (7.6%) |
| $2,000 to $2,499 | 250 (6.0%) | 96 (5.4%) |
| $2,500 to $2,999 | 151 (3.6%) | 0 (0.0%) |
| $3,000 or more | 145 (3.5%) | 0 (0.0%) |
| Total | 4,164 (100.0%) | 1,764 (100.0%) |
Physical Housing Characteristics in Jackson
Housing Structures in Jackson
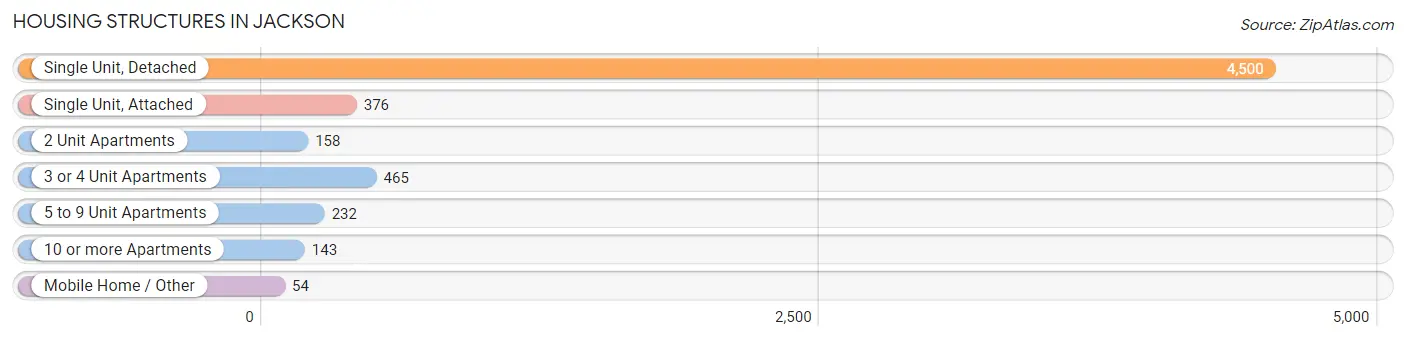
| Structure Type | # Housing Units | % Housing Units |
| Single Unit, Detached | 4,500 | 75.9% |
| Single Unit, Attached | 376 | 6.3% |
| 2 Unit Apartments | 158 | 2.7% |
| 3 or 4 Unit Apartments | 465 | 7.8% |
| 5 to 9 Unit Apartments | 232 | 3.9% |
| 10 or more Apartments | 143 | 2.4% |
| Mobile Home / Other | 54 | 0.9% |
| Total | 5,928 | 100.0% |
Housing Structures by Occupancy in Jackson
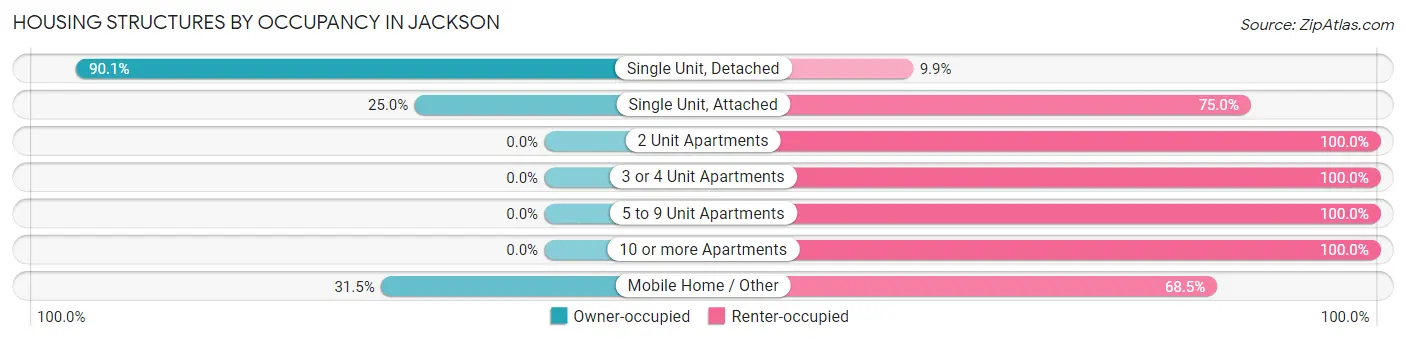
| Structure Type | Owner-occupied | Renter-occupied |
| Single Unit, Detached | 4,053 (90.1%) | 447 (9.9%) |
| Single Unit, Attached | 94 (25.0%) | 282 (75.0%) |
| 2 Unit Apartments | 0 (0.0%) | 158 (100.0%) |
| 3 or 4 Unit Apartments | 0 (0.0%) | 465 (100.0%) |
| 5 to 9 Unit Apartments | 0 (0.0%) | 232 (100.0%) |
| 10 or more Apartments | 0 (0.0%) | 143 (100.0%) |
| Mobile Home / Other | 17 (31.5%) | 37 (68.5%) |
| Total | 4,164 (70.2%) | 1,764 (29.8%) |
Housing Structures by Number of Rooms in Jackson
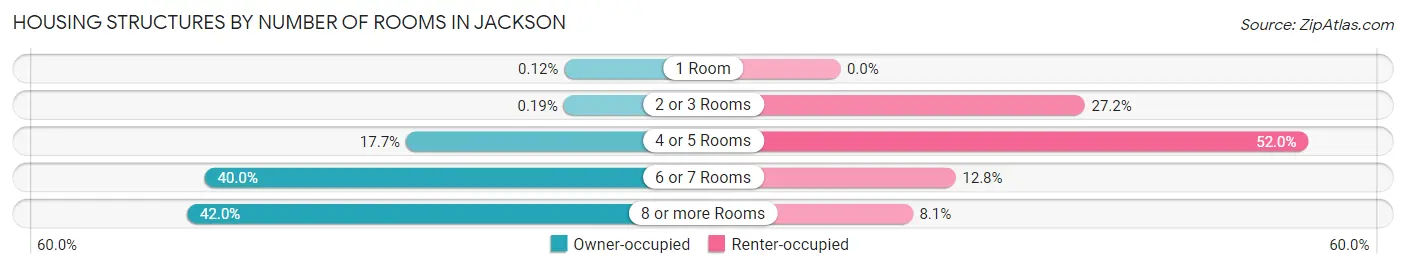
| Number of Rooms | Owner-occupied | Renter-occupied |
| 1 Room | 5 (0.1%) | 0 (0.0%) |
| 2 or 3 Rooms | 8 (0.2%) | 479 (27.2%) |
| 4 or 5 Rooms | 736 (17.7%) | 917 (52.0%) |
| 6 or 7 Rooms | 1,667 (40.0%) | 226 (12.8%) |
| 8 or more Rooms | 1,748 (42.0%) | 142 (8.1%) |
| Total | 4,164 (100.0%) | 1,764 (100.0%) |
Housing Structure by Heating Type in Jackson
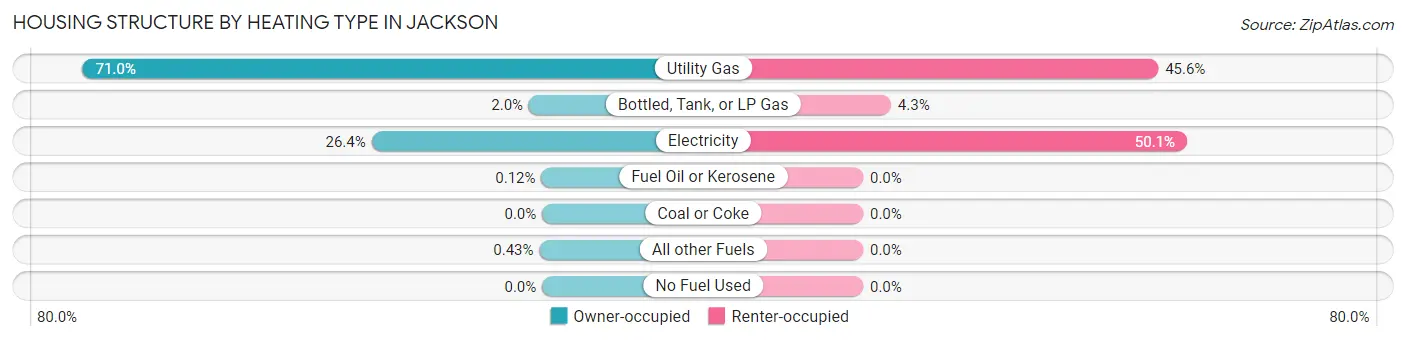
| Heating Type | Owner-occupied | Renter-occupied |
| Utility Gas | 2,958 (71.0%) | 805 (45.6%) |
| Bottled, Tank, or LP Gas | 85 (2.0%) | 76 (4.3%) |
| Electricity | 1,098 (26.4%) | 883 (50.1%) |
| Fuel Oil or Kerosene | 5 (0.1%) | 0 (0.0%) |
| Coal or Coke | 0 (0.0%) | 0 (0.0%) |
| All other Fuels | 18 (0.4%) | 0 (0.0%) |
| No Fuel Used | 0 (0.0%) | 0 (0.0%) |
| Total | 4,164 (100.0%) | 1,764 (100.0%) |
Household Vehicle Usage in Jackson
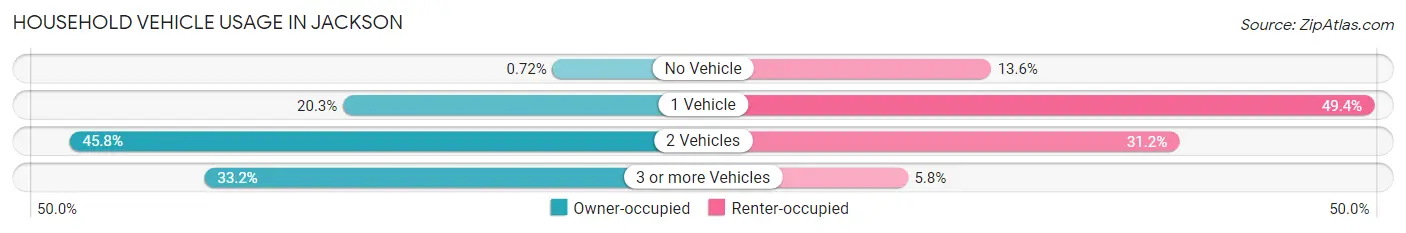
| Vehicles per Household | Owner-occupied | Renter-occupied |
| No Vehicle | 30 (0.7%) | 240 (13.6%) |
| 1 Vehicle | 844 (20.3%) | 871 (49.4%) |
| 2 Vehicles | 1,907 (45.8%) | 550 (31.2%) |
| 3 or more Vehicles | 1,383 (33.2%) | 103 (5.8%) |
| Total | 4,164 (100.0%) | 1,764 (100.0%) |
Real Estate & Mortgages in Jackson
Real Estate and Mortgage Overview in Jackson
| Characteristic | Without Mortgage | With Mortgage |
| Housing Units | 1,175 | 2,989 |
| Median Property Value | $210,900 | $222,200 |
| Median Household Income | $70,656 | $658 |
| Monthly Housing Costs | $514 | $145 |
| Real Estate Taxes | $1,479 | $14 |
Property Value by Mortgage Status in Jackson
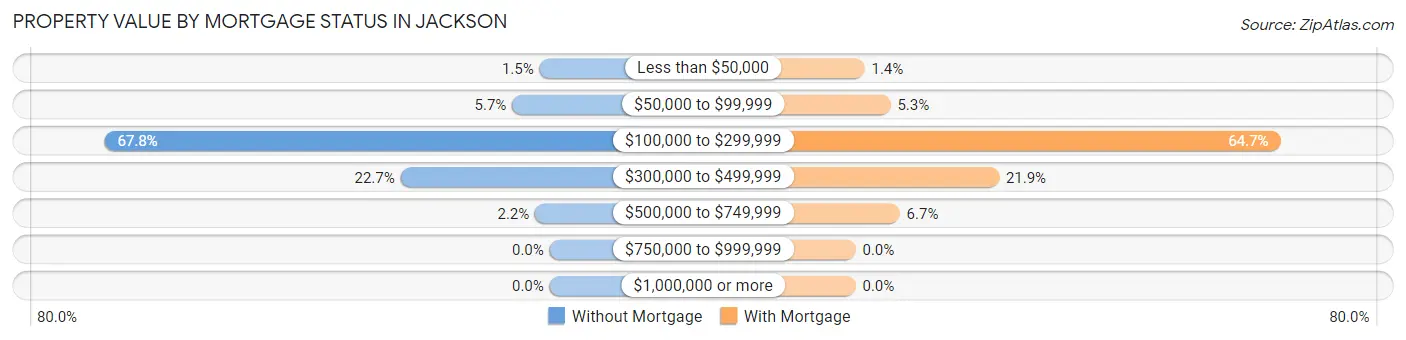
| Property Value | Without Mortgage | With Mortgage |
| Less than $50,000 | 18 (1.5%) | 41 (1.4%) |
| $50,000 to $99,999 | 67 (5.7%) | 159 (5.3%) |
| $100,000 to $299,999 | 797 (67.8%) | 1,935 (64.7%) |
| $300,000 to $499,999 | 267 (22.7%) | 653 (21.8%) |
| $500,000 to $749,999 | 26 (2.2%) | 201 (6.7%) |
| $750,000 to $999,999 | 0 (0.0%) | 0 (0.0%) |
| $1,000,000 or more | 0 (0.0%) | 0 (0.0%) |
| Total | 1,175 (100.0%) | 2,989 (100.0%) |
Household Income by Mortgage Status in Jackson
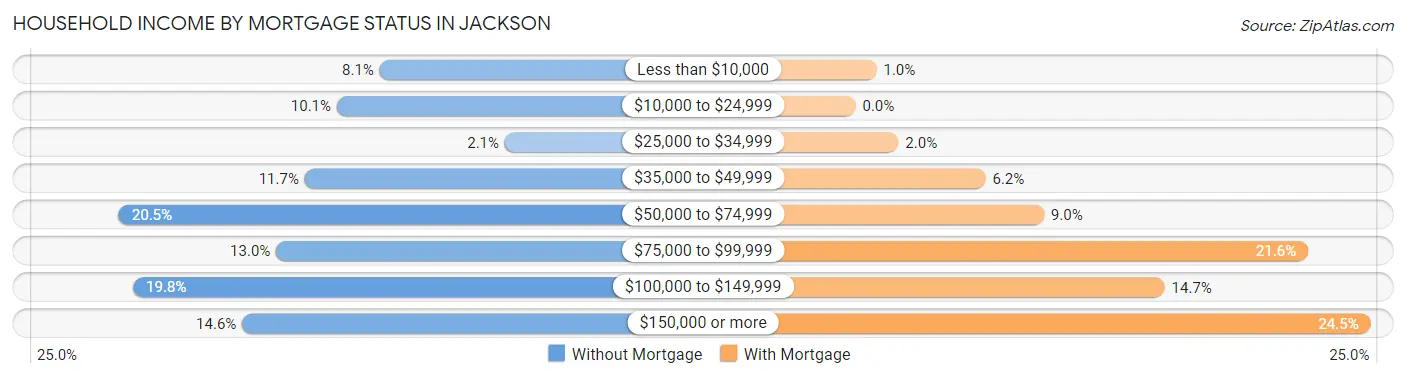
| Household Income | Without Mortgage | With Mortgage |
| Less than $10,000 | 95 (8.1%) | 30 (1.0%) |
| $10,000 to $24,999 | 119 (10.1%) | 0 (0.0%) |
| $25,000 to $34,999 | 25 (2.1%) | 61 (2.0%) |
| $35,000 to $49,999 | 137 (11.7%) | 185 (6.2%) |
| $50,000 to $74,999 | 241 (20.5%) | 268 (9.0%) |
| $75,000 to $99,999 | 153 (13.0%) | 644 (21.5%) |
| $100,000 to $149,999 | 233 (19.8%) | 440 (14.7%) |
| $150,000 or more | 172 (14.6%) | 733 (24.5%) |
| Total | 1,175 (100.0%) | 2,989 (100.0%) |
Property Value to Household Income Ratio in Jackson
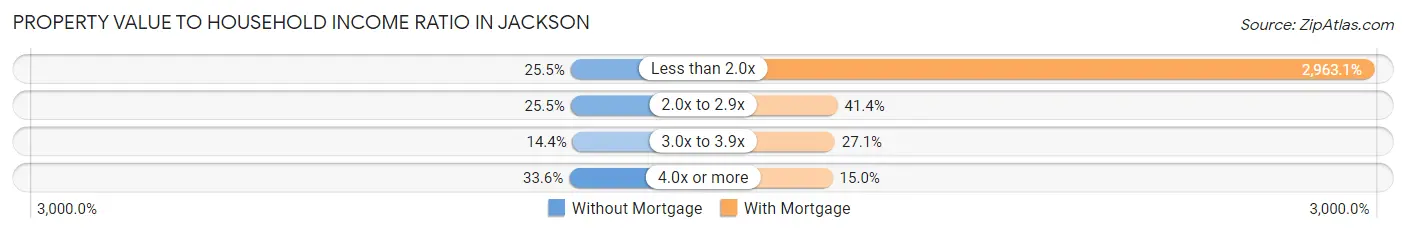
| Value-to-Income Ratio | Without Mortgage | With Mortgage |
| Less than 2.0x | 299 (25.5%) | 88,568 (2,963.1%) |
| 2.0x to 2.9x | 300 (25.5%) | 1,238 (41.4%) |
| 3.0x to 3.9x | 169 (14.4%) | 810 (27.1%) |
| 4.0x or more | 395 (33.6%) | 447 (14.9%) |
| Total | 1,175 (100.0%) | 2,989 (100.0%) |
Real Estate Taxes by Mortgage Status in Jackson
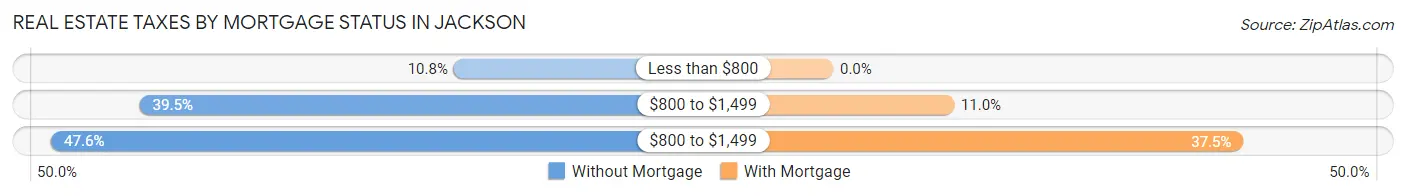
| Property Taxes | Without Mortgage | With Mortgage |
| Less than $800 | 127 (10.8%) | 0 (0.0%) |
| $800 to $1,499 | 464 (39.5%) | 330 (11.0%) |
| $800 to $1,499 | 559 (47.6%) | 1,120 (37.5%) |
| Total | 1,175 (100.0%) | 2,989 (100.0%) |
Health & Disability in Jackson
Health Insurance Coverage by Age in Jackson
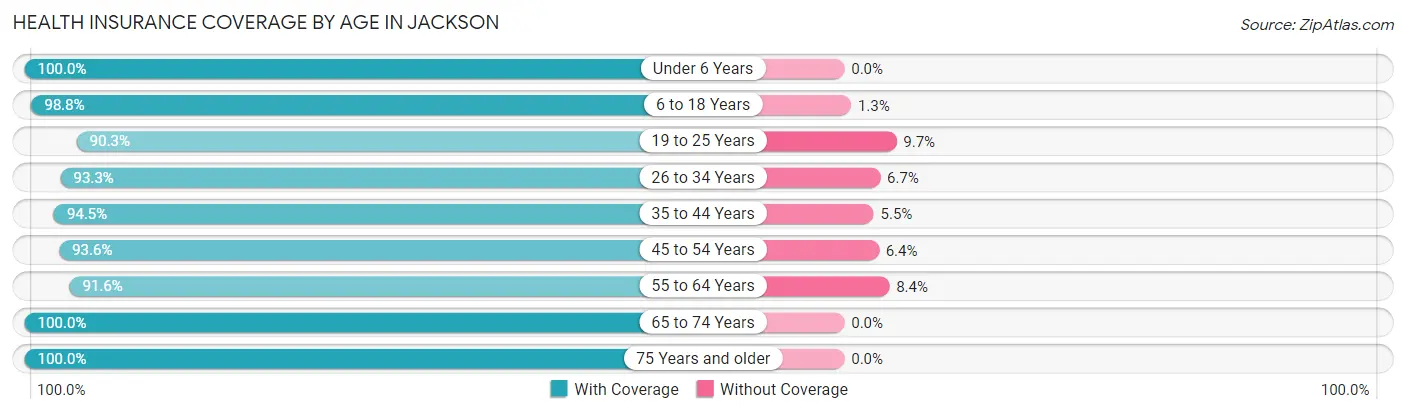
| Age Bracket | With Coverage | Without Coverage |
| Under 6 Years | 1,201 (100.0%) | 0 (0.0%) |
| 6 to 18 Years | 3,005 (98.8%) | 38 (1.3%) |
| 19 to 25 Years | 1,172 (90.3%) | 126 (9.7%) |
| 26 to 34 Years | 1,873 (93.3%) | 134 (6.7%) |
| 35 to 44 Years | 2,026 (94.5%) | 117 (5.5%) |
| 45 to 54 Years | 1,502 (93.6%) | 103 (6.4%) |
| 55 to 64 Years | 1,358 (91.6%) | 124 (8.4%) |
| 65 to 74 Years | 1,310 (100.0%) | 0 (0.0%) |
| 75 Years and older | 981 (100.0%) | 0 (0.0%) |
| Total | 14,428 (95.7%) | 642 (4.3%) |
Health Insurance Coverage by Citizenship Status in Jackson
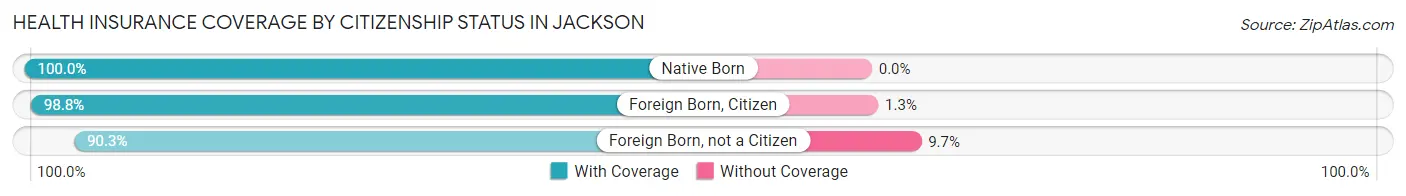
| Citizenship Status | With Coverage | Without Coverage |
| Native Born | 1,201 (100.0%) | 0 (0.0%) |
| Foreign Born, Citizen | 3,005 (98.8%) | 38 (1.3%) |
| Foreign Born, not a Citizen | 1,172 (90.3%) | 126 (9.7%) |
Health Insurance Coverage by Household Income in Jackson
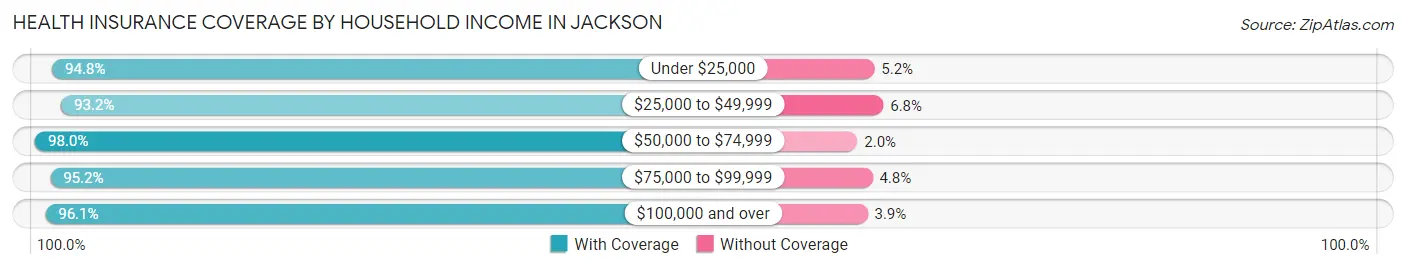
| Household Income | With Coverage | Without Coverage |
| Under $25,000 | 1,159 (94.8%) | 63 (5.2%) |
| $25,000 to $49,999 | 1,894 (93.2%) | 139 (6.8%) |
| $50,000 to $74,999 | 3,035 (98.0%) | 61 (2.0%) |
| $75,000 to $99,999 | 2,650 (95.2%) | 134 (4.8%) |
| $100,000 and over | 5,654 (96.1%) | 228 (3.9%) |
Public vs Private Health Insurance Coverage by Age in Jackson
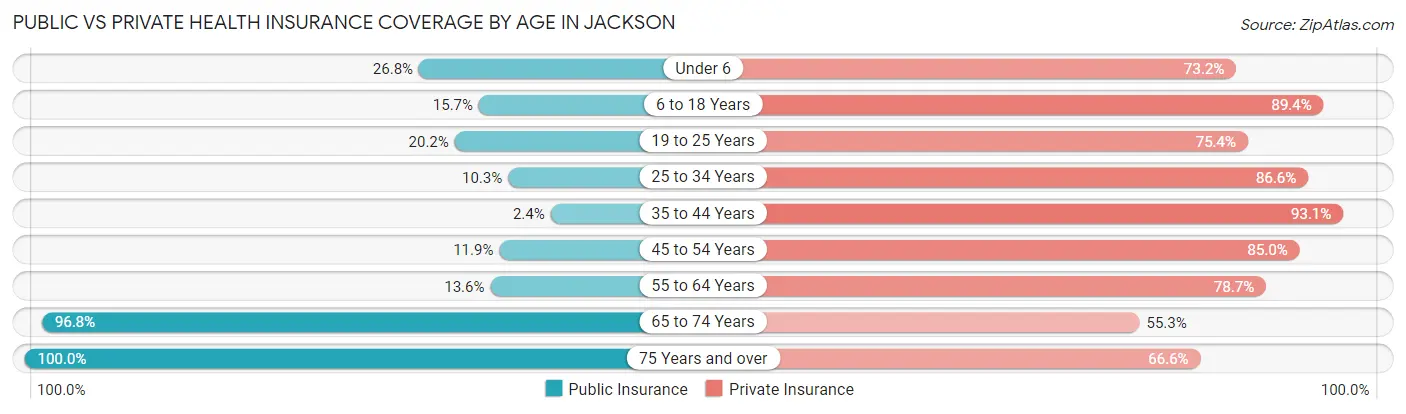
| Age Bracket | Public Insurance | Private Insurance |
| Under 6 | 322 (26.8%) | 879 (73.2%) |
| 6 to 18 Years | 477 (15.7%) | 2,721 (89.4%) |
| 19 to 25 Years | 262 (20.2%) | 978 (75.3%) |
| 25 to 34 Years | 206 (10.3%) | 1,737 (86.6%) |
| 35 to 44 Years | 51 (2.4%) | 1,994 (93.0%) |
| 45 to 54 Years | 191 (11.9%) | 1,364 (85.0%) |
| 55 to 64 Years | 201 (13.6%) | 1,167 (78.7%) |
| 65 to 74 Years | 1,268 (96.8%) | 724 (55.3%) |
| 75 Years and over | 981 (100.0%) | 653 (66.6%) |
| Total | 3,959 (26.3%) | 12,217 (81.1%) |
Disability Status by Sex by Age in Jackson
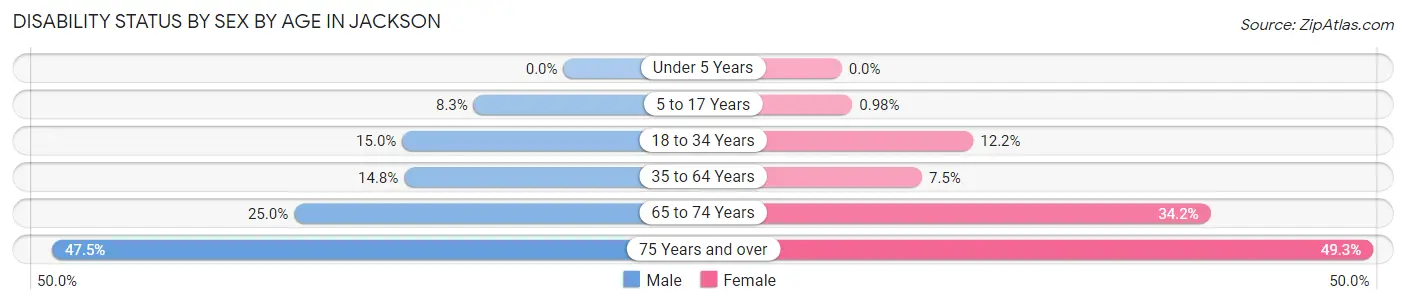
| Age Bracket | Male | Female |
| Under 5 Years | 0 (0.0%) | 0 (0.0%) |
| 5 to 17 Years | 143 (8.3%) | 13 (1.0%) |
| 18 to 34 Years | 229 (15.0%) | 230 (12.2%) |
| 35 to 64 Years | 384 (14.8%) | 196 (7.4%) |
| 65 to 74 Years | 128 (25.0%) | 273 (34.2%) |
| 75 Years and over | 196 (47.5%) | 280 (49.3%) |
Disability Class by Sex by Age in Jackson
Disability Class: Hearing Difficulty
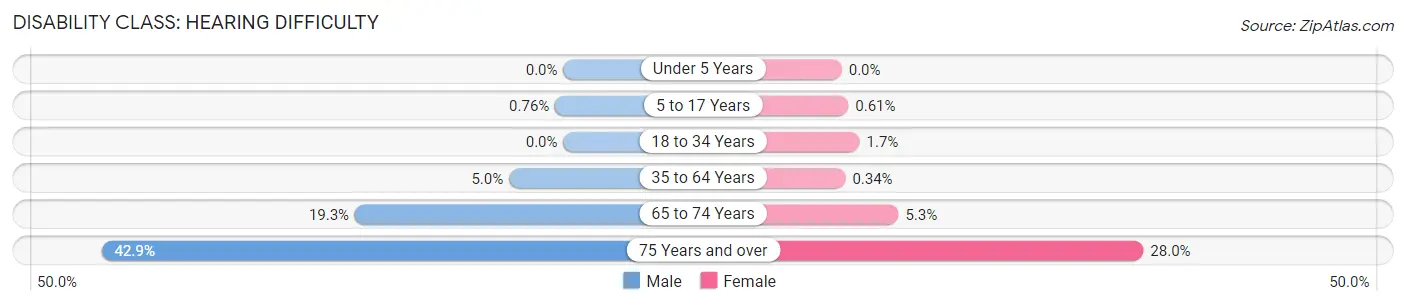
| Age Bracket | Male | Female |
| Under 5 Years | 0 (0.0%) | 0 (0.0%) |
| 5 to 17 Years | 13 (0.8%) | 8 (0.6%) |
| 18 to 34 Years | 0 (0.0%) | 31 (1.7%) |
| 35 to 64 Years | 131 (5.0%) | 9 (0.3%) |
| 65 to 74 Years | 99 (19.3%) | 42 (5.3%) |
| 75 Years and over | 177 (42.9%) | 159 (28.0%) |
Disability Class: Vision Difficulty
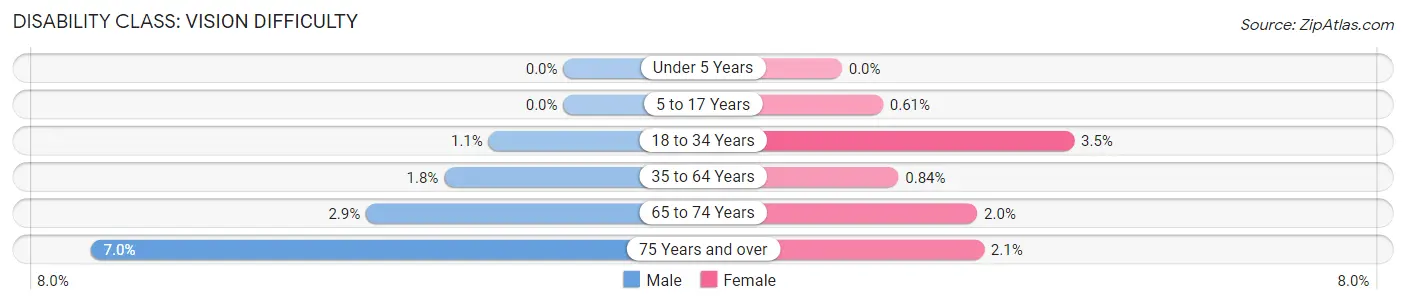
| Age Bracket | Male | Female |
| Under 5 Years | 0 (0.0%) | 0 (0.0%) |
| 5 to 17 Years | 0 (0.0%) | 8 (0.6%) |
| 18 to 34 Years | 17 (1.1%) | 65 (3.5%) |
| 35 to 64 Years | 46 (1.8%) | 22 (0.8%) |
| 65 to 74 Years | 15 (2.9%) | 16 (2.0%) |
| 75 Years and over | 29 (7.0%) | 12 (2.1%) |
Disability Class: Cognitive Difficulty
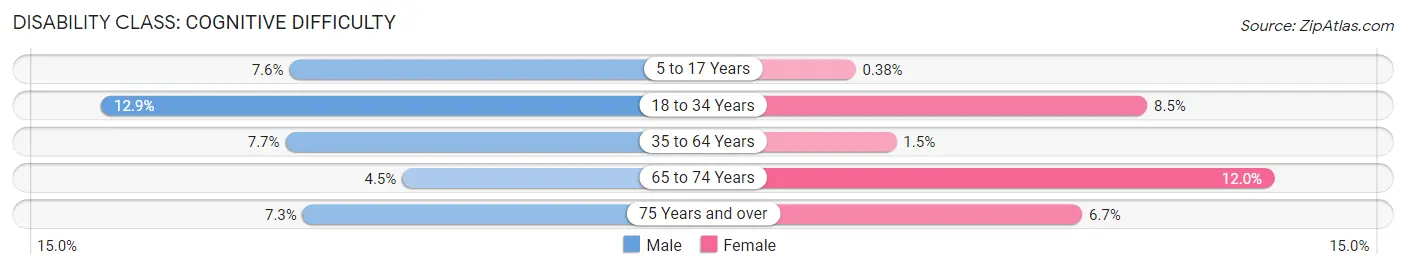
| Age Bracket | Male | Female |
| 5 to 17 Years | 131 (7.6%) | 5 (0.4%) |
| 18 to 34 Years | 197 (12.9%) | 160 (8.5%) |
| 35 to 64 Years | 201 (7.7%) | 40 (1.5%) |
| 65 to 74 Years | 23 (4.5%) | 96 (12.0%) |
| 75 Years and over | 30 (7.3%) | 38 (6.7%) |
Disability Class: Ambulatory Difficulty
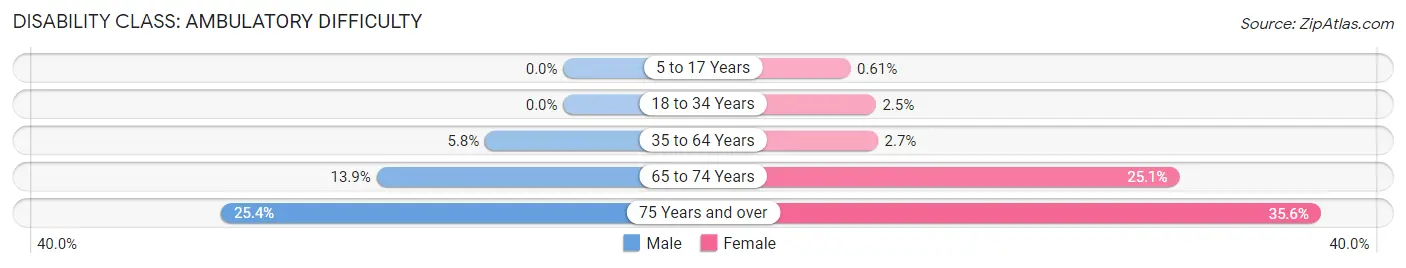
| Age Bracket | Male | Female |
| 5 to 17 Years | 0 (0.0%) | 8 (0.6%) |
| 18 to 34 Years | 0 (0.0%) | 47 (2.5%) |
| 35 to 64 Years | 151 (5.8%) | 70 (2.7%) |
| 65 to 74 Years | 71 (13.9%) | 200 (25.1%) |
| 75 Years and over | 105 (25.4%) | 202 (35.6%) |
Disability Class: Self-Care Difficulty
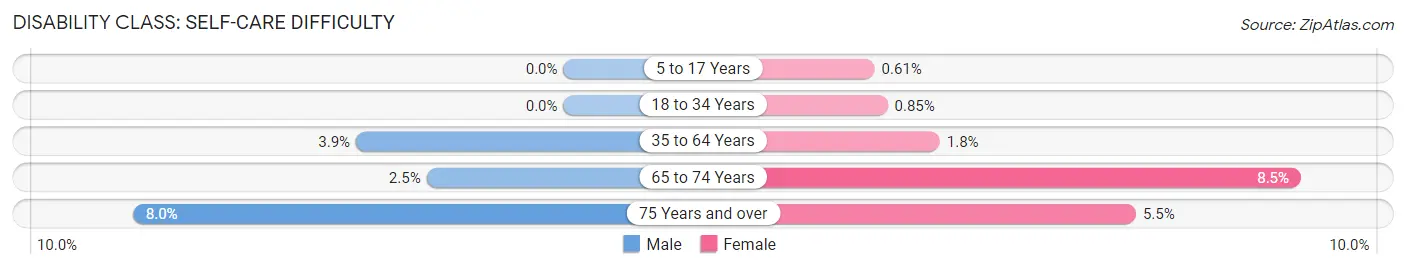
| Age Bracket | Male | Female |
| 5 to 17 Years | 0 (0.0%) | 8 (0.6%) |
| 18 to 34 Years | 0 (0.0%) | 16 (0.9%) |
| 35 to 64 Years | 100 (3.8%) | 48 (1.8%) |
| 65 to 74 Years | 13 (2.5%) | 68 (8.5%) |
| 75 Years and over | 33 (8.0%) | 31 (5.5%) |
Technology Access in Jackson
Computing Device Access in Jackson
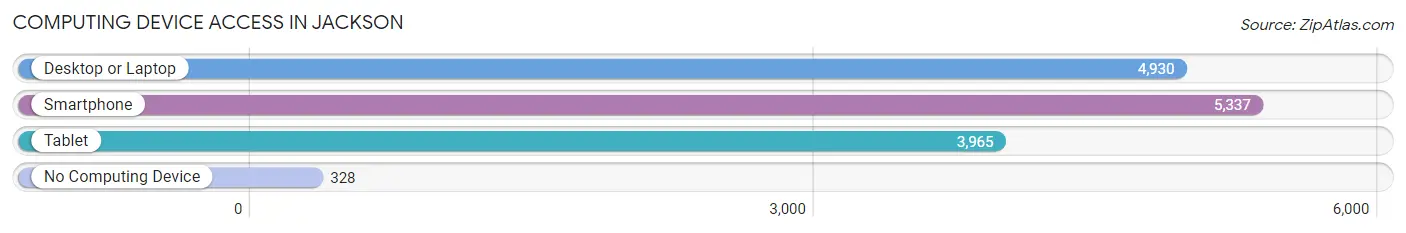
| Device Type | # Households | % Households |
| Desktop or Laptop | 4,930 | 83.2% |
| Smartphone | 5,337 | 90.0% |
| Tablet | 3,965 | 66.9% |
| No Computing Device | 328 | 5.5% |
| Total | 5,928 | 100.0% |
Internet Access in Jackson
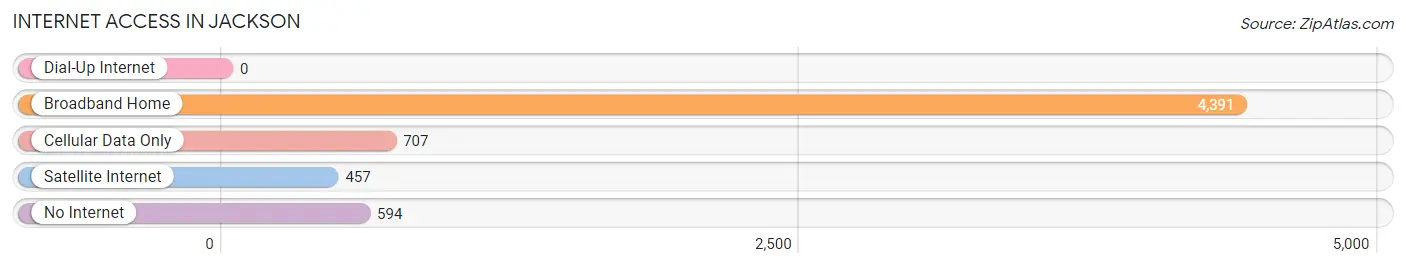
| Internet Type | # Households | % Households |
| Dial-Up Internet | 0 | 0.0% |
| Broadband Home | 4,391 | 74.1% |
| Cellular Data Only | 707 | 11.9% |
| Satellite Internet | 457 | 7.7% |
| No Internet | 594 | 10.0% |
| Total | 5,928 | 100.0% |
Jackson Summary
Jackson, Missouri is a city located in Cape Girardeau County, in the southeastern corner of the state. It is the county seat and the largest city in the county. The city is situated along the Mississippi River, and is part of the Cape Girardeau–Jackson metropolitan area. The population of Jackson was estimated to be 13,758 in 2019.
History
Jackson was founded in 1818 by William Jackson, a Revolutionary War veteran. The city was named after him, and was incorporated in 1822. Jackson was the first county seat of Cape Girardeau County, and was the site of the first courthouse in the county.
In the early 19th century, Jackson was a major port on the Mississippi River, and was a major center for the steamboat industry. The city was also a major center for the cotton industry, and was home to several cotton mills.
In the late 19th century, Jackson became a major railroad hub, with several railroads connecting the city to other parts of the country. The city was also home to several manufacturing plants, including a shoe factory, a furniture factory, and a canning factory.
Geography
Jackson is located in the southeastern corner of Missouri, in Cape Girardeau County. The city is situated along the Mississippi River, and is part of the Cape Girardeau–Jackson metropolitan area. The city is located about 90 miles south of St. Louis, and about 120 miles north of Memphis, Tennessee.
The city has a total area of 8.3 square miles, of which 8.2 square miles is land and 0.1 square miles is water. The city is located in a hilly region, and is surrounded by forests and farmland.
Economy
Jackson’s economy is largely based on manufacturing and agriculture. The city is home to several manufacturing plants, including a shoe factory, a furniture factory, and a canning factory. The city is also home to several agricultural businesses, including a dairy farm, a poultry farm, and a hog farm.
The city is also home to several retail businesses, including several restaurants, grocery stores, and clothing stores. The city is also home to several medical facilities, including a hospital and several clinics.
Demographics
As of the 2019 census, the population of Jackson was estimated to be 13,758. The racial makeup of the city was 87.3% White, 8.2% African American, 0.7% Native American, 0.7% Asian, 0.1% Pacific Islander, 0.7% from other races, and 2.3% from two or more races. Hispanic or Latino of any race were 2.3% of the population.
The median household income in Jackson was $41,945, and the median family income was $50,945. The per capita income in the city was $20,945. About 15.3% of the population was below the poverty line.
Common Questions
What is Per Capita Income in Jackson?
Per Capita income in Jackson is $35,811.
What is the Median Family Income in Jackson?
Median Family Income in Jackson is $85,471.
What is the Median Household income in Jackson?
Median Household Income in Jackson is $72,500.
What is Income or Wage Gap in Jackson?
Income or Wage Gap in Jackson is 38.6%.
Women in Jackson earn 61.4 cents for every dollar earned by a man.
What is Inequality or Gini Index in Jackson?
Inequality or Gini Index in Jackson is 0.43.
What is the Total Population of Jackson?
Total Population of Jackson is 15,394.
What is the Total Male Population of Jackson?
Total Male Population of Jackson is 7,543.
What is the Total Female Population of Jackson?
Total Female Population of Jackson is 7,851.
What is the Ratio of Males per 100 Females in Jackson?
There are 96.08 Males per 100 Females in Jackson.
What is the Ratio of Females per 100 Males in Jackson?
There are 104.08 Females per 100 Males in Jackson.
What is the Median Population Age in Jackson?
Median Population Age in Jackson is 35.0 Years.
What is the Average Family Size in Jackson
Average Family Size in Jackson is 3.0 People.
What is the Average Household Size in Jackson
Average Household Size in Jackson is 2.5 People.
How Large is the Labor Force in Jackson?
There are 7,805 People in the Labor Forcein in Jackson.
What is the Percentage of People in the Labor Force in Jackson?
66.4% of People are in the Labor Force in Jackson.
What is the Unemployment Rate in Jackson?
Unemployment Rate in Jackson is 3.8%.